Public Cloud Market (2026 - 2035)

按服务模式(IAAS、SAAS、PAAS)按组织规模(中小企业和大型企业)、按行业(IT 和电信、制造业、BFSI、零售、医疗保健、政府、航空航天和国防等)和按地区(北美、欧洲、亚太地区、中东和非洲以及南美洲)划分的公共云市场研究报告 – 到 2032 年的行业规模、份额和预测
ID: MRFR/SEM/1684-CR
179 Pages
Aarti Dhapte, Shubham Munde
Last Updated: July 20, 2026
Public Cloud Market
Market Size
Forecast Period2026-2035
CAGR (2026-2035)16.2%
2025 Market SizeUSD 0.78 Trillion
2035 Market SizeUSD 3.51 Trillion
Key Players
Amazon Web Services
Microsoft Azure
Google Cloud
Alibaba Cloud
Salesforce
IBM Cloud
Opportunities
  • Industry-Specific Cloud Platforms
  • Edge-Cloud Convergence in Emerging Markets
  • AI-as-a-Service and Data Monetization

公有云市场总结

公共云市场预计到 2025 年将达到 0.78 万亿美元,预计将从 2026 年的 0.91 万亿美元增长到 2035 年的 3.51 万亿美元,预测期内复合年增长率为 16.2%。企业不再争论是否迁移——他们正在竞争在云原生架构上重建技术资产的速度。加速生成式人工智能投资,2024 年全球投资额将超过 1500 亿美元[1]以及 40 多个国家/地区的主权云授权是推动支出远远超出传统 IT 预算模型预期的双重催化剂。

遗产d阿塔中心十年前签署的合同现在已大规模到期,使企业可以自由地跨超大规模提供商重新协商工作负载。仅美国联邦政府就在 2024 财年通过 FedRAMP 授权的供应商承担了超过 100 亿美元的云采购 [2],而欧盟委员会的 GAIA-X 框架继续将投资引导至联合云生态系统[3]。这波更新支出是结构性的,而不是周期性的。

到 2025 年,北美将占据约 41% 的公共云市场,以超大规模企业总部和全球最深入的企业软件生态系统为基础。在印度数字印度计划和中国工业云指令的推动下,亚太地区成为增长最快的地区,预计复合年增长率为 19.4%[4]。欧洲占据第二大份额,约为 25%,GDPR 驱动的数据本地化要求创造了顶级的主权云产品。监管压力和人工智能准备度之间的相互作用将决定 2035 年之前的公共云市场轨迹。

报告要点

• 按部署模型

  • 到 2025 年,软件即服务 (SaaS) 占据公共云市场约 52% 的份额,反映出基于订阅的企业应用程序的主导地位。
  • 在开发人员对托管 AI/ML 工具链和低代码平台的需求的推动下,平台即服务 (PaaS) 预计到 2035 年将以 20.4% 的复合年增长率增长。
  • 在 GPU 密集型工作负载的推动下,基础设施即服务 (IaaS) 产生了最高的每客户收入。

• 按组织规模

  • 到 2025 年,大型企业约占公共云市场份额的 62%,根据企业许可协议整合工作负载。
  • 中小型企业是增长最快的细分市场,在即用即付定价的帮助下,预计复合年增长率为 19.4%。

• 按地区

  • 到 2025 年,北美仍将保持公有云市场的最大份额,其中以美国为首。
  • 预计 2026 年至 2035 年间,亚太地区的复合年增长率将达到 19.4%,是最高的地区。


公共云市场规模和预测(2021-2035)

Market Research Future 的估​​计将超大规模财务披露的自上而下的收入跟踪与涵盖 28 个国家/地区 4,200 个组织的自下而上的企业调查数据结合起来。历史数据反映了实际报告的支出;预测值采用经过校准的复合年增长率并根据宏观周期影响进行调整。
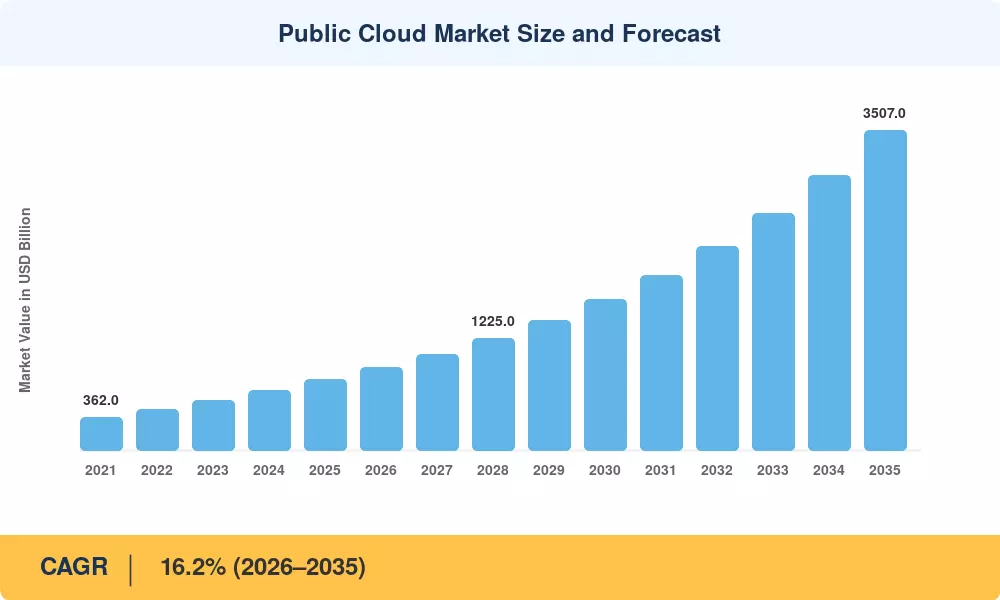
Public Cloud Market Size and Forecast

驾驶员影响分析

司机 ~% 对复合年增长率的影响 地理相关性 影响时间表 参考号
生成式人工智能工作负载激增 +2.8 全球的 短期 [1]
主权云监管要求 +1.9 欧洲、亚太地区 中期 [3]
中小企业云优先迁移计划 +1.5 亚太地区、南美洲 中期 [9]
绿色数据中心激励计划 +1.2 欧洲、北美 长期 [10]
5G与边云融合 +1.0 全球的 长期 [12]
政府数字服务现代化 +0.9 北美、MEA 短期 [2]
行业专用云平台 +0.7 全球的 中期 [13]

生成式 AI 工作负载激增

到2024年,全球企业对人工智能基础设施的投资大幅增加,私人和行业人工智能投资总额约为2520亿美元。这笔资金的很大一部分将投入公共云 GPU 实例,使超大规模企业能够快速扩展其人工智能优化的基础设施。云提供商仍在扩大全球可用区,大型 IT 公司创纪录的资本支出承诺凸显了这种扩张的规模。这种需求周期主要是自我强化的:随着基础模型训练成本持续下降,企业对云原生推理量的依赖增加,从而保持高性能计算集群的持续高利用率。

主权云监管要求

2025年9月全面生效的欧盟数据法案显着提高了对云公司的互操作性和数据可移植性要求。数据本地化和数字主权的全球趋势反映在类似的法律举措中,例如日本《电信商业法》的修改和印度的发展中国家数据保护框架。由于这些法规,云市场正在发生巨大变化,提供商创建了更多遵守严格区域合规性要求的“主权云”区域。这些专业领域对于在金融、医疗保健和政府等高度监管的行业中保持市场主导地位变得至关重要,尽管由于严格遵守监管所涉及的运营和硬件费用较高,它们经常要求价格溢价。


中小企业云优先迁移计划

政府支持的数字化补贴(例如新加坡的中小企业数字化计划和巴西的 Programa Brasil Mais)降低了小企业采用云的障碍[9]。仅在亚太地区,估计就有 1200 万中小企业在 2022 年至 2024 年间将主要工作负载迁移到公共云。即用即付的消费模式消除了以往小型组织依赖于本地服务器的资本支出障碍。


限制影响分析

下面的限制估计是方向性的,反映了部分抵消增长动力的逆风,而不会降低整体正复合年增长率轨迹。

克制 ~% 对复合年增长率的影响 地理相关性 影响时间表 参考号
供应商锁定和出口费用摩擦 –0.9 全球的 短期 [15]
网络安全和数据泄露责任 –0.7 北美、欧洲 中期 [16]
熟练的云劳动力短缺 –0.6 全球的 长期 [17]
数据中心能源消耗问题 –0.5 欧洲、北美 长期 [10]
定价复杂性和成本超支 –0.4 全球的 短期 [18]


供应商锁定和出口费用摩擦

尽管监管部门在可移植性方面做出了努力,但出口费用仍然是一个真正的转换障碍。根据 2024 年 Flexera 调查,37% 的企业表示,他们最大的云问题是供应商锁定[15]。由于《欧盟数据法案》的互操作性规则,这一障碍在欧洲将得到缓解,但由于执行期限和技术标准协调,可能要到 2027 年至 2028 年才能获得重大缓解。


网络安全和数据泄露责任

备受瞩目的违规行为(包括 2024 年的一次事件,该事件暴露了一家主要 SaaS 提供商租户群中的 1 亿条记录),加强了监管审查[16]。符合 SOC 2 Type II、ISO 27017 和 SEC 等框架网络安全- 披露规则增加了运营成本层,从而减慢了采购周期,特别是对于为金融服务客户提供服务的公共云市场参与者而言。


公有云市场机会

特定行业的云平台

超大规模企业正在为医疗保健、金融服务和制造业构建垂直云,嵌入合规护栏和特定于行业的数据模型[13]。这些预先配置的平台将集成时间缩短了 40-60%,为公共云市场供应商创造了追加销售机会。

新兴市场的边缘与云融合

东南亚、撒哈拉以南非洲和拉丁美洲的电信运营商正在 5G 蜂窝站点部署微型数据中心节点,将公共云服务扩展到对延迟敏感的应用程序[12]。预计到 2032 年,这种边缘云架构将带来 850 亿美元的增量支出。

人工智能即服务和数据货币化

云提供商正在核心计算之上分层基础模型 API、矢量数据库和检索增强生成工具包,使企业能够将专有数据资产货币化,而无需从头开始构建 AI 堆栈[1]。这种从原始基础设施到智能即服务的转变扩大了公共云市场中每个客户的 ARPU。

与可持续发展相关的云采购

集成到云计费仪表板中的碳核算平台使企业能够跟踪计算使用中的范围 3 排放[10]。 IEA 估计,到 2024 年,全球数据中心将消耗 460 太瓦时的电力,这加剧了对绿色能源供电可用区的需求。

政府数字服务现代化

发展中国家正在通过云托管平台实现公民服务的数字化——纳税申报、健康记录、土地登记。印度的 MeghRaj 计划和沙特阿拉伯的 YESSER 电子政务计划代表了公共云市场数十亿美元的采购渠道。


公有云市场未来展望

自主云运营

到 2020 年代末,AIOps 平台将以最少的人为干预来管理配置、安全补丁和成本优化。项目显示,到 2028 年,70% 的企业将使用人工智能增强的云管理工具[8],压缩运营人员数量并将云团队转向战略架构角色。

平台经济和生态系统锁定

超大规模企业正在捆绑计算,数据分析和人工智能模型市场进入集成平台堆栈。这种垂直整合反映了移动操作系统市场的动态——一旦嵌入工作负载,转换成本就会结构性上升。公共云市场将越来越多地奖励拥有完整的推理到应用程序管道的提供商。

将可持续性作为采购标准

IEA预测到2030年数据中心电力需求将达到945太瓦时[10]。做出净零排放承诺的企业(目前占财富 500 强企业的 65% 以上)将优先从签署可再生能源采购协议的地区供电供应商处采购。碳优化调度,即工作负载实时迁移到最环保的可用区域,将成为公共云市场的标准功能。

量子安全云迁移

NIST 于 2024 年 8 月最终确定了三项后量子密码标准[11]。提供托管量子安全密钥管理服务的云提供商将捕获受监管行业的工作负载,特别是在银行业、防御和医疗保健——其中加密敏捷性是合规性先决条件。到 2035 年,这一转变将为整个公共云市场带来有意义的升级收入。


区域市场份额分析

地区 关键指标 主要投资主题
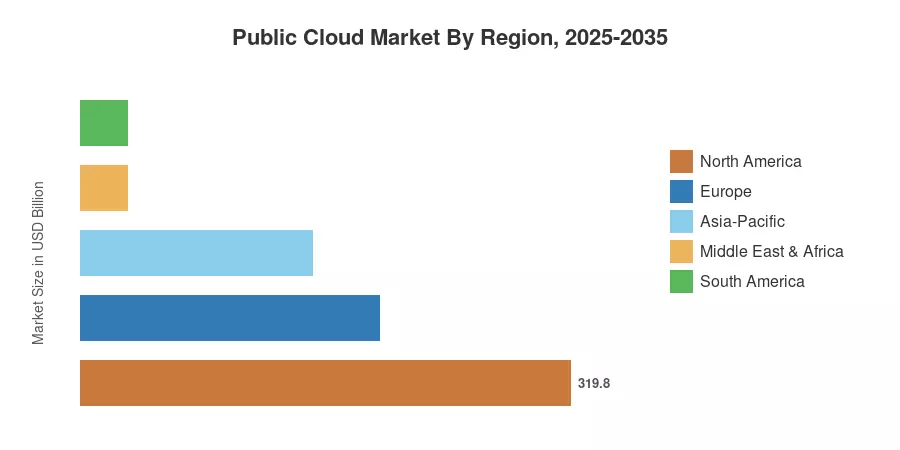
北美 约 41% 份额(2025 年) AI 基础设施、FedRAMP 现代化
欧洲 约 25% 份额(2025 年) 主权云、GDPR 合规性
亚太 复合年增长率 19.4%(2026-2035) 中小企业迁移、5G边缘部署
南美洲 USD 31 B (2025) 政府数字化、金融科技
中东和非洲 USD 31 B (2025) 智慧城市计划、石油到数字化转型
全部的 USD 780 B (2025)

公共云市场呈现出清晰的地理层次结构,以北美的超大规模企业总部为基础,随着监管框架和数字基础设施的成熟,​​迅速扩展到亚太地区。


北美

国家 关键指标 关键驱动程序
美国 约 78% 的区域份额 超大规模总部;联邦云授权
加拿大 14.8% CAGR 安大略省和魁北克省的人工智能走廊投资
墨西哥 USD 8.2 B (2025) 近岸外包驱动的 IT 支出


美国仍然是公共云市场的中心,FedRAMP 授权的供应商每年处理超过 100 亿美元的联邦合同[2]。加拿大的人工智能走廊战略和墨西哥的近岸外包热潮正在产生增量需求。

欧洲

国家 关键指标 关键驱动程序
德国 约 22% 的区域份额 工业 4.0 云采用
英国 15.6% CAGR 金融服务云迁移
法国 USD 22 B (2025) 主权云国家战略
意大利 16.1% CAGR 中小企业数字化激励措施
西班牙 约 6% 的地区份额 旅游科技和电子政务
北欧国家 15.9% CAGR 绿色数据中心优势
俄罗斯 USD 7 B (2025) 国内云替代
欧洲其他地区 约 12% 的区域份额 欧盟凝聚力基金 IT 投资


德国的工业 4.0 计划将制造工作负载引导到公共云市场,而英国的金融行为监管局沙盒则加速了银行和保险业的云采用。法国的“Cloud de Confiance”战略根据 SecNumCloud 标准对主权提供商进行认证[3].

亚太

国家 关键指标 关键驱动程序
中国 约 38% 的地区份额 工业云要求
印度 21.2% CAGR 数字印度; UPI生态系统
日本 USD 34 B (2025) 企业遗产现代化
韩国 18.5% CAGR K-Cloud 政府倡议
东盟 约 9% 的地区份额 5G推出;数字银行
亚太其他地区 17.2% CAGR 新兴数字经济


中国的“东数据,西计算”项目将超大规模工作负载引导至西部省份,而印度的 MeghRaj 和 UPI 生态系统在公共云轨道上产生大量交易量[4]。随着大型机时代的合同到期,日本保守的企业文化终于发生了转变。

南美洲

国家 关键指标 关键驱动程序
巴西 约 58% 的地区份额 Pix支付系统;开放银行
阿根廷 17.8% CAGR 金融科技创业生态系统
南美洲其他地区 USD 6 B (2025) 政府电子服务


巴西的开放银行授权和 Pix 实时支付基础设施推动金融机构转向可扩展的公共云平台,使该国成为南美公共云市场的支柱。

中东和非洲

国家 关键指标 关键驱动程序
沙特阿拉伯 约 30% 的区域份额 2030 年愿景智慧城市项目
阿联酋 19.3% CAGR 金融中心云需求
南非 USD 4.5 B (2025) 电信主导的云扩展
埃及 18.7% CAGR 数字埃及转型
MEA 的其余部分 约 18% 的地区份额 石油到数字多元化


沙特阿拉伯的 NEOM 和其他 2030 年愿景大型项目正在创造对公共云基础设施的锚定需求,AWS 和 Oracle 在利雅得和吉达开设了专门区域[19].


Public Cloud Market By Region, 2025-2035

公有云市场细分

按部署模型

部分 关键指标 主要需求驱动因素
软件即服务 (SaaS) 约 52% 份额(2025 年) 企业应用订阅
平台即服务 (PaaS) 20.4% CAGR AI/ML 工具链和低代码平台
基础设施即服务 (IaaS) USD 198 B (2025) 用于训练工作负载的 GPU 计算


SaaS 继续以收入份额主导公共云市场,其中 CRM、ERP 以及来自 Salesforce、SAP 和 Microsoft 365 等供应商的协作套件为主导。与永久软件相比,企业更喜欢订阅许可,这确保了经常性收入的稳定性。随着组织投资抽象基础设施复杂性的开发人员平台,PaaS 的加速速度比任何其他部署模型都快——托管 Kubernetes 服务、无服务器功能运行时和集成 CI/CD 管道是主要催化剂。

按组织规模

部分 关键指标 主要需求驱动因素
大型企业 约 62% 份额(2025 年) 综合企业协议
中小企业 (SME) 19.4% CAGR 即用即付成本可及性


大型企业占据了公共云市场的大部分,因为它们运行复杂的多区域工作负载,需要专门的支持级别和协商定价。中小企业代表着增长前沿——在公共云基础设施上诞生的云原生初创公司很少在本地构建,30 多个国家的政府补贴计划积极资助中小企业迁移[9].

按最终用户行业

部分 关键指标 主要需求驱动因素
信息技术和电信 约 32% 份额(2025 年) 核心基础设施现代化
BFSI 18.2% CAGR 开放银行和实时支付
医疗保健和生命科学 USD 72 B (2025) EHR 迁移和临床 AI
政府和公共部门 17.5% CAGR 电子政务和公民服务
制造业 19.5% CAGR 工业物联网和数字孪生平台
其他最终用户 ~8% 份额 (2025) 零售、教育、媒体


IT 和电信公司都是公共云市场的最大消费者和主要推动者——超大规模提供商、SaaS 供应商和电信运营商共同锚定了这一细分市场。制造业是增长最快的终端用户垂直行业,因为工厂部署了需要大规模弹性计算的互联设备平台和数字孪生模拟。


竞争标杆管理

公共云市场呈现中等集中度,排名前三的提供商——AWS、微软Azure和谷歌云——合计占据全球收入的60-68%。赫芬达尔-赫希曼指数位于 1,800-2,200 范围内,表明寡头垄断适度集中,利基市场和区域参与者在主权、垂直和中小企业领域维持可行的地位。

公司 预计。收益分成范围 主要产品 战略定位
亚马逊网络服务 (AWS) 〜28–33% EC2、Lambda、SageMaker、基岩 最广泛的服务目录;先发规模
微软Azure 〜20–25% Azure 人工智能、Microsoft 365、动态 通过 Office 生态系统进行企业集成
谷歌云 〜9–12% BigQuery、Vertex AI、GKE 数据分析和人工智能优先定位
阿里云 〜4–6% 弹性计算、PAI、达摩院 亚太及电商云主播
销售人员 〜3–5% 销售云、服务云、MuleSoft CRM 原生 SaaS 领导者
IBM 云 〜2–4% Watson、红帽 OpenShift、混合云 混合和受监管的行业焦点
甲骨文云 〜2–4% OCI、自治数据库、融合应用程序 以数据库为中心的迁移路径
树液 〜2–3% S/4HANA 云、BTP ERP 到云迁移的主导地位
腾讯云 〜1–3% CVM、TDSQL、微信生态 中国社交电商整合
华为云 〜1–2% FusionCloud、ModelArts 新兴市场电信合作伙伴关系

最近的新闻和动态

  • 微软Azure(2025 年 1 月):宣布 2025 财年数据中心资本支出为 800 亿美元,优先投资于美国、日本和瑞典的人工智能优化地区[14].
  • 2025 年 2 月:国际商业机器公司以每股 35 美元的价格收购 HashiCorp,将自动化工具与 IBM Cloud 产品捆绑在一起。
  • 2025 年 2 月:NetApp 和 AWS 签署了战略合作协议,以加速 Amazon FSx 上 NetApp ONTAP 的生成型 AI 数据服务。
  • 2025 年 1 月:松下采用西门子 Teamcenter X 来简化基于云的产品生命周期管理。
  • 2024 年 12 月:红帽和 AWS 扩大了混合云协作,以简化虚拟机迁移和 AI 工作负载部署。


公共云市场报告范围

范围 细节
市场范围 全球公共云市场——跨所有最终用户垂直领域的 SaaS、PaaS、IaaS
学习期限 2021–2035
CAGR 16.2%(2026-2035)
市场规模(2025 年) 0.78万亿美元
市场规模(2035) 3.51 万亿美元
增长最快的细分市场 PaaS(通过部署);制造(按最终用户);亚太地区(按地区)
公司简介 AWS、微软Azure、谷歌云等10大主要参与者
计价货币 USD


FAQs

How should enterprises evaluate total cost of ownership when comparing public cloud providers?
Procurement teams should model three-year blended costs including compute, egress fees, support tiers, and committed-use discounts rather than list-price comparisons. Third-party FinOps platforms can benchmark actual spend against peer cohorts [18].
What role does confidential computing play in regulated-industry cloud adoption?
Confidential computing encrypts data during processing inside hardware-based trusted execution environments, satisfying regulators who previously blocked cloud migration for sensitive workloads. Adoption is growing fastest in banking and defense [16].
How are hyperscalers differentiating their AI model marketplaces?
AWS Bedrock, Azure AI Studio, and Google Vertex AI each offer curated foundation-model catalogs with provider-specific fine-tuning pipelines. Selection depends on existing ecosystem lock-in and preferred model vendors [20].
What contractual safeguards mitigate cloud vendor lock-in risk?
Enterprises should negotiate data-portability clauses, multi-format export APIs, and capped egress fees at contract signing. The EU Data Act now requires providers to support standardized switching within 30 days [3].
How does carbon-aware workload scheduling work in practice?
Cloud platforms route non-time-sensitive jobs to regions with the lowest real-time carbon intensity, using grid-emission feeds. Microsoft and Google offer native carbon-optimization dashboards [10].
What compliance certifications should buyers verify before procurement?
Minimum baselines include SOC 2 Type II, ISO 27001, ISO 27017, and region-specific certifications such as FedRAMP (U.S.), C5 (Germany), or IRAP (Australia). Verify certification scope covers the specific services, not just the provider [2].
How will post-quantum cryptography standards affect cloud migration timelines?
NIST's 2024 PQC standards require organizations to inventory crypto-dependencies and migrate certificates before quantum-capable systems emerge. Cloud providers offering managed PQC key services will shorten transition timelines [11].    
作者
Author
Author Profile
Aarti Dhapte LinkedIn
AVP - Research
A consulting professional focused on helping businesses navigate complex markets through structured research and strategic insights. I partner with clients to solve high-impact business problems across market entry strategy, competitive intelligence, and opportunity assessment. Over the course of my experience, I have led and contributed to 100+ market research and consulting engagements, delivering insights across multiple industries and geographies, and supporting strategic decisions linked to $500M+ market opportunities. My core expertise lies in building robust market sizing, forecasting, and commercial models (top-down and bottom-up), alongside deep-dive competitive and industry analysis. I have played a key role in shaping go-to-market strategies, investment cases, and growth roadmaps, enabling clients to make confident, data-backed decisions in dynamic markets.
Co-Author
Co-Author Profile
Shubham Munde LinkedIn
Team Lead - Research
Shubham brings over 7 years of expertise in Market Intelligence and Strategic Consulting, with a strong focus on the Automotive, Aerospace, and Defense sectors. Backed by a solid foundation in semiconductors, electronics, and software, he has successfully delivered high-impact syndicated and custom research on a global scale. His core strengths include market sizing, forecasting, competitive intelligence, consumer insights, and supply chain mapping. Widely recognized for developing scalable growth strategies, Shubham empowers clients to navigate complex markets and achieve a lasting competitive edge. Trusted by start-ups and Fortune 500 companies alike, he consistently converts challenges into strategic opportunities that drive sustainable growth.

Research Approach


Secondary Research

The secondary research process involved comprehensive analysis of technology standards databases, government cloud initiatives, peer-reviewed IT journals, industry publications, and authoritative technology organizations. Key sources included the National Institute of Standards and Technology (NIST) Special Publications on cloud computing and cybersecurity frameworks, the General Services Administration (GSA) FedRAMP Marketplace and Cloud Information Center, the Department of Homeland Security (DHS) cybersecurity guidelines, the Department of Defense (DoD) Cloud Computing Security Requirements Guide (CC SRG), the European Union Agency for Cybersecurity (ENISA) cloud security reports, Eurostat Digital Economy and Society statistics, the International Organization for Standardization/International Electrotechnical Commission (ISO/IEC) JTC 1/SC 38 cloud computing standards, the Uptime Institute Tier Certification database for data center infrastructure, the ITU-T (International Telecommunication Union) cloud computing focus group, the Cloud Security Alliance (CSA) STAR Registry and research publications, the Cloud Native Computing Foundation (CNCF) annual surveys, Gartner cloud infrastructure and platform services reports, IDC worldwide semiannual public cloud services trackers, Forrester cloud surveys, Flexera State of the Cloud reports, McKinsey Global Institute cloud adoption studies, and OECD digital economy outlooks. These sources were used to collect cloud adoption statistics, security compliance data, infrastructure capacity metrics, service model deployment trends, and competitive landscape analysis for Infrastructure as a Service (IaaS), Platform as a Service (PaaS), Software as a Service (SaaS), and Function as a Service (FaaS) across enterprise segments.


Primary Research

To gather both qualitative and quantitative insights, supply-side and demand-side stakeholders were interviewed during the primary research phase. CEOs, CTOs, VPs of cloud infrastructure, cloud architects, and heads of cloud strategy from hyperscalers, cloud infrastructure suppliers, and public cloud service providers were examples of supply-side sources. CIOs, IT directors, cloud procurement managers, and infrastructure leads from IT and telecommunications firms, banks and financial services organizations, manufacturing firms, healthcare organizations, government agencies, and retail corporations were among the demand-side sources. In addition to verifying multi-cloud and hybrid cloud adoption timelines and validating service model segmentation, primary research also collected information on pricing model preferences, workload migration trends, security compliance needs, and vendor lock-in issues.

Primary Respondent Breakdown:

By Designation: C-level Primaries (31%), Director Level (34%), Others (35%)

By Region: North America (32%), Europe (25%), Asia-Pacific (35%), Rest of World (8%)


Market Size Estimation

Global market valuation was derived through revenue mapping and cloud consumption analysis. The methodology included:

Identification of 60+ key cloud service providers across North America, Europe, Asia-Pacific, Latin America, and Middle East & Africa

Service mapping across Infrastructure as a Service (IaaS), Platform as a Service (PaaS), Software as a Service (SaaS), and Function as a Service (FaaS) segments

Analysis of reported and modeled annual revenues specific to public cloud service portfolios

Coverage of hyperscale providers, tier-2 regional cloud providers, and specialized cloud vendors representing 75-80% of global market share in 2024

Extrapolation using bottom-up (cloud consumption metrics × pricing by region and service model) and top-down (provider revenue validation and enterprise IT spend analysis) approaches to derive segment-specific valuations

Validation against third-party cloud spend monitoring data from enterprise IT budget surveys and cloud management platform analytics

FedRAMP (Federal Risk and Authorization Management Program) – GSA authorization database for federal cloud compliance

NIST SP 800-145 – The NIST Definition of Cloud Computing

DoD CC SRG – Department of Defense Cloud Computing Security Requirements Guide

Eurostat – Cloud computing statistics on enterprise usage by service model and industry

ENISA – European Union Agency for Cybersecurity cloud security certification frameworks

ISO/IEC JTC 1/SC 38 – International standards for cloud computing and distributed platforms

Uptime Institute – Data center Tier Certification and industry research reports

下载免费样本

请填写以下表格以获取本报告的免费样本

Download PDF ×

We do not share your information with anyone. However, we may send you emails based on your report interest from time to time. You may contact us at any time to opt-out.

















