 资料来源:二次研究、初步研究、MRFR 数据库和分析师评论
 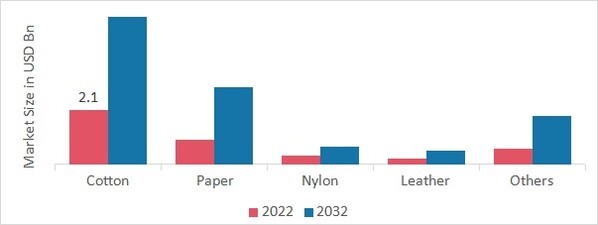 strong资料来源:二次研究、初步研究、MRFR 数据库和分析师评论
 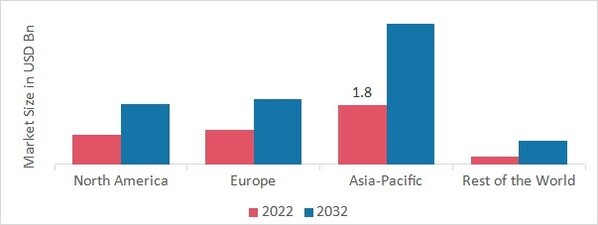 资料来源:二次研究、初步研究、MRFR 数据库和分析师评论
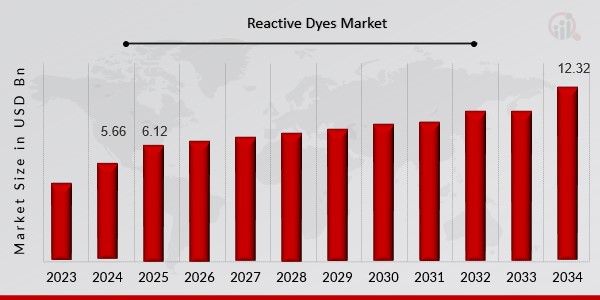
 What is the current valuation of the Reactive Dyes Market?
As of 2024, the Reactive Dyes Market was valued at 5.66 USD Billion.
What is the projected market size for the Reactive Dyes Market in 2035?
The market is projected to reach 13.32 USD Billion by 2035.
What is the expected CAGR for the Reactive Dyes Market during the forecast period?
The expected CAGR for the Reactive Dyes Market from 2025 to 2035 is 8.09%.
Which applications are driving growth in the Reactive Dyes Market?
Key applications include Textile, Paper, Leather, Plastic, and Cosmetics, with Textile projected to grow from 3.0 to 7.0 USD Billion.
What are the primary end-use segments in the Reactive Dyes Market?
The main end-use segments are Apparel, Home Textiles, Industrial Textiles, Automotive, and Medical, with Apparel expected to grow from 1.7 to 4.0 USD Billion.
How do the types of reactive dyes impact market performance?
Types such as Monoazo, Disazo, and Triazo are crucial, with Monoazo projected to increase from 1.7 to 3.9 USD Billion.
What chemical structures are prevalent in the Reactive Dyes Market?
Amino, Naphthol, and Azo structures dominate, with Amino expected to grow from 1.7 to 3.9 USD Billion.
What formulations are available in the Reactive Dyes Market?
Formulations include Liquid, Powder, Granular, and Paste, with Liquid projected to rise from 1.7 to 4.0 USD Billion.
Who are the key players in the Reactive Dyes Market?
Prominent players include Huntsman Corporation, Dystar Global, BASF SE, and Clariant AG.
What trends are influencing the Reactive Dyes Market in 2025?
Trends include increasing demand in textiles and sustainable practices, potentially driving market growth.


