Resumen del mercado de viajes compartidos
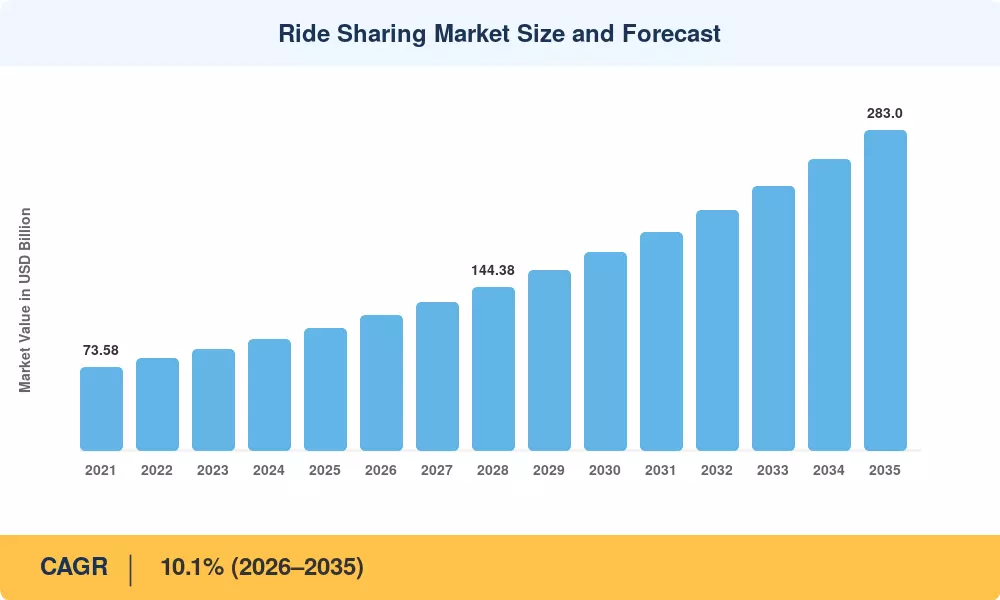
El mercado de viajes compartidos alcanzó un valor estimado de 108.200 millones de dólares en 2025 y se prevé que crezca de 119.100 millones de dólares en 2026 a 283.000 millones de dólares en 2035, registrando una tasa compuesta anual del 10,1% durante el período previsto (2026-2035). Dos catalizadores anclan esta trayectoria: mandatos agresivos de reducción de la congestión urbana en los países del G20 y una inversión acumulada de empresas y empresas que supera los 42 mil millones de dólares desde 2021 en tecnologías de plataformas de transporte privado.[2]. El mercado de viajes compartidos ya no es un juego de conveniencia: se está convirtiendo en una infraestructura municipal integrada.
Una transformación tecnológica está remodelando este sector en su esencia. El tradicional despacho de taxis callejeros y los modelos fragmentados de alquiler privado están dando paso a viajes compartidos optimizados algorítmicamente, emparejamiento de viajes compartidos, motores de fijación de precios dinámicos en tiempo real y pilotos de viajes compartidos de robotaxi cada vez más autónomos. Solo Waymo comprometió más de 5.500 millones de dólares en expansión de flotas autónomas entre 2023 y 2025, mientras que Uber y Lyft han invertido recursos en conversiones de flotas de viajes compartidos en vehículos eléctricos vinculadas a compromisos netos cero.[3][4]. Los programas corporativos de viajes compartidos para empleados representan ahora una adyacencia en rápida expansión, con plataformas como Zeelo y Via asegurando contratos empresariales por valor de cientos de millones al año.[5].
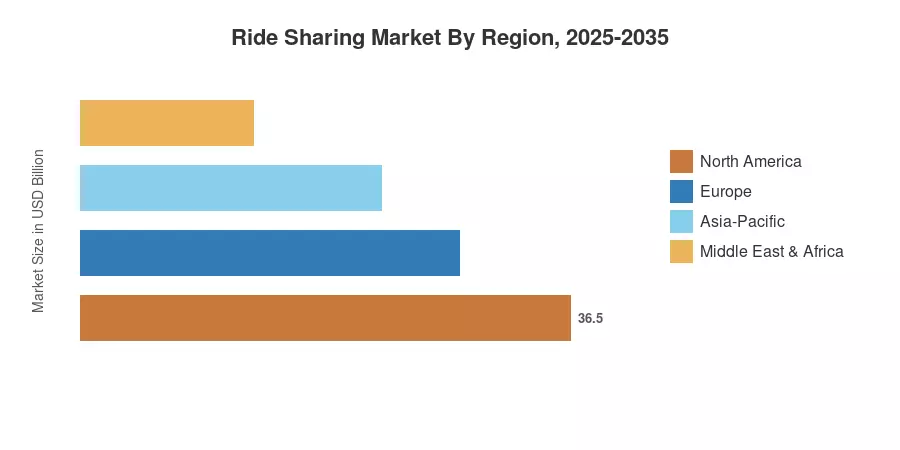
América del Norte domina aproximadamente el 38% del mercado mundial de viajes compartidos, impulsado por una profunda penetración de los teléfonos inteligentes y ecosistemas maduros de plataformas de viajes compartidos en los Estados Unidos. Asia-Pacífico es la región de más rápido crecimiento con una CAGR proyectada del 12,6%, impulsada por aumentos repentinos de la urbanización en India, Indonesia y Vietnam. Europa tiene aproximadamente el 25% de participación, respaldada por estrictos estándares de emisiones que aceleran la adopción de flotas de vehículos eléctricos para compartir viajes. A medida que los viajes compartidos en robotaxi autónomos escalan desde el despliegue piloto hasta el comercial, el mercado de viajes compartidos se encuentra en un punto de inflexión que redefinirá la movilidad urbana hasta 2035.
Conclusiones clave del informe
• Por tipo de servicio
- Los servicios de transporte compartido tienen la mayor participación en los ingresos, aproximadamente el 62 % del mercado de viajes compartidos, sostenido por los operadores dominantes de plataformas de transporte Uber y Lyft en los mercados occidentales y Grab y DiDi en Asia.
- La combinación de viajes compartidos con viajes compartidos es el segmento de más rápido crecimiento con una CAGR proyectada del 13,4%, impulsada por los viajeros urbanos preocupados por los costos y los incentivos municipales para los carriles HOV.
- Los segmentos de alquiler de automóviles y microtransporte representan en conjunto 18.700 millones de dólares en ingresos en 2025.
• Por tipo de membresía
- La movilidad personal domina con aproximadamente el 74% del mercado de viajes compartidos, lo que refleja la dependencia de los consumidores del transporte bajo demanda.
- Los programas corporativos de viajes compartidos para empleados se están expandiendo a una tasa compuesta anual del 14,1% a medida que los empleadores subsidian la conectividad de última milla
• Por región
- América del Norte generó aproximadamente 41.100 millones de dólares en ingresos en 2025 gracias al mercado de viajes compartidos.
- La CAGR de Asia-Pacífico del 12,6% supera a todas las demás regiones hasta 2035
- La participación de Europa está respaldada por marcos de responsabilidad de seguros de regulación de viajes compartidos que formalizan las relaciones plataforma-conductor.
Tamaño y pronóstico del mercado de viajes compartidos (2021-2035)
El dimensionamiento del mercado se basa en un enfoque ascendente que agrega reservas brutas informadas por la plataforma, presentaciones regulatorias, datos telemáticos de flotas y entrevistas primarias de MRFR con más de 120 ejecutivos de la industria en 18 países. Las cifras históricas se triangulan con las divulgaciones públicas de ganancias de Uber, Lyft, Grab y DiDi.[6].
Análisis de impacto del conductor
| Conductor |
~% Impacto en CAGR |
Relevancia geográfica |
Cronología del impacto |
Árbitro |
| Tarifas de urbanización y congestión |
~2,1% |
Global |
Largo plazo (≥4 años) |
[2] |
| Implementación de viajes autónomos de robotaxi compartidos |
~1,8% |
América del Norte, China |
Mediano plazo (2 a 4 años) |
[9] |
| Mandatos de flotas de viajes compartidos en vehículos eléctricos |
~1,5% |
Europa, California |
Corto plazo (≤2 años) |
[4] |
| Algoritmos de coincidencia de viajes compartidos de viajes compartidos |
~1,3% |
Global |
Corto plazo (≤2 años) |
[8] |
| Subsidios para los desplazamientos de los empleados en viajes compartidos corporativos |
~1,1% |
América del Norte, Europa |
Mediano plazo (2 a 4 años) |
[5] |
| Integración de superaplicaciones (pagos, entrega, tránsito) |
~0,9% |
Asia-Pacífico |
Mediano plazo (2 a 4 años) |
[10] |
| Regulación de viajes compartidos, seguros y estandarización de responsabilidad |
~0,7% |
UE, Australia |
Largo plazo (≥4 años) |
[11] |
Mandatos de tarificación de urbanización y congestión
Según estimaciones de la ONU, 2.500 millones más de personas vivirán en ciudades en 2050, lo que representará el 68% de la población mundial.[2]. Se han establecido o aumentado zonas de precios de congestión en ciudades como Londres, Estocolmo, Singapur y Nueva York, lo que fomenta directamente el uso compartido de viajes y la comparación de viajes en lugar de viajes en automóviles de uso individual. Para 2024, la zona de emisiones ultrabajas de Londres había reducido los volúmenes de tráfico central en un 17 % y había generado más de 220 millones de libras esterlinas al año, lo que alentó a los viajeros a utilizar el mercado de viajes compartidos.[12].
Despliegue de flota de robotaxi autónomos
Waymo superó los 150.000 viajes autónomos pagados por semana en San Francisco, Phoenix y Los Ángeles a finales de 2024, lo que representa la prueba más tangible de los viajes autónomos.robotaxisviajes compartidos a escala comercial[9]. Cruise, a pesar de una pausa operativa en 2023, reanudó las pruebas limitadas en 2025 bajo la división de autonomía reestructurada de GM. Baidu Apollo Go de China completó más de 7 millones de viajes acumulados en robotaxi a mediados de 2024[13]. Estas implementaciones eliminan el costo del conductor (normalmente entre el 60% y el 65% de la economía por viaje) y podrían comprimir las tarifas de las plataformas de viajes compartidos en un 40% una vez ampliadas.
Transiciones de flotas de vehículos eléctricos
Básicamente, Uber y Lyft deben convertir su flota a vehículos eléctricos para cumplir con el Estándar de Millas Limpias de California, que exige que el 90% de las millas de los vehículos de la plataforma de transporte sean libres de emisiones para 2030.[4]. Calendarios de electrificación similares para flotas empresariales se impulsan en el marco del plan equivalente de la UE "Fit for 55". La electrificación temprana reduce los gastos operativos por milla (USD 0,04–0,06/milla versus USD 0,12–0,15/milla para ICE) y brinda a los operadores del mercado de viajes compartidos acceso preferencial a aeropuertos y aceras en áreas reguladas.
Expansión del programa de viajes corporativos
Un estudio de Global Workplace Analytics de 2024 encontró que el 62% de las empresas de Fortune 500 ahora subsidian los programas de desplazamiento de los empleados a través de plataformas de viajes compartidos.[5]. El gasto de los empleados en viajes compartidos corporativos alcanzó aproximadamente 8.300 millones de dólares a nivel mundial en 2025, y Via, Zeelo y Uber for Business capturaron la mayoría de los contratos empresariales. Los incentivos fiscales, incluido el beneficio complementario de transporte calificado en EE. UU. de hasta 315 dólares al mes por empleado, aceleran la adopción.
Análisis de impacto de restricciones
Los impactos que se detallan a continuación son vientos en contra direccionales que moderan el crecimiento. No se restan linealmente de la CAGR indicada.
| Restricción |
~% Impacto en CAGR |
Relevancia geográfica |
Cronología del impacto |
Árbitro |
| Clasificación de conductores y conflictos laborales |
–1,2% |
UE, California, Reino Unido |
Corto plazo (≤2 años) |
[11] |
| Regulación de viajes compartidos, seguros y fragmentación de responsabilidad |
–0,9% |
Global |
Largo plazo (≥4 años) |
[14] |
| Preocupaciones sobre la privacidad y la vigilancia de los datos |
–0,5% |
UE, India |
Mediano plazo (2 a 4 años) |
[15] |
| Brechas de infraestructura en los mercados emergentes |
–0,7% |
África, sur de Asia |
Largo plazo (≥4 años) |
[16] |
| Ambigüedad de la responsabilidad del vehículo autónomo |
–0,4% |
América del Norte, UE |
Mediano plazo (2 a 4 años) |
[9] |
Clasificación de conductores y regulación laboral
La Directiva sobre el trabajo en plataformas de la UE, adoptada en 2024, establece una presunción legal de empleo para los trabajadores autónomos que cumplen criterios específicos, lo que obliga a los operadores de plataformas de transporte a reclasificar a los conductores o reestructurar los modelos de participación.[11]. El precedente AB5 de California y el fallo de la Corte Suprema del Reino Unido sobre Uber de 2021 crearon cargas de cumplimiento superpuestas, y a veces contradictorias. La reclasificación aumenta los costos por viaje en aproximadamente un 15% a un 25%, comprimiendo los márgenes en todo el mercado de viajes compartidos y desacelerando la expansión en jurisdicciones con mucha regulación.
Fragmentación regulatoria entre jurisdicciones
No hay dos países que tengan las mismas leyes que rigen los viajes compartidos. Los requisitos de responsabilidad de seguros para las regulaciones de viajes compartidos varían desde pólizas obligatorias para automóviles comerciales en los Estados Unidos hasta esquemas cuasi públicos en Japón y prohibiciones absolutas de plataformas (hasta reversiones recientes) en secciones de Alemania y España.[14]. Los operadores deben conservar equipos de cumplimiento específicos de cada jurisdicción como resultado de este mosaico, que retrasa la entrada al mercado y aumenta los gastos generales. Las empresas emergentes en el espacio de viajes compartidos y viajes compartidos enfrentan obstáculos desproporcionados.
Restricciones de privacidad de datos
El conflicto entre la optimización del servicio y la privacidad del consumidor se pone de relieve en los procedimientos de aplicación del RGPD contra los métodos de seguimiento de ubicación de las plataformas de transporte compartido, como la multa de 290 millones de euros a Uber en 2024 en los Países Bajos.[15]. Las reglas de consentimiento y localización de datos impuestas por la Ley de Protección de Datos Personales Digitales de la India (2023) aumentan los gastos de infraestructura para las plataformas del mercado de viajes compartidos.
.
Oportunidades de mercado de viajes compartidos
Comercialización de robotaxi autónomo a escala
A medida que los costos de los viajes compartidos en taxis robóticos autónomos caigan por debajo de los viajes impulsados por humanos para 2029-2031, se abre una oportunidad abordable de entre 45 y 60 mil millones de dólares dentro del mercado de viajes compartidos.[9]. Los pioneros con aprobaciones regulatorias y software de gestión de flotas captarán una parte desproporcionada
Expansión de viajes compartidos en ciudades de nivel 2 y 3
La combinación de viajes compartidos con viajes compartidos sigue concentrada en las 25 principales áreas metropolitanas del mundo. La expansión de la comparación algorítmica a las ciudades medianas (donde el transporte público está subdesarrollado, pero la penetración de los teléfonos inteligentes supera el 70%) representa una oportunidad totalmente nueva con un valor estimado de 12 mil millones de dólares anuales para 2030.
Paquete de movilidad corporativa como servicio
Las empresas combinan cada vez más los programas de viajes corporativos compartidos para los empleados con la gestión del estacionamiento,micromovilidadabonos y pases de transporte en presupuestos de movilidad unificados. Las plataformas que integran estas ofertas pueden aumentar los ingresos por cuenta entre 3 y 4 veces en comparación con el transporte independiente
Asociaciones de monetización de datos y planificación urbana
Las plataformas de Ride Sharing Market generan miles de millones de puntos de datos GPS diariamente. La monetización de análisis anónimos del flujo de viajes para las autoridades de transporte municipales, desarrolladores inmobiliarios y estrategas de ubicaciones minoristas crea flujos de ingresos recurrentes de SaaS independientes de los volúmenes de viajes.
Los mercados emergentes avanzan en África y el Sudeste Asiático
Mercados como Nigeria, Kenia, Vietnam y Filipinas están pasando de la infraestructura tradicional de taxis directamente a modelos de plataformas de transporte compartido basadas en aplicaciones. La penetración de viajes compartidos en África se mantiene por debajo del 3%, lo que representa un enorme margen de maniobra[16]
Perspectivas futuras del mercado de viajes compartidos
Operaciones autónomas y gestión de flotas impulsada por IA
Se prevé que para 2032, los viajes compartidos en robotaxi autónomos representen entre el 8 % y el 12 % del volumen total de viajes del mercado de viajes compartidos en EE. UU. y China.[9]. Flota basada en IAEl reequilibrio, el modelado predictivo de la demanda y el monitoreo del estado de los vehículos reducirán los costos operativos de la plataforma entre un 20% y un 30%, lo que permitirá tarifas más bajas y ampliará el grupo de usuarios direccionables.
Economía y consolidación de plataformas
El panorama de las plataformas de transporte compartido probablemente se consolidará aún más a medida que aumenten las presiones sobre la rentabilidad. Uber, Lyft, Grab y DiDi controlan colectivamente más del 75% de los mercados direccionables, una concentración que puede desencadenar un escrutinio antimonopolio pero que también permite la economía de escala necesaria para financiar transiciones autónomas y eléctricas en el mercado de viajes compartidos.[6][18].
Electrificación e Integración a la Red
Se espera que la penetración de la flota de vehículos eléctricos compartidos en las principales plataformas alcance entre el 40% y el 50% para 2030 y supere el 75% para 2035, según las proyecciones de Global EV Outlook de la AIE.[19]. Vehículo a red(V2G) podría transformar los vehículos de viajes compartidos inactivos en activos de energía distribuida, creando flujos de ingresos secundarios para los operadores de flotas.
Mandatos de sostenibilidad y presentación de informes ESG
Los inversores institucionales condicionan cada vez más la asignación de capital a un desempeño ESG mensurable. Las plataformas de Ride Sharing Market que publican métricas auditadas de emisiones por viaje, índices de bienestar del conductor y tasas de utilización equivalentes de viajes compartidos atraerán términos de financiamiento preferenciales. El marco del Grupo de Trabajo sobre Divulgación Financiera Relacionada con el Clima (TCFD) se está convirtiendo en un estándar de facto para la presentación de informes del sector de la movilidad.[20].
Análisis de participación de mercado regional
| Región |
Métrica clave |
Temas primarios de inversión |
| América del norte |
38% de participación (USD 41,1 mil millones) |
Pilotos autónomos de viajes en robotaxi, mandatos para flotas de vehículos eléctricos |
| Europa |
25% de participación (USD 27,1 mil millones) |
Regulación de viajes compartidos, reforma de responsabilidad de seguros y electrificación |
| Asia-Pacífico |
CAGR 12.6% |
Ecosistemas de superaplicaciones, viajes compartidos, coincidencia de viajes compartidos y densidad |
| Sudamerica |
USD 5.4 B |
Digitalización de moto-taxi, integración de viajes fintech |
| Medio Oriente y África |
CAGR 11.3% |
Programas de ciudades inteligentes respaldados por el gobierno |
| Total |
USD 108.2 B |
— |
El mercado de viajes compartidos muestra una dinámica regional distinta determinada por la madurez regulatoria, la densidad de urbanización y la economía de la propiedad de vehículos.
América del norte
| País |
Métrica clave |
Controlador clave |
| Estados Unidos |
82% de la participación regional |
Duopolio Uber/Lyft y expansión del viaje compartido en robotaxi autónomo |
| Canadá |
CAGR 9.8% |
Densificación urbana en Toronto, Vancouver |
| México |
USD 2.1 B |
DiDi y Uber compiten por el dominio de la plataforma de transporte compartido |
Estados Unidos sigue siendo el epicentro mundial de la innovación en viajes compartidos. Las reservas brutas de Uber en Estados Unidos superaron los 40.000 millones de dólares en 2024, mientras que la flota autónoma de Waymo realizó más de 150.000 viajes semanales.[3][9]. El mercado de viajes compartidos de Canadá se beneficia de las regulaciones federales sobre combustibles limpios que incentivanvehículo eléctricoDespliegue de flotas de viajes compartidos en las principales áreas metropolitanas.
Europa
| País |
Métrica clave |
Controlador clave |
| Reino Unido |
31% de la participación regional |
Marcos de licencias TfL, expansión de Bolt |
| Alemania |
CAGR 10.9% |
Crecimiento de las plataformas de transporte compartido tras la desregulación |
| Francia |
USD 4.2 B |
BlaBlaCar pooling interurbano, regulación de viajes compartidos, seguros, alineación de responsabilidades |
La Directiva europea sobre trabajo en plataformas está remodelando el panorama competitivo del mercado de viajes compartidos, aumentando los costos de cumplimiento pero también formalizando protecciones para los conductores que mejoran la confiabilidad del servicio.[11]. El paquete climático "Fit for 55" de la UE exige transiciones aceleradas de flotas de vehículos eléctricos compartidos en todos los estados miembros.
Asia-Pacífico
| País |
Métrica clave |
Controlador clave |
| Porcelana |
42% de la participación regional |
Dominio de DiDi, viaje compartido en robotaxi autónomo Baidu Apollo |
| India |
CAGR 14.2% |
Guerra de precios Ola/Uber, crecimiento de plataformas de transporte de vehículos de dos ruedas |
| Sudeste Asiático |
USD 7.8 B |
Ecosistemas de superaplicaciones Grab/Gojek |
El crecimiento del mercado de viajes compartidos en Asia y el Pacífico está impulsado por la densidad de población, las bajas tasas de propiedad de vehículos y las plataformas de súper aplicaciones que integran viajes compartidos, viajes compartidos que coinciden con pagos, entrega de alimentos y servicios financieros.[10]. Se espera que solo India agregue 180 millones de nuevos usuarios de viajes compartidos entre 2025 y 2035.
Sudamerica
| País |
Métrica clave |
Controlador clave |
| Brasil |
68% de la participación regional |
99 (filial de DiDi) y competencia de Uber |
| Argentina |
CAGR 10.4% |
La devaluación del peso aumenta la demanda de viajes compartidos |
El mercado de viajes compartidos de Brasil se beneficia de altas tasas de urbanización (87%) y de una subinversión crónica en transporte público. Las plataformas de moto-taxi como 99Motos son un vector de crecimiento regional distintivo[16].
Medio Oriente y África
| País |
Métrica clave |
Controlador clave |
| Emiratos Árabes Unidos |
38% de la participación regional |
Careem (filial de Uber), iniciativas de ciudades inteligentes |
| Arabia Saudita |
CAGR 13.1% |
Inversiones en movilidad urbana Visión 2030 |
| Nigeria |
USD 0.6 B |
La rápida expansión de Bolt, la población no bancarizada y la integración fintech |
El Fondo de Inversión Pública de Arabia Saudita ha canalizado más de 3.500 millones de dólares hacia la movilidad urbana en el marco de Visión 2030, apoyando directamente la infraestructura de plataformas de transporte compartido yvehículo autónomocorredores de prueba[17].
Segmentación del mercado de viajes compartidos
Por tipo de servicio
| Segmento |
Métrica clave |
Impulsor de la demanda primaria |
| Viaje compartido |
62% de participación |
Plataforma de transporte compartido Uber Lyft dominio y conveniencia |
| Viaje compartido/viajes compartidos |
CAGR 13.4% |
Ahorro de costos, viajes compartidos, algoritmos de coincidencia de viajes compartidos |
| Alquiler de coches / Suscripción |
USD 11.2 B |
Alternativas de propiedad flexibles |
| Microtránsito / Shuttle |
CAGR 11.8% |
Programas de viajes corporativos compartidos para empleados |
Los viajes compartidos siguen siendo la columna vertebral del mercado de viajes compartidos, generando la mayoría de los ingresos de la plataforma a través de viajes bajo demanda de un solo pasajero. Uber y Lyft juntos representan más del 70% del volumen de viajes compartidos en EE. UU., mientras que DiDi y Grab ocupan posiciones comparables en China y el Sudeste Asiático, respectivamente.[6]. La coincidencia de viajes compartidos con viajes compartidos es el tipo de servicio de más rápido crecimiento, ya que los algoritmos ahora alcanzan tasas de coincidencia de más del 85% en corredores urbanos densos, lo que reduce los costos por pasajero entre un 30% y un 40% en comparación con los viajes en solitario.[8].
Por aplicación
| Segmento |
Métrica clave |
Impulsor de la demanda primaria |
| Movilidad personal |
74% de participación |
Viaje diario, ocio, traslados al aeropuerto. |
| Corporativo / Empresa |
CAGR 14.1% |
Presupuestos de viajes de los empleados para viajes compartidos corporativos |
| Integración del gobierno y el transporte público |
USD 4.6 B |
Soluciones para la brecha de tránsito de primera y última milla |
El mercado de viajes compartidos para aplicaciones corporativas está aumentando a medida que los empleadores adoptan programas de movilidad gestionada. Las asociaciones gubernamentales, como el servicio de microtransporte impulsado por Via de Dallas Area Rapid Transit, ilustran cómo las plataformas de viajes compartidos complementan, en lugar de reemplazar, el transporte público.[21].
Por propulsión del vehículo
| Segmento |
Métrica clave |
Impulsor de la demanda primaria |
| Vehículos ICE |
61% de participación (en disminución) |
Inercia de la flota heredada |
| Vehículos eléctricos a batería |
CAGR 18.2% |
Mandatos de flotas de viajes compartidos en vehículos eléctricos, menor TCO |
| Vehículos híbridos |
USD 14.8 B |
Puente de transición en mercados que carecen de infraestructura de carga |
Los segmentos de flotas de viajes compartidos de vehículos eléctricos representan la transformación más dinámica dentro del mercado de viajes compartidos. Las plataformas que operan flotas de BEV en ciudades como Shenzhen y Oslo reportan costos de combustible y mantenimiento por milla entre un 35% y un 45% más bajos en comparación con los equivalentes de ICE.[4][19].
Evaluación comparativa competitiva
El mercado de viajes compartidos muestra una concentración de moderada a alta, con un HHI estimado de aproximadamente 1.800 a 2.200 en los 15 principales mercados mundiales. Se estima que las cinco principales plataformas capturan colectivamente entre el 65% y el 70% de las reservas brutas globales, aunque la composición regional varía significativamente.
| Compañía |
Est. Rango de participación en los ingresos |
Ofertas clave para el mercado de viajes compartidos |
Posicionamiento Estratégico |
| Tecnologías Uber |
~28–32% |
Transporte compartido, UberPool, Uber for Business y asociaciones autónomas |
Líder a escala global con dominio de plataforma de transporte privado |
| Didi Global |
~18–22% |
Viajes compartidos, viajes compartidos y pilotos autónomos |
China + bastión latinoamericano |
| Lyft |
~6–9% |
Transporte compartido, viajes compartidos, alquiler de bicicletas/scooters |
Centrado en EE. UU. y Canadá, viajes compartidos y coincidencia de viajes compartidos |
| Agarrar participaciones |
~5–7% |
Superaplicación: viajes, entregas, pagos |
Bloqueo del ecosistema del sudeste asiático |
| Perno (Taxificar) |
~3–5% |
Transporte compartido, micromovilidad, entrega de comida |
Expansión en Europa y África |
| Taxis Ola |
~3–5% |
Transporte compartido, flota de Ola Electric |
El pionero de la flota de viajes compartidos en vehículos eléctricos dominante de la India |
| BlaBlaCar |
~2-3% |
Agrupación de viajes de larga distancia, mercado de autobuses |
Viaje compartido entre ciudades europeas |
| A través del transporte |
~1-2% |
Tránsito B2B como servicio, microtránsito |
Tecnología de viaje compartido para empleados en viajes corporativos |
| Waymo (alfabeto) |
~1-2% |
Servicio autónomo de viajes en robotaxi |
Modelo tecnológico sin conductor |
|
careem(Uber) |
~1-2% |
Superaplicación de pagos y viajes compartidos |
Medio Oriente y África del Norte |
Noticias y desarrollos recientes
- Waymo (octubre de 2024): servicio de viajes compartidos de robotaxi autónomo ampliado a Los Ángeles, alcanzando más de 100 000 viajes semanales pagos en tres ciudades de EE. UU.[9].
- Uber Technologies (agosto de 2024): se anunció una asociación con BYD para implementar 100.000 vehículos eléctricos en la plataforma de viajes compartidos a nivel mundial para 2027, acelerando los objetivos de la flota de viajes compartidos de vehículos eléctricos.[4].
- Unión Europea (abril de 2024): adoptó la Directiva sobre trabajo en plataformas, que establece criterios de presunción de empleo que afectan los marcos de responsabilidad de seguros de regulación de viajes compartidos en 27 estados miembros.[11].
- Grab Holdings (enero de 2024): lanzó GrabPool AI optimizado para compartir viajes compartidos en Yakarta y Bangkok, reportando tasas de coincidencia un 22% más altas en comparación con el algoritmo anterior.[10].
- Lyft (marzo de 2025): presentó la marca "Lyft Autónoma" para su servicio de robotaxi impulsado por Motional en Las Vegas, la primera plataforma de transporte privado de EE. UU. que ofrece viajes programados sin conductor.[22].
- Ola Electric (junio de 2024): comprometió 500 millones de dólares para ampliar la flota de vehículos eléctricos de dos ruedas para programas corporativos de viajes compartidos para empleados en 50 ciudades de la India.[23].
- PIF de Arabia Saudita (noviembre de 2023): invirtió 1.300 millones de dólares en infraestructura de viajes compartidos nacionales en el marco de Visión 2030, incluidas zonas de prueba de vehículos autónomos en NEOM[17].
- Baidu Apollo Go (septiembre de 2024): superó los 8 millones de viajes autónomos acumulados en China y obtuvo la aprobación regulatoria para operaciones totalmente sin conductor en Wuhan[13].
- Lyft (julio de 2025): Lyft amplió su presencia a 11 países y casi 1.000 ciudades al completar la adquisición de FREENOW por 175 millones de euros (191 millones de dólares).
- Waymo (junio de 2025): Waymo y Uber lanzaron un servicio comercial de robotaxi en Atlanta que utilizaba vehículos Jaguar I-PACE sin conductor para abarcar 65 millas cuadradas.
Preguntas frecuentes
P1. ¿Cómo monetizan las plataformas de viajes compartidos datos más allá de las tarifas de viaje?
Las plataformas otorgan licencias de datos de flujo de origen-destino anónimos a planificadores urbanos, desarrolladores inmobiliarios y anunciantes. Este flujo de ingresos de datos como servicio está creciendo aproximadamente un 20 % anual entre los principales operadores de plataformas de transporte compartido.[18].
P2. ¿Qué estructura de seguro se aplica cuando un robotaxi autónomo se ve involucrado en un accidente?
La mayoría de las jurisdicciones asignan la responsabilidad principal al operador del vehículo autónomo o al proveedor de tecnología, no al pasajero. Los marcos de responsabilidad de seguros de regulación de viajes compartidos están evolucionando, con California y el Reino Unido liderando el desarrollo de políticas.[14].
P3. ¿Cómo afecta el viaje compartido a los ingresos de los conductores en comparación con el viaje compartido en solitario?
Los conductores que utilizan viajes compartidos en rutas coincidentes generalmente ganan entre un 10% y un 15% menos por viaje, pero completan entre un 25% y un 30% más de viajes por hora debido a la reducción de las millas muertas.[8]. Los ingresos netos por hora siguen siendo comparables.
P4. ¿Qué segmento del mercado de viajes compartidos ofrece el mejor punto de entrada para los inversores institucionales?
Los operadores de flotas de vehículos eléctricos compartidos y los proveedores de tecnología autónoma ofrecen los múltiplos de mayor crecimiento. Los SPAC centrados en flotas y la salida a bolsa anticipada de Waymo son oportunidades seguidas de cerca[9][19].
P5. ¿Pueden los programas corporativos de viajes compartidos integrarse con los sistemas de planificación de recursos empresariales existentes?
Sí, plataformas como Via y Uber for Business ofrecen integraciones API con SAP, Oracle y Workday para la conciliación automatizada de gastos. La adopción de viajes corporativos compartidos por parte de los empleados se acelera cuando se minimiza la fricción de TI[5].
P6. ¿En qué se diferencian las regulaciones del mercado emergente de viajes compartidos en la India de los marcos occidentales?
Las Directrices para agregadores de vehículos motorizados de la India limitan las comisiones de las plataformas al 20% y exigen fondos de bienestar para los conductores, más estrictos que la mayoría de los modelos occidentales de regulación de responsabilidad y seguros de viajes compartidos.[14][16].
P7. ¿Qué papel juega el Ride Sharing Market en los objetivos municipales de descarbonización?
Ciudades como Ámsterdam y Shenzhen exigen flotas de plataformas de transporte 100% con cero emisiones para 2030. Los viajes compartidos reducen las emisiones per cápita entre un 45% y un 55% en comparación con el uso de automóviles privados, lo que convierte al mercado de viajes compartidos en una herramienta climática municipal clave.[12][19].
Alcance del informe de mercado de viajes compartidos
| Parámetro |
Detalle |
| Alcance del mercado |
Mercado global de viajes compartidos, que incluye servicios de viajes compartidos, viajes compartidos, microtransporte y viajes autónomos |
| Período de estudio |
2021-2035 |
| CAGR |
10,1% (2026-2035) |
| Tamaño del mercado del año base |
USD 108.2 Billion (2025) |
| Punto final de pronóstico |
USD 283.0 Billion (2035) |
| Segmento de más rápido crecimiento |
Coincidencia de viajes compartidos con viajes compartidos (CAGR 13,4%) |
| Empresas perfiladas |
Uber, DiDi, Lyft, Grab, Bolt, Ola, BlaBlaCar, Via, Waymo, Careem |
| Moneda de valoración |
USD (dólares constantes de 2025) |