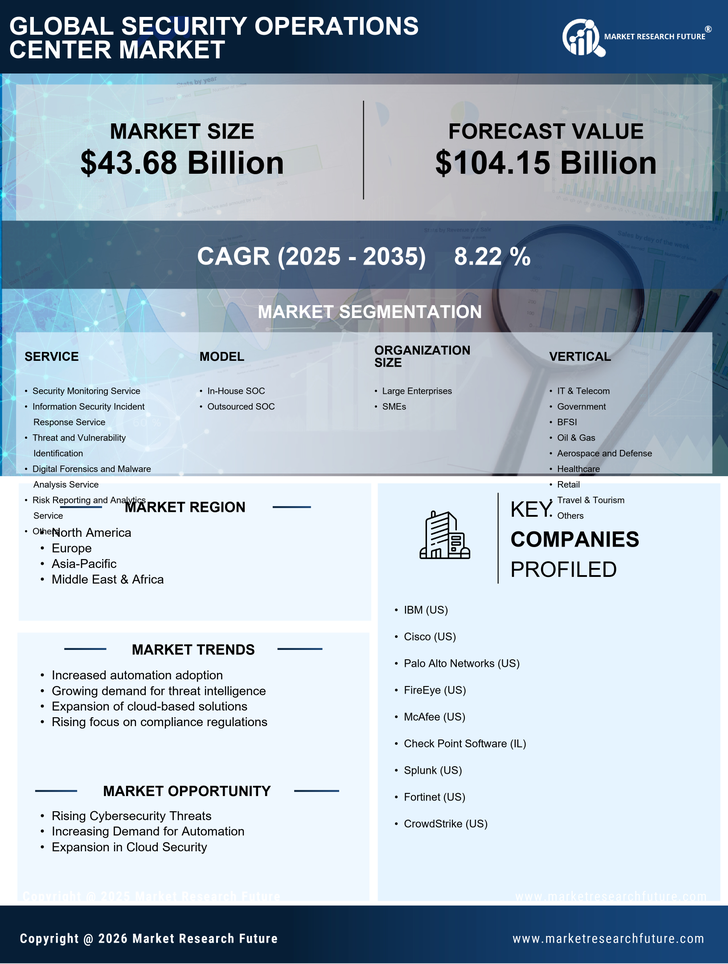
Marché du Centre d'Opérations de Sécurité
- Integration of Advanced Technologies
- Shift Towards Managed Security Services
- Emphasis on Compliance and Regulatory Requirements
- Rising Cybersecurity Threats
- Regulatory Compliance Pressures
- Adoption of Cloud-Based Solutions
-
1 RÉSUMÉ EXÉCUTIF 14
- 1.1 MARCHÉ DES CENTRES D'OPÉRATION DE SÉCURITÉ MONDIAUX, PAR SERVICES 15
- 1.2 MARCHÉ DES CENTRES D'OPÉRATION DE SÉCURITÉ MONDIAUX, PAR MODÈLE 16
- 1.3 MARCHÉ DES CENTRES D'OPÉRATION DE SÉCURITÉ MONDIAUX, PAR TAILLE D'ORGANISATION 17
- 1.4 MARCHÉ DES CENTRES D'OPÉRATION DE SÉCURITÉ MONDIAUX, PAR SECTEUR 18
- 1.5 MARCHÉ DES CENTRES D'OPÉRATION DE SÉCURITÉ MONDIAUX, PAR RÉGION 19
-
2 INTRODUCTION AU MARCHÉ 20
- 2.1 DÉFINITION 20
- 2.2 PORTÉE DE L'ÉTUDE 20
- 2.3 OBJECTIF DE LA RECHERCHE 20
- 2.4 STRUCTURE DU MARCHÉ 20
-
3 MÉTHODOLOGIE DE RECHERCHE 21
- 3.1 PROCESSUS DE RECHERCHE 21
- 3.2 RECHERCHE PRIMAIRE 22
- 3.3 RECHERCHE SECONDAIRE 23
- 3.4 ESTIMATION DE LA TAILLE DU MARCHÉ 23
- 3.5 MODÈLE DE PRÉVISION 25
- 3.6 LISTE DES HYPOTHÈSES 26
-
4 DYNAMIQUE DU MARCHÉ 27
- 4.1 INTRODUCTION 27
-
4.2 FACTEURS D'INFLUENCE 28
- 4.2.1 Croissance de la tendance BYOD parmi les organisations 28
-
4.2.2 Augmentation du nombre de cyberattaques 28
- 4.2.2.1 Augmentation de la sophistication des cyberattaques 29
-
4.3 RESTRICTIONS 29
- 4.3.1 Manque de confiance envers les fournisseurs tiers 29
-
4.4 OPPORTUNITÉS 29
- 4.4.1 Demande croissante pour la protection des données critiques 29
-
5 ANALYSE DES FACTEURS DU MARCHÉ 30
-
5.1 Analyse de la chaîne de valeur 30
- 5.1.1 FOURNISSEURS DE TECHNOLOGIE 30
- 5.1.2 FOURNISSEURS DE SERVICES ET REVENDEURS 31
- 5.1.3 UTILISATEURS FINAUX 31
-
5.2 Analyse des cinq forces de Porter 32
- 5.2.1 Menace des nouveaux entrants 33
- 5.2.2 Pouvoir de négociation des fournisseurs 33
- 5.2.3 Pouvoir de négociation des acheteurs 33
- 5.2.4 Menace des substituts 33
- 5.2.5 Intensité de la rivalité 33
-
5.1 Analyse de la chaîne de valeur 30
-
6 MARCHÉ DES CENTRES D'OPÉRATION DE SÉCURITÉ MONDIAUX, PAR SERVICES 34
-
6.1 Aperçu 34
- 6.1.1 Service de surveillance de la sécurité 35
- 6.1.2 Service de réponse aux incidents de sécurité de l'information 35
- 6.1.3 Identification des menaces et des vulnérabilités 35
- 6.1.4 Service d'analyse numérique et d'analyse de logiciels malveillants 35
- 6.1.5 Service de reporting et d'analytique des risques 36
- 6.1.6 Autres 36
-
6.1 Aperçu 34
-
7 MARCHÉ DES CENTRES D'OPÉRATION DE SÉCURITÉ MONDIAUX PAR MODÈLE 37
-
7.1 Aperçu 37
- 7.1.1 SOC interne 37
- 7.1.2 SOC externalisé 38
-
7.1 Aperçu 37
-
8 MARCHÉ DES CENTRES D'OPÉRATION DE SÉCURITÉ MONDIAUX, PAR TAILLE D'ORGANISATION 39
-
8.1 Aperçu 39
- 8.1.1 Grandes entreprises 40
- 8.1.2 PME 40
-
8.1 Aperçu 39
-
9 MARCHÉ DES CENTRES D'OPÉRATION DE SÉCURITÉ MONDIAUX, PAR SECTEUR 41
-
9.1 Aperçu 41
- 9.1.1 TI & Télécommunications 42
- 9.1.2 Gouvernement 42
- 9.1.3 BFSI 43
- 9.1.4 Pétrole & Gaz 43
- 9.1.5 Aérospatiale et défense 43
- 9.1.6 Santé 43
- 9.1.7 Vente au détail 43
- 9.1.8 Voyage & Tourisme 44
- 9.1.9 Autres (fabrication, énergie et services publics) 44
-
9.1 Aperçu 41
-
10 MARCHÉ DES CENTRES D'OPÉRATION DE SÉCURITÉ MONDIAUX, PAR RÉGION 45
- 10.1 APERÇU 45
-
10.2 AMÉRIQUE DU NORD 46
- 10.2.1 É.-U. 52
- 10.2.2 Canada 54
- 10.2.3 Mexique 56
-
10.3 EUROPE 58
- 10.3.1 Royaume-Uni 64
- 10.3.2 Allemagne 66
- 10.3.3 France 68
- 10.3.4 RESTE DE L'EUROPE 70
-
10.4 ASIE-PACIFIQUE 72
- 10.4.1 Chine 78
- 10.4.2 Japon 80
- 10.4.3 Inde 82
- 10.4.4 reste de l'Asie-Pacifique 84
-
10.5 Reste du monde 86
- 10.5.1 Moyen-Orient & Afrique 92
- 10.5.2 Amérique du Sud 94
-
11 PAYSAGE CONCURRENTIEL 96
-
11.1 Introduction 96
- 11.1.1 Analyse de la part de marché 96
-
11.1 Introduction 96
-
12 PROFILS D'ENTREPRISES 98
-
12.1 Capgemini SE 98
- 12.1.1 APERÇU DE L'ENTREPRISE 98
- 12.1.2 APERÇU FINANCIER 99
- 12.1.3 Produits/Services/Solutions Offerts 99
- 12.1.4 DÉVELOPPEMENTS CLÉS 100
- 12.1.5 ANALYSE SWOT 101
- 12.1.6 Stratégies clés 101
-
12.2 SYMANTEC CORPORATION 102
- 12.2.1 APERÇU DE L'ENTREPRISE 102
- 12.2.2 APERÇU FINANCIER 102
- 12.2.3 PRODUITS/Services/Solutions OFFERTS 103
- 12.2.4 DÉVELOPPEMENTS CLÉS 103
- 12.2.5 ANALYSE SWOT 104
- 12.2.6 STRATÉGIES CLÉS 104
-
12.3 AT&T Inc. 105
- 12.3.1 APERÇU DE L'ENTREPRISE 105
- 12.3.2 APERÇU FINANCIER 106
- 12.3.3 PRODUITS/SOLUTIONS/SERVICES OFFERTS 106
- 12.3.4 DÉVELOPPEMENTS CLÉS 107
- 12.3.5 ANALYSE SWOT 107
- 12.3.6 STRATÉGIES CLÉS 107
-
12.4 Cisco Systems, Inc. 108
- 12.4.1 APERÇU DE L'ENTREPRISE 108
- 12.4.2 APERÇU FINANCIER 109
- 12.4.3 PRODUITS/Services/Solutions OFFERTS 109
- 12.4.4 ANALYSE SWOT 110
- 12.4.5 Stratégies clés 110
-
12.5 Fortinet 111
- 12.5.1 APERÇU DE L'ENTREPRISE 111
- 12.5.2 APERÇU FINANCIER 112
- 12.5.3 Produits/Services/Solutions Offerts 112
- 12.5.4 DÉVELOPPEMENTS CLÉS 113
- 12.5.5 ANALYSE SWOT 113
- 12.5.6 Stratégies clés 113
-
12.6 F5 Networks, Inc. 114
- 12.6.1 APERÇU DE L'ENTREPRISE 114
- 12.6.2 APERÇU FINANCIER 114
- 12.6.3 Produits/Services/Solutions Offerts 115
- 12.6.4 ANALYSE SWOT 116
- 12.6.5 Stratégies clés 116
-
12.7 SecureWorks Corp. 117
- 12.7.1 APERÇU DE L'ENTREPRISE 117
- 12.7.2 APERÇU FINANCIER 117
- 12.7.3 Produits/Services/Solutions Offerts 118
- 12.7.4 DÉVELOPPEMENTS CLÉS 118
- 12.7.5 ANALYSE SWOT 119
- 12.7.6 Stratégies clés 119
-
12.8 Raytheon Company 120
- 12.8.1 APERÇU DE L'ENTREPRISE 120
- 12.8.2 APERÇU FINANCIER 120
- 12.8.3 Produits/Services/Solutions Offerts 121
- 12.8.4 DÉVELOPPEMENTS CLÉS 121
- 12.8.5 ANALYSE SWOT 122
- 12.8.6 Stratégies clés 122
-
12.9 Dark Matters, Inc. 123
- 12.9.1 APERÇU DE L'ENTREPRISE 123
- 12.9.2 PRODUITS/Services/Solutions OFFERTS 123
-
12.10 Rapid7, Inc. 124
- 12.10.1 APERÇU DE L'ENTREPRISE 124
- 12.10.2 APERÇU FINANCIER 125
- 12.10.3 Stratégies clés 126
-
12.11 Alert Logic, Inc. 127
- 12.11.1 APERÇU DE L'ENTREPRISE 127
- 12.11.2 Produits/Services/Solutions Offerts 127
-
12.12 Netdatavault 128
- 12.12.1 APERÇU DE L'ENTREPRISE 128
- 12.12.2 Produits/Services/Solutions Offerts 128
-
12.13 Digital Guardian, Inc. 129
- 12.13.1 APERÇU DE L'ENTREPRISE 129
- 12.13.2 PRODUITS/Services/Solutions OFFERTS 129
- LISTE DES TABLEAUX
- TABLEAU 1 Interviews principales 22
- TABLEAU 2 Liste des hypothèses 26
- TABLEAU 3 MARCHÉ DES CENTRES D'OPÉRATION DE SÉCURITÉ MONDIAUX, par SERVICES, 2017–2025 (MILLIARDS USD) 34
- TABLEAU 4 MARCHÉ DES CENTRES D'OPÉRATION DE SÉCURITÉ MONDIAUX, par Modèle, 2017–2025 (MILLIARDS USD) 37
- TABLEAU 5 MARCHÉ DES CENTRES D'OPÉRATION DE SÉCURITÉ MONDIAUX, par Taille d'Organisation, 2017–2025 (MILLIARDS USD) 39
- TABLEAU 6 MARCHÉ DES CENTRES D'OPÉRATION DE SÉCURITÉ MONDIAUX, par Secteur, 2017–2025 (MILLIARDS USD) 42
- TABLEAU 7 MARCHÉ DES CENTRES D'OPÉRATION DE SÉCURITÉ MONDIAUX, par région, 2017–2025 (MILLIARDS USD) 45
- TABLEAU 8 AMÉRIQUE DU NORD : MARCHÉ DES CENTRES D'OPÉRATION DE SÉCURITÉ, par PAYS, 2017–2025 (MILLIARDS USD) 47
- TABLEAU 9 AMÉRIQUE DU NORD : MARCHÉ DES CENTRES D'OPÉRATION DE SÉCURITÉ, par SERVICES, 2017–2025 (MILLIARDS USD) 48
- TABLEAU 10 AMÉRIQUE DU NORD : MARCHÉ DES CENTRES D'OPÉRATION DE SÉCURITÉ, par MODÈLE, 2017–2025 (MILLIARDS USD) 49
- TABLEAU 11 AMÉRIQUE DU NORD : MARCHÉ DES CENTRES D'OPÉRATION DE SÉCURITÉ, par Taille d'Organisation, 2017–2025 (MILLIARDS USD) 50
- TABLEAU 12 AMÉRIQUE DU NORD : MARCHÉ DES CENTRES D'OPÉRATION DE SÉCURITÉ, par Secteur, 2017–2025 (MILLIARDS USD) 51
- TABLEAU 13 É.-U. : MARCHÉ DES CENTRES D'OPÉRATION DE SÉCURITÉ, par SERVICES, 2017–2025 (MILLIARDS USD) 52
- TABLEAU 14 É.-U. : MARCHÉ DES CENTRES D'OPÉRATION DE SÉCURITÉ, par MODÈLE, 2017–2025 (MILLIARDS USD) 52
- TABLEAU 15 É.-U. : MARCHÉ DES CENTRES D'OPÉRATION DE SÉCURITÉ, par Taille d'Organisation, 2017–2025 (MILLIARDS USD) 53
- TABLEAU 16 É.-U. : MARCHÉ DES CENTRES D'OPÉRATION DE SÉCURITÉ, par Secteur, 2017–2025 (MILLIARDS USD) 53
- TABLEAU 17 Canada : MARCHÉ DES CENTRES D'OPÉRATION DE SÉCURITÉ, par SERVICES, 2017–2025 (MILLIARDS USD) 54
- TABLEAU 18 Canada : MARCHÉ DES CENTRES D'OPÉRATION DE SÉCURITÉ, par MODÈLE, 2017–2025 (MILLIARDS USD) 54
- TABLEAU 19 CANADA : MARCHÉ DES CENTRES D'OPÉRATION DE SÉCURITÉ, PAR TAILLE D'ORGANISATION, 2017–2025 (MILLIARDS USD) 55
- TABLEAU 20 CANADA : MARCHÉ DES CENTRES D'OPÉRATION DE SÉCURITÉ, par Secteur, 2017–2025 (MILLIARDS USD) 55
- TABLEAU 21 Mexique : MARCHÉ DES CENTRES D'OPÉRATION DE SÉCURITÉ, par SERVICES, 2017–2025 (MILLIARDS USD) 56
- TABLEAU 22 Mexique : MARCHÉ DES CENTRES D'OPÉRATION DE SÉCURITÉ, par MODÈLE, 2017–2025 (MILLIARDS USD) 56
- TABLEAU 23 MEXIQUE : MARCHÉ DES CENTRES D'OPÉRATION DE SÉCURITÉ, PAR TAILLE D'ORGANISATION, 2017–2025 (MILLIARDS USD) 57
- TABLEAU 24 MEXIQUE : MARCHÉ DES CENTRES D'OPÉRATION DE SÉCURITÉ, par Secteur, 2017–2025 (MILLIARDS USD) 57
- TABLEAU 25 EUROPE : MARCHÉ DES CENTRES D'OPÉRATION DE SÉCURITÉ, par PAYS, 2017–2025 (MILLIARDS USD) 59
- TABLEAU 26 EUROPE : MARCHÉ DES CENTRES D'OPÉRATION DE SÉCURITÉ, par SERVICES, 2017–2025 (MILLIARDS USD) 60
- TABLEAU 27 EUROPE : MARCHÉ DES CENTRES D'OPÉRATION DE SÉCURITÉ, par MODÈLE, 2017–2025 (MILLIARDS USD) 61
- TABLEAU 28 EUROPE : MARCHÉ DES CENTRES D'OPÉRATION DE SÉCURITÉ, par Taille d'Organisation, 2017–2025 (MILLIARDS USD) 62
- TABLEAU 29 EUROPE : MARCHÉ DES CENTRES D'OPÉRATION DE SÉCURITÉ, par Secteur, 2017–2025 (MILLIARDS USD) 63
- TABLEAU 30 Royaume-Uni : MARCHÉ DES CENTRES D'OPÉRATION DE SÉCURITÉ, par SERVICES, 2017–2025 (MILLIARDS USD) 64
- TABLEAU 31 Royaume-Uni : MARCHÉ DES CENTRES D'OPÉRATION DE SÉCURITÉ, par MODÈLE, 2017–2025 (MILLIARDS USD) 64
- TABLEAU 32 Royaume-Uni : MARCHÉ DES CENTRES D'OPÉRATION DE SÉCURITÉ, PAR TAILLE D'ORGANISATION, 2017–2025 (MILLIARDS USD) 65
- TABLEAU 33 Royaume-Uni : MARCHÉ DES CENTRES D'OPÉRATION DE SÉCURITÉ, par Secteur, 2017–2025 (MILLIARDS USD) 65
- TABLEAU 34 Allemagne : MARCHÉ DES CENTRES D'OPÉRATION DE SÉCURITÉ, par SERVICES, 2017–2025 (MILLIARDS USD) 66
- TABLEAU 35 Allemagne : MARCHÉ DES CENTRES D'OPÉRATION DE SÉCURITÉ, par MODÈLE, 2017–2025 (MILLIARDS USD) 66
- TABLEAU 36 ALLEMAGNE : MARCHÉ DES CENTRES D'OPÉRATION DE SÉCURITÉ, PAR TAILLE D'ORGANISATION, 2017–2025 (MILLIARDS USD) 67
- TABLEAU 37 ALLEMAGNE : MARCHÉ DES CENTRES D'OPÉRATION DE SÉCURITÉ, par Secteur, 2017–2025 (MILLIARDS USD) 67
- TABLEAU 38 France : MARCHÉ DES CENTRES D'OPÉRATION DE SÉCURITÉ, par SERVICES, 2017–2025 (MILLIARDS USD) 68
- TABLEAU 39 France : MARCHÉ DES CENTRES D'OPÉRATION DE SÉCURITÉ, par MODÈLE, 2017–2025 (MILLIARDS USD) 68
- TABLEAU 40 FRANCE : MARCHÉ DES CENTRES D'OPÉRATION DE SÉCURITÉ, PAR TAILLE D'ORGANISATION, 2017–2025 (MILLIARDS USD) 69
- TABLEAU 41 FRANCE : MARCHÉ DES CENTRES D'OPÉRATION DE SÉCURITÉ, par Secteur, 2017–2025 (MILLIARDS USD) 69
- TABLEAU 42 Reste de l'Europe : MARCHÉ DES CENTRES D'OPÉRATION DE SÉCURITÉ, par SERVICES, 2017–2025 (MILLIARDS USD) 70
- TABLEAU 43 Reste de l'Europe : MARCHÉ DES CENTRES D'OPÉRATION DE SÉCURITÉ, par MODÈLE, 2017–2025 (MILLIARDS USD) 70
- TABLEAU 44 RESTE DE L'EUROPE : MARCHÉ DES CENTRES D'OPÉRATION DE SÉCURITÉ, PAR TAILLE D'ORGANISATION, 2017–2025 (MILLIARDS USD) 71
- TABLEAU 45 RESTE DE L'EUROPE : MARCHÉ DES CENTRES D'OPÉRATION DE SÉCURITÉ, par Secteur, 2017–2025 (MILLIARDS USD) 71
- TABLEAU 46 ASIE-PACIFIQUE : MARCHÉ DES CENTRES D'OPÉRATION DE SÉCURITÉ, par PAYS, 2017–2025 (MILLIARDS USD) 73
- TABLEAU 47 ASIE-PACIFIQUE : MARCHÉ DES CENTRES D'OPÉRATION DE SÉCURITÉ, par SERVICES, 2017–2025 (MILLIARDS USD) 74
- TABLEAU 48 ASIE-PACIFIQUE : MARCHÉ DES CENTRES D'OPÉRATION DE SÉCURITÉ, par MODÈLE, 2017–2025 (MILLIARDS USD) 75
- TABLEAU 49 ASIE-PACIFIQUE : MARCHÉ DES CENTRES D'OPÉRATION DE SÉCURITÉ, par Taille d'Organisation, 2017–2025 (MILLIARDS USD) 76
- TABLEAU 50 ASIE-PACIFIQUE : MARCHÉ DES CENTRES D'OPÉRATION DE SÉCURITÉ, par Secteur, 2017–2025 (MILLIARDS USD) 77
- TABLEAU 51 Chine : MARCHÉ DES CENTRES D'OPÉRATION DE SÉCURITÉ, par SERVICES, 2017–2025 (MILLIARDS USD) 78
- TABLEAU 52 CHINE : MARCHÉ DES CENTRES D'OPÉRATION DE SÉCURITÉ, par MODÈLE, 2017–2025 (MILLIARDS USD) 78
- TABLEAU 53 CHINE : MARCHÉ DES CENTRES D'OPÉRATION DE SÉCURITÉ, par Taille d'Organisation, 2017–2025 (MILLIARDS USD) 79
- TABLEAU 54 CHINE : MARCHÉ DES CENTRES D'OPÉRATION DE SÉCURITÉ, par Secteur, 2017–2025 (MILLIARDS USD) 79
- TABLEAU 55 JAPON : MARCHÉ DES CENTRES D'OPÉRATION DE SÉCURITÉ, par SERVICES, 2017–2025 (MILLIARDS USD) 80
- TABLEAU 56 JAPON : MARCHÉ DES CENTRES D'OPÉRATION DE SÉCURITÉ, par MODÈLE, 2017–2025 (MILLIARDS USD) 80
- TABLEAU 57 JAPON : MARCHÉ DES CENTRES D'OPÉRATION DE SÉCURITÉ, par Taille d'Organisation, 2017–2025 (MILLIARDS USD) 81
- TABLEAU 58 JAPON : MARCHÉ DES CENTRES D'OPÉRATION DE SÉCURITÉ, par Secteur, 2017–2025 (MILLIARDS USD) 81
- TABLEAU 59 INDE : MARCHÉ DES CENTRES D'OPÉRATION DE SÉCURITÉ, par SERVICES, 2017–2025 (MILLIARDS USD) 82
- TABLEAU 60 INDE : MARCHÉ DES CENTRES D'OPÉRATION DE SÉCURITÉ, par MODÈLE, 2017–2025 (MILLIARDS USD) 82
- TABLEAU 61 INDE : MARCHÉ DES CENTRES D'OPÉRATION DE SÉCURITÉ, par Taille d'Organisation, 2017–2025 (MILLIARDS USD) 83
- TABLEAU 62 INDE : MARCHÉ DES CENTRES D'OPÉRATION DE SÉCURITÉ, par Secteur, 2017–2025 (MILLIARDS USD) 83
- TABLEAU 63 reste de l'Asie-Pacifique : MARCHÉ DES CENTRES D'OPÉRATION DE SÉCURITÉ, par SERVICES, 2017–2025 (MILLIARDS USD) 84
- TABLEAU 64 reste de l'Asie-Pacifique : MARCHÉ DES CENTRES D'OPÉRATION DE SÉCURITÉ, par MODÈLE, 2017–2025 (MILLIARDS USD) 84
- TABLEAU 65 reste de l'Asie-Pacifique : MARCHÉ DES CENTRES D'OPÉRATION DE SÉCURITÉ, par Taille d'Organisation, 2017–2025 (MILLIARDS USD) 85
- TABLEAU 66 reste de l'Asie-Pacifique : MARCHÉ DES CENTRES D'OPÉRATION DE SÉCURITÉ, par Secteur, 2017–2025 (MILLIARDS USD) 85
- TABLEAU 67 reste du monde : MARCHÉ DES CENTRES D'OPÉRATION DE SÉCURITÉ, par Région, 2017–2025 (MILLIARDS USD) 87
- TABLEAU 68 reste du monde : MARCHÉ DES CENTRES D'OPÉRATION DE SÉCURITÉ, par SERVICES, 2017–2025 (MILLIARDS USD) 88
- TABLEAU 69 reste du monde : MARCHÉ DES CENTRES D'OPÉRATION DE SÉCURITÉ, par MODÈLE, 2017–2025 (MILLIARDS USD) 89
- TABLEAU 70 reste du monde : MARCHÉ DES CENTRES D'OPÉRATION DE SÉCURITÉ, par Taille d'Organisation, 2017–2025 (MILLIARDS USD) 90
- TABLEAU 71 reste du monde : MARCHÉ DES CENTRES D'OPÉRATION DE SÉCURITÉ, par Secteur, 2017–2025 (MILLIARDS USD) 91
- TABLEAU 72 Moyen-Orient & Afrique : MARCHÉ DES CENTRES D'OPÉRATION DE SÉCURITÉ, par SERVICES, 2017–2025 (MILLIARDS USD) 92
- '
-
12.1 Capgemini SE 98
Customer Stories

“This is really good guys. Excellent work on a tight deadline. I will continue to use you going forward and recommend you to others. Nice job”

“Thanks. It’s been a pleasure working with you, please use me as reference with any other Intel employees.”

“Thanks for sending the report it gives us a good global view of the Betaïne market.”

“Thank you, this will be very helpful for OQS.”

“We found the report very insightful! we found your research firm very helpful. I'm sending this email to secure our future business.”

“I am very pleased with how market segments have been defined in a relevant way for my purposes (such as "Portable Freezers & refrigerators" and "last-mile"). In general the report is well structured. Thanks very much for your efforts.”

“I have been reading the first document or the study, ,the Global HVAC and FP market report 2021 till 2026. Must say, good info! I have not gone in depth at all parts, but got a good indication of the data inside!”

“We got the report in time, we really thank you for your support in this process. I also thank to all of your team as they did a great job.”

“The Automotive 48V ECU Components Procurement Intelligence Study” was a complex project, but the Market Research Future (MRFR) team handled it with quality, agility, and customer-centricity. They delivered all requested data on time and within the agreed scope. The team, including Shubhendra Anand and Rahul Gotadki, was always readily available to clarify questions and swiftly implement necessary adjustments, driving the project to a successful conclusion within a very demanding timeframe.
I would also like to specifically commend Akshay Agarwal for his responsiveness and support at every stage—from our initial inquiry on May 6th through to final delivery on June 18th. His dedication made the entire process seamless.”