차량 공유 시장 요약
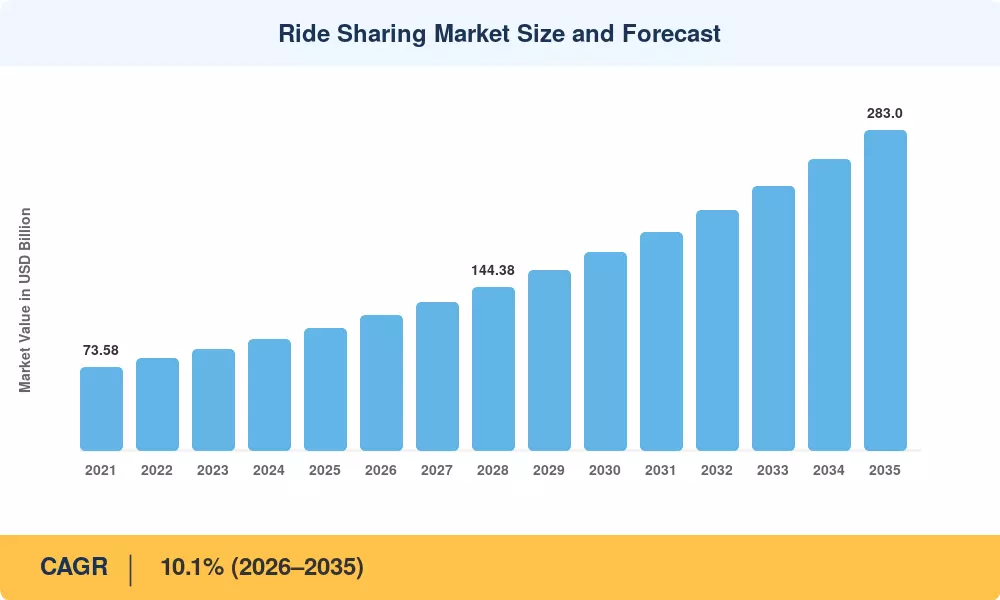
차량 공유 시장은 2025년에 약 1,082억 달러에 달했으며, 2026년 1,191억 달러에서 2035년까지 2,830억 달러로 성장하여 예측 기간(2026~2035) 동안 연평균 성장률(CAGR) 10.1%를 기록할 것으로 예상됩니다. 이러한 궤적을 뒷받침하는 두 가지 촉매제가 있습니다. G20 국가 전체의 공격적인 도시 정체 감소 의무와 2021년 이후 차량공유 플랫폼 기술에 대한 420억 달러를 초과하는 누적 벤처+기업 투자입니다.[2]. 차량 공유 시장은 더 이상 편리한 놀이가 아닙니다. 내장된 도시 인프라가 되고 있습니다.
기술 혁신은 이 부문의 핵심을 재편하고 있습니다. 기존의 거리 우박 택시 배차 및 단편화된 개인 고용 모델은 알고리즘적으로 최적화된 승차 풀링, 공유 여행 매칭, 실시간 동적 가격 책정 엔진 및 점점 더 자율적인 로봇 택시 승차 공유 조종사에게 자리를 내주고 있습니다. Waymo는 2023년부터 2025년까지 자율 차량 확장에 55억 달러 이상을 투자했으며, Uber와 Lyft는 순 제로 약속에 따른 전기 자동차 차량 공유 차량 전환에 자원을 쏟아부었습니다.[3][4]. 기업의 차량 공유 직원 통근 프로그램은 이제 Zeelo 및 Via와 같은 플랫폼이 연간 수억 달러 규모의 기업 계약을 확보하면서 빠르게 확장되는 인접성을 나타냅니다.[5].
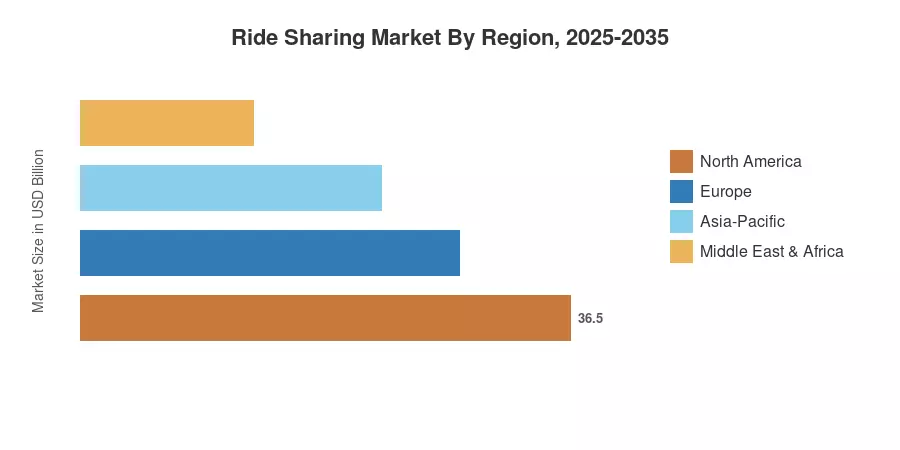
북미는 미국의 스마트폰 보급률과 성숙한 차량 공유 플랫폼 생태계에 힘입어 전 세계 차량 공유 시장의 약 38%를 점유하고 있습니다. 아시아 태평양 지역은 인도, 인도네시아, 베트남의 도시화 급증에 힘입어 CAGR 12.6%로 가장 빠르게 성장하는 지역입니다. 유럽은 약 25%의 점유율을 차지하고 있으며, 이는 전기 자동차 탑승 공유 차량 도입을 가속화하는 엄격한 배기가스 배출 표준의 지원을 받습니다. 자율 로보택시 승차 공유가 시험 단계에서 상업용 배치로 확장됨에 따라 승차 공유 시장은 2035년까지 도시 이동성을 재정의할 변곡점에 서 있습니다.
주요 보고서 시사점
• 서비스 유형별
- 차량 공유 서비스는 차량 공유 시장에서 약 62%로 가장 큰 수익 점유율을 차지하고 있으며, 이는 서구 시장의 지배적인 차량 공유 플랫폼 운영업체인 Uber 및 Lyft와 아시아의 Grab 및 DiDi가 유지하고 있습니다.
- 라이드 풀링 공유 여행 매칭은 비용에 민감한 도시 통근자와 도시 HOV 차선 인센티브에 힘입어 CAGR 13.4%로 가장 빠르게 성장하는 부문입니다.
- 자동차 렌탈 및 소액교통 부문은 2025년 매출에서 총 187억 달러를 차지합니다.
• 회원유형별
- 개인 이동성은 차량 공유 시장에서 약 74%의 점유율을 차지하며 이는 주문형 운송에 대한 소비자 의존도를 반영합니다.
- 고용주가 라스트 마일 연결에 보조금을 지급함에 따라 기업의 차량 공유 직원 통근 프로그램은 CAGR 14.1%로 확장되고 있습니다.
• 지역별
- 북미는 2025년 승차 공유 시장에서 약 411억 달러의 수익을 창출했습니다.
- 2035년까지 아시아 태평양 지역의 CAGR은 12.6%로 다른 모든 지역을 능가합니다.
- 유럽의 점유율은 플랫폼-운전자 관계를 공식화하는 차량 공유 규제 보험 책임 프레임워크에 의해 뒷받침됩니다.
승차 공유 시장 규모 및 예측(2021~2035년)
시장 규모 조정은 플랫폼 보고 총 예약, 규제 서류 제출, 차량 텔레매틱스 데이터 및 18개국 120명 이상의 업계 임원과의 MRFR 1차 인터뷰를 집계하는 상향식 접근 방식을 따릅니다. 과거 수치는 Uber, Lyft, Grab 및 DiDi의 공개 수익 공개를 기준으로 삼각측량됩니다.[6].
운전자 영향 분석
| 운전사 |
CAGR에 대한 ~% 영향 |
지리적 관련성 |
영향 타임라인 |
참조 |
| 도시화 및 혼잡 가격 |
~2.1% |
글로벌 |
장기(≥4년) |
[2] |
| 자율 로보택시 승차 공유 배치 |
~1.8% |
북미, 중국 |
중기(2~4년) |
[9] |
| 전기 자동차 승차 공유 차량 의무화 |
~1.5% |
유럽, 캘리포니아 |
단기(2년 이하) |
[4] |
| 라이드풀링 공유여행 매칭 알고리즘 |
~1.3% |
글로벌 |
단기(2년 이하) |
[8] |
| 기업 승차 공유 직원 출퇴근 보조금 |
~1.1% |
북미, 유럽 |
중기(2~4년) |
[5] |
| 슈퍼앱 통합(결제, 배송, 대중교통) |
~0.9% |
아시아 태평양 |
중기(2~4년) |
[10] |
| 승차 공유 규제, 보험 및 책임 표준화 |
~0.7% |
EU, 호주 |
장기(≥4년) |
[11] |
도시화 및 혼잡도에 따른 가격 의무화
UN 추산에 따르면 2050년에는 25억 명이 더 도시에 살게 될 것이며 이는 세계 인구의 68%에 해당한다.[2]. 런던, 스톡홀름, 싱가포르, 뉴욕 등의 도시에서는 혼잡통행료 구역이 설정되거나 증가되었으며, 이는 1인 차량 여행에 비해 차량 합승, 공유 여행 매칭을 직접적으로 장려합니다. 2024년까지 런던의 초저배출 지역은 중앙 교통량을 17% 줄이고 연간 2억 2천만 파운드 이상의 수익을 창출하여 통근자들이 차량 공유 시장을 이용하도록 장려했습니다.[12].
자율 Robotaxi 함대 배치
Waymo는 2024년 말까지 샌프란시스코, 피닉스, 로스앤젤레스 전역에서 주당 유료 자율 주행 횟수가 150,000회를 초과했습니다. 이는 자율 주행에 대한 가장 가시적인 증거 포인트를 나타냅니다.로봇택시상업적 규모의 차량 공유[9]. 크루즈는 2023년 운영 중단에도 불구하고 GM의 재구성된 자율 부문에 따라 2025년 제한적인 테스트를 재개했습니다. 중국 바이두 아폴로 고(Baidu Apollo Go)는 2024년 중반까지 누적 로보택시 탑승 횟수가 700만 회 이상을 달성했습니다.[13]. 이러한 배포는 운전자 비용(일반적으로 승차당 경제성의 60~65%)을 제거하고 일단 확장되면 승차 플랫폼 요금을 40%까지 압축할 수 있습니다.
전기 자동차 함대 전환
Uber와 Lyft는 2030년까지 차량 공유 플랫폼 차량 마일의 90%가 배출가스 제로가 되도록 규정하는 캘리포니아의 Clean Miles Standard를 준수하기 위해 차량을 전기 자동차로 전환해야 합니다.[4]. 비즈니스 차량에 대한 유사한 전기화 일정은 EU의 "Fit for 55" 계획에 따라 추진됩니다. 조기 전기화는 마일당 운영 비용을 절감하고(ICE의 경우 0.04~0.06달러/마일, ICE의 경우 0.12~0.15달러/마일) 차량 공유 시장 운영자가 규제 지역의 공항 및 연석에 우선적으로 접근할 수 있도록 해줍니다.
기업 출퇴근 프로그램 확대
2024년 Global Workplace Analytics 연구에 따르면 Fortune 500대 기업 중 62%가 현재 차량 공유 플랫폼을 통해 직원 통근 프로그램에 보조금을 지급하고 있는 것으로 나타났습니다.[5]. 기업의 차량 공유 직원 출퇴근 지출은 2025년 전 세계적으로 약 83억 달러에 달했으며, Via, Zeelo 및 Uber for Business가 대부분의 기업 계약을 체결했습니다. 직원당 월 최대 USD 315까지 제공되는 미국 자격을 갖춘 교통 부가 혜택을 포함한 세금 인센티브로 채택이 가속화됩니다.
제약 영향 분석
아래 영향은 성장을 완화하는 방향성 역풍입니다. 명시된 CAGR에서 선형적으로 차감되지 않습니다.
| 제지 |
CAGR에 대한 ~% 영향 |
지리적 관련성 |
영향 타임라인 |
참조 |
| 운전자 분류 및 노동쟁의 |
-1.2% |
EU, 캘리포니아, 영국 |
단기(2년 이하) |
[11] |
| 승차 공유 규제, 보험 및 책임 분절화 |
-0.9% |
글로벌 |
장기(≥4년) |
[14] |
| 데이터 개인 정보 보호 및 감시 문제 |
-0.5% |
EU, 인도 |
중기(2~4년) |
[15] |
| 신흥 시장의 인프라 격차 |
-0.7% |
아프리카, 남아시아 |
장기(≥4년) |
[16] |
| 자율주행차 책임의 모호함 |
-0.4% |
북미, EU |
중기(2~4년) |
[9] |
운전자 분류 및 노동 규제
2024년에 채택된 EU의 플랫폼 작업 지침은 특정 기준을 충족하는 긱 근로자에 대한 고용에 대한 법적 추정을 설정하여 차량 공유 플랫폼 운영자가 운전자를 재분류하거나 참여 모델을 재구성하도록 강제합니다.[11]. 캘리포니아의 AB5 판례와 영국 대법원의 2021년 Uber 판결은 중복되고 때로는 모순되는 규정 준수 부담을 야기했습니다. 재분류는 승차당 비용을 약 15~25% 증가시켜 승차 공유 시장 전체의 마진을 압축하고 규제가 심한 관할 지역의 확장을 둔화시킵니다.
관할권 전반에 걸친 규제 단편화
두 국가 모두 차량 공유에 관한 동일한 법률을 갖고 있지 않습니다. 차량 공유 규정에 대한 보험 책임 요건은 미국의 의무 상업용 자동차 정책부터 일본의 준공공 제도, 독일과 스페인의 일부 지역에서 전면적 플랫폼 금지(최근 반전까지)까지 다양합니다.[14]. 운영자는 시장 진입을 지연시키고 간접비를 증가시키는 이 패치워크의 결과로 관할권별 규정 준수 팀을 유지해야 합니다. 라이드풀링과 공유여행 매칭공간의 스타트업은 불균형적인 장애물에 직면해 있습니다.
데이터 개인 정보 보호 제약
서비스 최적화와 소비자 개인 정보 보호 간의 충돌은 네덜란드에서 Uber의 2024년 2억 9천만 유로 벌금과 같은 차량 호출 플랫폼의 위치 추적 방법에 대한 GDPR 집행 절차에서 강조됩니다.[15]. 인도의 디지털 개인 데이터 보호법(2023)에 의해 부과된 동의 및 데이터 현지화 규칙은 차량 공유 시장 플랫폼에 대한 인프라 비용을 증가시킵니다.
.
차량 공유 시장 기회
대규모 자율 로보택시 상용화
2029~2031년까지 자율 로봇택시 차량 공유 비용이 인간이 주도하는 차량 공유 비용보다 낮아지면 차량 공유 시장 내에서 450~600억 달러 규모의 기회가 열립니다.[9]. 규제 승인 및 차량 관리 소프트웨어를 갖춘 최초 이동자는 불균형한 점유율을 차지할 것입니다.
Tier 2 및 Tier 3 도시에서 라이드 풀링 확장
라이드 풀링 공유 여행 매칭은 여전히 상위 25개 글로벌 대도시에 집중되어 있습니다. 대중 교통이 낙후되어 있지만 스마트폰 보급률이 70%를 초과하는 중규모 도시로 알고리즘 매칭을 확장하는 것은 2030년까지 연간 약 120억 달러 가치의 신규 기회를 의미합니다.
기업 Mobility-as-a-Service 번들링
기업에서는 점점 더 기업의 차량 공유 직원 통근 프로그램을 주차 관리와 결합하고 있습니다.마이크로 모빌리티구독 및 대중교통 이용권이 통합 모빌리티 예산으로 통합됩니다. 이러한 서비스를 통합하는 플랫폼은 독립형 차량호출 서비스에 비해 계정당 수익을 3~4배 증가시킬 수 있습니다.
데이터 수익화 및 도시 계획 파트너십
차량 공유 시장 플랫폼은 매일 수십억 개의 GPS 데이터 포인트를 생성합니다. 익명화된 이동 흐름 분석을 지방자치단체 교통 당국, 부동산 개발자 및 소매점 전략가에게 제공하여 승차량과 관계없이 반복적인 SaaS 수익 흐름을 창출합니다.
아프리카, 동남아 신흥시장 도약
나이지리아, 케냐, 베트남, 필리핀과 같은 시장에서는 전통적인 택시 인프라를 앱 기반 차량 호출 플랫폼 모델로 직접 도약하고 있습니다. 아프리카의 차량 공유 보급률은 3% 미만으로 유지되어 엄청난 헤드룸을 나타냅니다.[16]
차량 공유 시장 미래 전망
자율 운영 및 AI 기반 차량 관리
2032년까지 자율 로봇택시 승차 공유는 미국과 중국의 전체 승차 공유 시장 여행량의 8~12%를 차지할 것으로 예상됩니다.[9]. AI 기반 함대재조정, 예측 수요 모델링 및 차량 상태 모니터링을 통해 플랫폼 운영 비용을 20~30% 절감하여 요금을 낮추고 이용 가능한 승객 풀을 확장할 수 있습니다.
플랫폼 경제 및 통합
수익성 압박이 가중됨에 따라 차량호출 플랫폼 환경은 더욱 통합될 가능성이 높습니다. Uber, Lyft, Grab 및 DiDi는 대상 시장의 75% 이상을 공동으로 통제합니다. 이는 독점 금지 조사를 유발할 수 있을 뿐만 아니라 차량 공유 시장에서 자율 및 전기 전환에 자금을 지원하는 데 필요한 규모의 경제를 가능하게 하는 집중입니다.[6][18].
전력화 및 그리드 통합
IEA 글로벌 EV 전망(Global EV Outlook) 예측에 따르면 주요 플랫폼 전반에 걸쳐 전기 자동차 탑승 공유 차량 보급률은 2030년까지 40~50%에 도달하고 2035년까지 75%를 초과할 것으로 예상됩니다.[19]. 차량-그리드(V2G) 통합은 유휴 승차 공유 차량을 분산 에너지 자산으로 전환하여 차량 운영자를 위한 2차 수익원을 창출할 수 있습니다.
ESG 보고 및 지속가능성 의무사항
기관 투자자들은 점점 더 측정 가능한 ESG 성과에 따라 자본 배분을 결정하고 있습니다. 감사된 승차당 배출량 지표, 운전자 복지 지수 및 승차 공유 공유 여행 매칭 활용률을 게시하는 승차 공유 시장 플랫폼은 우대 금융 조건을 유치할 것입니다. 기후 관련 재무 공개 태스크포스(TCFD) 프레임워크는 모빌리티 부문 보고의 사실상 표준이 되고 있습니다.[20].
지역 시장 점유율 분석
| 지역 |
주요 지표 |
주요 투자 테마 |
| 북아메리카 |
38% 점유율(미화 411억 달러) |
자율 로보택시 탑승 공유 조종사, EV 차량 의무화 |
| 유럽 |
25% 지분(미화 271억 달러) |
승차 공유 규제, 보험 책임 개혁, 전동화 |
| 아시아 태평양 |
CAGR 12.6% |
슈퍼앱 생태계, 라이드 풀링, 공유 여행 매칭 및 밀도 |
| 남아메리카 |
USD 5.4 B |
모토택시 디지털화, 핀테크 라이드 통합 |
| 중동 및 아프리카 |
CAGR 11.3% |
정부가 지원하는 스마트시티 프로그램 |
| 총 |
USD 108.2 B |
— |
승차 공유 시장은 규제 성숙도, 도시화 밀도 및 차량 소유 경제에 의해 형성되는 뚜렷한 지역 역학을 보여줍니다.
북아메리카
| 국가 |
주요 지표 |
주요 드라이버 |
| 미국 |
지역 점유율 82% |
우버/리프트 듀오폴리머, 자율주행 로보택시 승차공유 확대 |
| 캐나다 |
CAGR 9.8% |
토론토, 밴쿠버의 도시 밀집화 |
| 멕시코 |
USD 2.1 B |
DiDi와 Uber는 차량 호출 플랫폼 지배력을 놓고 경쟁하고 있습니다. |
미국은 여전히 차량 공유 혁신의 글로벌 진원지입니다. Uber의 미국 총 예약은 2024년에 400억 달러를 초과했으며 Waymo의 자율 차량은 주간 150,000회 이상의 탑승을 처리했습니다.[3][9]. 캐나다의 차량 공유 시장은 인센티브를 제공하는 연방 청정 연료 규정의 혜택을 받습니다.전기 자동차주요 대도시에 차량 공유 차량 배치.
유럽
| 국가 |
주요 지표 |
주요 드라이버 |
| 영국 |
지역 점유율 31% |
TfL 라이센스 프레임워크, Bolt 확장 |
| 독일 |
CAGR 10.9% |
규제완화 이후 차량호출 플랫폼의 성장 |
| 프랑스 |
USD 4.2 B |
BlaBlaCar 도시 간 풀링, 승차 공유 규제, 보험, 책임 조정 |
유럽의 플랫폼 작업 지침은 승차 공유 시장의 경쟁 환경을 재편하여 규정 준수 비용을 높이는 동시에 서비스 신뢰성을 향상시키는 운전자 보호를 공식화하고 있습니다.[11]. EU의 "Fit for 55" 기후 패키지는 모든 회원국에서 전기 자동차 공유 차량 전환을 가속화하도록 요구합니다.
아시아 태평양
| 국가 |
주요 지표 |
주요 드라이버 |
| 중국 |
지역 점유율 42% |
DiDi의 지배력, 바이두 아폴로(Baidu Apollo) 자율 로봇택시 승차 공유 |
| 인도 |
CAGR 14.2% |
Ola/Uber 가격 전쟁, 이륜차 공유 플랫폼 성장 |
| 동남아시아 |
USD 7.8 B |
Grab/Gojek 슈퍼앱 생태계 |
아시아 태평양의 차량 공유 시장 성장은 인구 밀도, 낮은 차량 소유율, 차량 풀링, 결제와 공유 여행 매칭, 음식 배달 및 금융 서비스를 통합하는 슈퍼 앱 플랫폼에 의해 촉진됩니다.[10]. 인도에서만 2025년에서 2035년 사이에 1억 8천만 명의 새로운 차량 공유 사용자가 추가될 것으로 예상됩니다.
남아메리카
| 국가 |
주요 지표 |
주요 드라이버 |
| 브라질 |
지역 점유율 68% |
99(DiDi 자회사)와 Uber 경쟁 |
| 아르헨티나 |
CAGR 10.4% |
페소 평가절하로 인해 공유 승차 수요 증가 |
브라질의 차량 공유 시장은 높은 도시화율(87%)과 만성적인 대중교통 투자 부족으로 인해 혜택을 받고 있습니다. 99Motos와 같은 모토택시 플랫폼은 독특한 지역 성장 벡터입니다.[16].
중동 및 아프리카
| 국가 |
주요 지표 |
주요 드라이버 |
| UAE |
지역 점유율 38% |
Careem(Uber 자회사), 스마트 시티 이니셔티브 |
| 사우디아라비아 |
CAGR 13.1% |
비전 2030 도시 모빌리티 투자 |
| 나이지리아 |
USD 0.6 B |
Bolt의 급속한 확장, 은행 서비스를 받지 못하는 인구 및 핀테크 통합 |
사우디아라비아의 공공 투자 기금은 비전 2030에 따라 도시 이동성에 35억 달러 이상을 투입하여 차량 호출 플랫폼 인프라와자율주행차테스트 복도[17].
차량 공유 시장 세분화
서비스 유형별
| 분절 |
주요 지표 |
주요 수요 동인 |
| 차량 공유 |
62% 점유율 |
차량 공유 플랫폼 Uber Lyft의 지배력, 편의성 |
| 라이드 풀링/공유 여행 |
CAGR 13.4% |
비용 절감, 라이드 풀링, 공유 여행 매칭 알고리즘 |
| 자동차 렌탈/구독 |
USD 11.2 B |
유연한 소유권 대안 |
| 소형교통/셔틀 |
CAGR 11.8% |
기업 승차 공유 직원 출퇴근 프로그램 |
차량 공유는 차량 공유 시장의 중추로 남아 있으며, 1인 탑승, 주문형 여행을 통해 플랫폼 수익의 대부분을 창출합니다. Uber와 Lyft는 함께 미국 차량 호출량의 70% 이상을 차지하고 있으며 DiDi와 Grab은 각각 중국과 동남아시아에서 비슷한 위치를 차지하고 있습니다.[6]. 라이드 풀링 공유 여행 매칭은 가장 빠르게 성장하는 서비스 유형입니다. 이제 알고리즘은 밀집된 도시 복도에서 85% 이상의 일치율을 달성하여 혼자 여행에 비해 라이더당 비용을 30~40% 절감합니다.[8].
애플리케이션별
| 분절 |
주요 지표 |
주요 수요 동인 |
| 개인 이동성 |
74% 점유율 |
매일 출퇴근, 레저, 공항 교통편 |
| 기업 / 기업 |
CAGR 14.1% |
기업 차량 공유 직원 출퇴근 예산 |
| 정부/대중교통 통합 |
USD 4.6 B |
첫 번째/마지막 마일 대중교통 격차 솔루션 |
고용주가 관리형 모빌리티 프로그램을 채택함에 따라 기업용 차량 공유 시장이 급증하고 있습니다. Dallas Area Rapid Transit의 Via 기반 마이크로 교통 서비스와 같은 정부 파트너십은 차량 공유 플랫폼이 대중 교통을 대체하기보다는 보완하는 방법을 보여줍니다.[21].
차량 추진에 의한
| 분절 |
주요 지표 |
주요 수요 동인 |
| ICE 차량 |
점유율 61%(감소) |
레거시 함대 관성 |
| 배터리 전기 자동차 |
CAGR 18.2% |
전기 자동차 승차 공유 차량 의무화, TCO 절감 |
| 하이브리드 자동차 |
USD 14.8 B |
충전 인프라가 부족한 시장의 전환 교량 |
전기 자동차 승차 공유 차량 부문은 승차 공유 시장에서 가장 역동적인 변화를 나타냅니다. 선전이나 오슬로와 같은 도시에서 BEV가 많은 차량을 운영하는 플랫폼은 ICE에 비해 마일당 연료 및 유지 관리 비용이 35~45% 더 낮다고 보고했습니다.[4][19].
경쟁 벤치마킹
차량 공유 시장은 상위 15개 글로벌 시장에서 약 1,800~2,200의 HHI로 추정되는 중간에서 높은 농도를 나타냅니다. 상위 5개 플랫폼은 전체적으로 전 세계 총 예약의 약 65~70%를 차지하지만 지역 구성은 크게 다릅니다.
| 회사 |
예상 수익 공유 범위 |
차량 공유 시장을 위한 주요 제품 |
전략적 포지셔닝 |
| 우버 기술 |
~28~32% |
차량 공유, UberPool, Uber for Business 및 자율 파트너십 |
차량공유 플랫폼을 장악한 글로벌 규모의 리더 |
| 디디 글로벌 |
~18~22% |
차량호출, 카풀, 자율주행 조종사 |
중국 + 라틴아메리카 거점 |
| 리프트 |
~6~9% |
차량 공유, 공유 차량, 자전거/스쿠터 대여 |
미국/캐나다 중심, 라이드 풀링, 공유 여행 매칭 |
| 그랩 홀딩스 |
~5~7% |
슈퍼앱: 차량 서비스, 배달, 결제 |
동남아시아 생태계 잠금 |
| 볼트(택시파이) |
~3~5% |
차량 호출, 마이크로 모빌리티, 음식 배달 |
유럽 및 아프리카 확장 |
| 올라 택시 |
~3~5% |
차량공유 서비스, Ola Electric 차량 |
인도의 지배적인 전기 자동차 차량 공유 차량 개척자 |
| BlaBla자동차 |
~2~3% |
장거리 승차풀링, 버스 장터 |
유럽 도시 간 차량 공유 |
| 교통수단 이용 |
~1~2% |
B2B 서비스형 대중교통, 마이크로 대중교통 |
기업의 차량 공유 직원 출퇴근 기술 |
| Waymo(알파벳) |
~1~2% |
자율주행 로보택시 승차 공유 서비스 |
기술 우선, 무인 전용 모델 |
|
카림(우버) |
~1~2% |
차량공유, 결제 슈퍼앱 |
중동 및 북아프리카 |
최신 뉴스 및 개발
- Waymo(2024년 10월): 자율 로봇택시 승차 공유 서비스를 로스앤젤레스로 확장하여 미국 3개 도시에서 주간 유료 승차 횟수가 100,000회 이상 달성[9].
- Uber Technologies(2024년 8월): 2027년까지 전 세계적으로 차량 공유 플랫폼에 100,000대의 전기 자동차를 배포하기 위해 BYD와 파트너십을 발표하여 전기 자동차 차량 공유 차량 목표를 가속화합니다.[4].
- 유럽 연합(2024년 4월): 플랫폼 작업 지침을 채택하여 27개 회원국의 차량 공유 규제 보험 책임 프레임워크에 영향을 미치는 고용 추정 기준을 설정했습니다.[11].
- 그랩 홀딩스(2024년 1월): 자카르타와 방콕에서 GrabPool AI 최적화 라이드 풀링 공유 여행 매칭 출시, 이전 알고리즘 대비 22% 더 높은 매칭률 보고[10].
- Lyft(2025년 3월): 라스베이거스에서 Motional 기반 로봇택시 서비스를 위해 "Lyft Autonomous" 브랜드를 도입했습니다. 이는 예정된 무인 차량 서비스를 제공하는 미국 최초의 차량 공유 플랫폼입니다.[22].
- Ola Electric(2024년 6월): 인도 50개 도시의 기업 차량 공유 직원 통근 프로그램을 위해 전기 이륜차 차량 확장에 5억 달러를 투자했습니다.[23].
- 사우디아라비아 PIF(2023년 11월): Vision 2030에 따라 NEOM의 자율주행차 테스트 구역을 포함하여 국내 차량 공유 인프라에 13억 달러 투자[17].
- 바이두 아폴로 고(2024년 9월): 중국 내 누적 자율 주행 횟수 800만 건 돌파, 우한에서 완전 무인 운행에 대한 규제 승인 확보[13].
- Lyft(2025년 7월): Lyft는 1억 7,500만 유로(1억 9,100만 달러)에 FREENOW 인수를 완료하여 11개 국가, 거의 1,000개 도시로 입지를 확장했습니다.
- Waymo(2025년 6월): Waymo와 Uber는 애틀랜타에서 무인 Jaguar I-PACE 차량을 사용하여 65평방마일에 달하는 상업용 로봇택시 서비스를 시작했습니다.
자주 묻는 질문
Q1. 차량 공유 플랫폼은 어떻게 여행 요금 외에 데이터로 수익을 창출하나요?
플랫폼은 익명화된 출발지-목적지 흐름 데이터를 도시 계획자, 부동산 개발자 및 광고주에게 라이선스합니다. 이 서비스형 데이터 수익 흐름은 주요 차량 공유 플랫폼 운영업체 전체에서 매년 약 20%씩 성장하고 있습니다.[18].
Q2. 자율주행 로보택시가 사고에 연루되면 어떤 보험 구조가 적용되나요?
대부분의 관할권에서는 승객이 아닌 자율주행차 운영자 또는 기술 제공자에게 일차적 책임을 부여합니다. 캘리포니아와 영국이 정책 개발을 주도하면서 승차 공유 규제 보험 책임 체계가 진화하고 있습니다.[14].
Q3. 라이드 풀링은 솔로 라이드 헤일링과 비교하여 운전자 수입에 어떤 영향을 미치나요?
라이드 풀링 공유 여행 매칭 경로의 운전자는 일반적으로 여행당 10~15% 적은 수입을 얻지만 데드헤드 마일 감소로 인해 시간당 25~30% 더 많은 여행을 완료합니다.[8]. 순 시간당 수입은 비슷한 수준으로 유지됩니다.
Q4. 기관 투자자에게 최고의 진입점을 제공하는 차량 공유 시장 부문은 무엇입니까?
전기 자동차 승차 공유 차량 운영자와 자율 기술 제공업체는 가장 높은 성장 배수를 제공합니다. 차량 중심 SPAC와 Waymo의 예상 IPO는 면밀히 관찰되는 기회입니다.[9][19].
Q5. 기업의 차량 공유 프로그램이 기존 전사적 자원 관리 시스템과 통합될 수 있나요?
예. Via 및 Uber for Business와 같은 플랫폼은 자동화된 비용 조정을 위해 SAP, Oracle, Workday와의 API 통합을 제공합니다. IT 마찰이 최소화되면 기업의 차량 공유 직원 출퇴근 채택이 가속화됩니다.[5].
Q6. 인도의 새로운 차량 공유 시장 규정은 서구 프레임워크와 어떻게 다릅니까?
인도의 자동차 통합업체 지침은 플랫폼 수수료를 20%로 제한하고 운전자 복지 기금을 의무화합니다. 대부분의 서구 차량 공유 규제 보험 책임 모델보다 엄격합니다.[14][16].
Q7. 도시 탈탄소화 목표에서 승차 공유 시장은 어떤 역할을 합니까?
암스테르담 및 선전과 같은 도시에서는 2030년까지 100% 탄소 배출이 없는 차량 공유 플랫폼을 의무화합니다. 공유 차량은 개인 차량 사용량에 비해 1인당 탄소 배출량을 45~55% 줄여 차량 공유 시장을 주요 도시 기후 도구로 만듭니다.[12][19].
차량 공유 시장 보고서 범위
| 매개변수 |
세부 사항 |
| 시장 범위 |
차량호출, 차량풀링, 마이크로교통, 자율주행 서비스를 포함한 글로벌 차량 공유 시장 |
| 학습기간 |
2021~2035년 |
| CAGR |
10.1% (2026~2035) |
| 기준 연도 시장 규모 |
USD 108.2 Billion (2025) |
| 예측 엔드포인트 |
USD 283.0 Billion (2035) |
| 가장 빠르게 성장하는 부문 |
라이드풀링 공유여행 매칭 (CAGR 13.4%) |
| 프로파일링된 회사 |
Uber, DiDi, Lyft, Grab, Bolt, Ola, BlaBlaCar, Via, Waymo, Careem |
| 평가통화 |
USD(2025년 달러 고정가) |