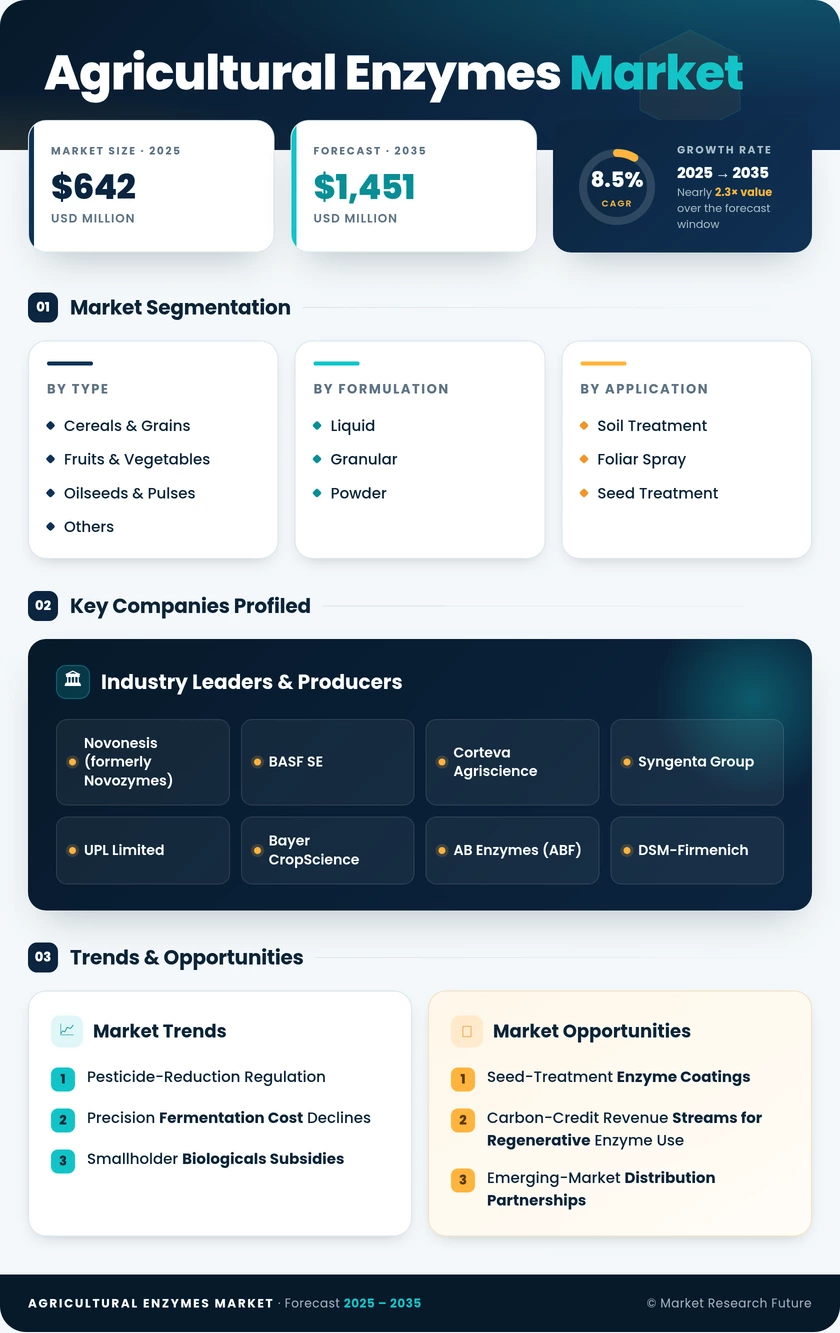
Agricultural Enzymes Market (2026 - 2035)

Agricultural Enzymes Market Size, Share, Industry Trend & Analysis Research Report Information By Enzyme Type (Phosphatases, Cellulases, Dehydrogenases, Ureases, Others), By Formulation (Liquid, Granular, Powder), By Application (Fertility Enhancement, Crop Protection, Residue Management), By Mode of Application (Soil Treatment, Foliar Spray, Seed Treatment), By Crop Type (Cereals & Grains, Fruits & Vegetables, Oilseeds & Pulses, Others) – Forecast Till 2035

Forecast Period
2026-2035
CAGR
8.5%
2025 Market Size
USD 642 Million (2025)
2035 Market Size
USD 1,451 Million (2035)
Agriculture ● Updated July 2026 Report ID: MRFR/Agri/3734-CR | Pages: 90 | Author: Snehal Singh, Pradeep Nandi
  1. 1 Market Overview |
    1. 1.1 Study Assumptions & Market Definition |
    2. 1.2 Scope of the Study |
    3. 1.3 Research Methodology
  2. 2 Market Summary & Key Takeaways
  3. 3 Market Dynamics |
    1. 3.1 Market Drivers Analysis | |
      1. 3.1.1 Pesticide-Reduction Regulation | |
      2. 3.1.2 Precision Fermentation Cost Declines | |
      3. 3.1.3 Smallholder Biologicals Subsidies | |
      4. 3.1.4 AI-Driven Protein Engineering | |
      5. 3.1.5 Carbon-Credit Monetization Programs | |
      6. 3.1.6 Consumer Demand for Residue-Free Produce | |
      7. 3.1.7 Expansion of Drip and Precision Irrigation |
    2. 3.2 Market Restraints Analysis | |
      1. 3.2.1 Cold-Chain and Shelf-Life Limitations | |
      2. 3.2.2 Fragmented Regulatory Approval Pathways | |
      3. 3.2.3 Farmer Awareness and Technical Literacy Gaps | |
      4. 3.2.4 Price Sensitivity in Subsistence Agriculture | |
      5. 3.2.5 Inconsistent Field Efficacy Across Soil Types |
    3. 3.3 Market Opportunity Analysis | |
      1. 3.3.1 Seed-Treatment Enzyme Coatings | |
      2. 3.3.2 Carbon-Credit Revenue Streams for Regenerative Enzyme Use | |
      3. 3.3.3 Emerging-Market Distribution Partnerships | |
      4. 3.3.4 Data-Driven Enzyme Prescription Services | |
      5. 3.3.5 Multi-Enzyme Cocktail Development |
    4. 3.4 Industry Value Chain Analysis |
    5. 3.5 Porter's Five Forces Analysis
  4. 4 Global Agricultural Enzymes Market Size & Forecast (2021–2035) |
    1. 4.1 Historical Market Size (2021–2025) |
    2. 4.2 Current & Forecast Market Size (2026–2035) |
    3. 4.3 Market Size by Revenue (USD Million) |
    4. 4.4 Year-over-Year Growth Analysis
  5. 5 Segmentation Analysis |
    1. 5.1 By Enzyme Type | |
      1. 5.1.1 Phosphatases | |
      2. 5.1.2 Cellulases | |
      3. 5.1.3 Dehydrogenases | |
      4. 5.1.4 Ureases | |
      5. 5.1.5 Others |
    2. 5.2 By Formulation | |
      1. 5.2.1 Liquid | |
      2. 5.2.2 Granular | |
      3. 5.2.3 Powder |
    3. 5.3 By Application | |
      1. 5.3.1 Fertility Enhancement | |
      2. 5.3.2 Crop Protection | |
      3. 5.3.3 Residue Management |
    4. 5.4 By Mode of Application | |
      1. 5.4.1 Soil Treatment | |
      2. 5.4.2 Foliar Spray | |
      3. 5.4.3 Seed Treatment |
    5. 5.5 By Crop Type | |
      1. 5.5.1 Cereals & Grains | |
      2. 5.5.2 Fruits & Vegetables | |
      3. 5.5.3 Oilseeds & Pulses | |
      4. 5.5.4 Others
  6. 6 Regional Analysis |
    1. 6.1 North America | |
      1. 6.1.1 United States | |
      2. 6.1.2 Canada | |
      3. 6.1.3 Mexico |
    2. 6.2 Europe | |
      1. 6.2.1 Germany | |
      2. 6.2.2 United Kingdom | |
      3. 6.2.3 France | |
      4. 6.2.4 Italy | |
      5. 6.2.5 Spain | |
      6. 6.2.6 Nordic Countries | |
      7. 6.2.7 Russia | |
      8. 6.2.8 Rest of Europe |
    3. 6.3 Asia-Pacific | |
      1. 6.3.1 China | |
      2. 6.3.2 India | |
      3. 6.3.3 Japan | |
      4. 6.3.4 South Korea | |
      5. 6.3.5 ASEAN | |
      6. 6.3.6 Rest of Asia-Pacific |
    4. 6.4 South America | |
      1. 6.4.1 Brazil | |
      2. 6.4.2 Argentina | |
      3. 6.4.3 Rest of South America |
    5. 6.5 Middle East & Africa | |
      1. 6.5.1 Saudi Arabia | |
      2. 6.5.2 UAE | |
      3. 6.5.3 South Africa | |
      4. 6.5.4 Egypt | |
      5. 6.5.5 Rest of MEA
  7. 7 Competitive Landscape |
    1. 7.1 Market Share Analysis (2025) |
    2. 7.2 Competitive Benchmarking Matrix |
    3. 7.3 Company Profiles | |
      1. 7.3.1 Novonesis (formerly Novozymes) | |
      2. 7.3.2 BASF SE | |
      3. 7.3.3 Corteva Agriscience | |
      4. 7.3.4 Syngenta Group | |
      5. 7.3.5 UPL Limited | |
      6. 7.3.6 Bayer CropScience | |
      7. 7.3.7 AB Enzymes (ABF) | |
      8. 7.3.8 DSM-Firmenich | |
      9. 7.3.9 Alltech | |
      10. 7.3.10 Agrinos
  8. 8 Future Outlook & Strategic Recommendations (2026–2035) |
    1. 8.1 AI-Optimized Enzyme Discovery and Deployment |
    2. 8.2 Platform Economics and Enzyme-as-a-Service Models |
    3. 8.3 Regenerative Agriculture and Carbon Finance Integration |
    4. 8.4 Supply-Chain Resilience and Regional Manufacturing
  9. 9 Recent Developments & News
  10. 10 Frequently Asked Questions (FAQs)
  11. 11 Report Scope & Methodology |
    1. 11.1 Study Period & Base Year |
    2. 11.2 Data Sources & Citations |
    3. 11.3 Abbreviations
  12. 12 LIST OF TABLES |
  13. TABLE 1 Global Agricultural Enzymes Market Size & Forecast, by Revenue (USD Million), 2021–2035 |
  14. TABLE 2 Global Agricultural Enzymes Market – Year-over-Year Growth Analysis, 2021–2035 |
  15. TABLE 3 Market Driver Impact Analysis, 2026–2035 |
  16. TABLE 4 Market Restraint Impact Analysis, 2026–2035 |
  17. TABLE 5 Global Agricultural Enzymes Market Size, by Enzyme Type, 2021–2035 (USD Million) |
  18. TABLE 6 Global Agricultural Enzymes Market Size, by Formulation, 2021–2035 (USD Million) |
  19. TABLE 7 Global Agricultural Enzymes Market Size, by Application, 2021–2035 (USD Million) |
  20. TABLE 8 Global Agricultural Enzymes Market Size, by Mode of Application, 2021–2035 (USD Million) |
  21. TABLE 9 Global Agricultural Enzymes Market Size, by Crop Type, 2021–2035 (USD Million) |
  22. TABLE 10 Global Agricultural Enzymes Market Size, by Region, 2021–2035 (USD Million) |
  23. TABLE 11 North America Agricultural Enzymes Market Size, by Country, 2021–2035 (USD Million) |
  24. TABLE 12 Europe Agricultural Enzymes Market Size, by Country, 2021–2035 (USD Million) |
  25. TABLE 13 Asia-Pacific Agricultural Enzymes Market Size, by Country, 2021–2035 (USD Million) |
  26. TABLE 14 South America Agricultural Enzymes Market Size, by Country, 2021–2035 (USD Million) |
  27. TABLE 15 Middle East & Africa Agricultural Enzymes Market Size, by Country, 2021–2035 (USD Million) |
  28. TABLE 16 Competitive Benchmarking Matrix – Global Agricultural Enzymes Market, 2025 |
  29. TABLE 17 Company Profiles – Key Players, Global Agricultural Enzymes Market |
  30. TABLE 18 Recent Developments & Strategic Announcements, 2023–2025 |
  31. TABLE 19 North America Agricultural Enzymes Market Size, by Enzyme Type, 2021–2035 (USD Million) |
  32. TABLE 20 North America Agricultural Enzymes Market Size, by Formulation, 2021–2035 (USD Million) |
  33. TABLE 21 North America Agricultural Enzymes Market Size, by Application, 2021–2035 (USD Million) |
  34. TABLE 22 North America Agricultural Enzymes Market Size, by Mode of Application, 2021–2035 (USD Million) |
  35. TABLE 23 North America Agricultural Enzymes Market Size, by Crop Type, 2021–2035 (USD Million) |
  36. TABLE 24 Europe Agricultural Enzymes Market Size, by Enzyme Type, 2021–2035 (USD Million) |
  37. TABLE 25 Europe Agricultural Enzymes Market Size, by Formulation, 2021–2035 (USD Million) |
  38. TABLE 26 Europe Agricultural Enzymes Market Size, by Application, 2021–2035 (USD Million) |
  39. TABLE 27 Europe Agricultural Enzymes Market Size, by Mode of Application, 2021–2035 (USD Million) |
  40. TABLE 28 Europe Agricultural Enzymes Market Size, by Crop Type, 2021–2035 (USD Million) |
  41. TABLE 29 Asia-Pacific Agricultural Enzymes Market Size, by Enzyme Type, 2021–2035 (USD Million) |
  42. TABLE 30 Asia-Pacific Agricultural Enzymes Market Size, by Formulation, 2021–2035 (USD Million) |
  43. TABLE 31 Asia-Pacific Agricultural Enzymes Market Size, by Application, 2021–2035 (USD Million) |
  44. TABLE 32 Asia-Pacific Agricultural Enzymes Market Size, by Mode of Application, 2021–2035 (USD Million) |
  45. TABLE 33 Asia-Pacific Agricultural Enzymes Market Size, by Crop Type, 2021–2035 (USD Million) |
  46. TABLE 34 South America Agricultural Enzymes Market Size, by Enzyme Type, 2021–2035 (USD Million) |
  47. TABLE 35 South America Agricultural Enzymes Market Size, by Formulation, 2021–2035 (USD Million) |
  48. TABLE 36 South America Agricultural Enzymes Market Size, by Application, 2021–2035 (USD Million) |
  49. TABLE 37 South America Agricultural Enzymes Market Size, by Mode of Application, 2021–2035 (USD Million) |
  50. TABLE 38 South America Agricultural Enzymes Market Size, by Crop Type, 2021–2035 (USD Million) |
  51. TABLE 39 Middle East & Africa Agricultural Enzymes Market Size, by Enzyme Type, 2021–2035 (USD Million) |
  52. TABLE 40 Middle East & Africa Agricultural Enzymes Market Size, by Formulation, 2021–2035 (USD Million) |
  53. TABLE 41 Middle East & Africa Agricultural Enzymes Market Size, by Application, 2021–2035 (USD Million) |
  54. TABLE 42 Middle East & Africa Agricultural Enzymes Market Size, by Mode of Application, 2021–2035 (USD Million) |
  55. TABLE 43 Middle East & Africa Agricultural Enzymes Market Size, by Crop Type, 2021–2035 (USD Million) |
  56. TABLE 44 Report Scope & Methodology Summary |
  57. TABLE 45 Detailed Sources and Citations
  58. 13 LIST OF FIGURES |
  59. FIGURE 1 Agricultural Enzymes Market Dynamics — Drivers, Restraints, and Opportunities |
  60. FIGURE 2 Industry Value Chain Analysis — Agricultural Enzymes Market |
  61. FIGURE 3 Porter's Five Forces Analysis — Agricultural Enzymes Market |
  62. FIGURE 4 Global Agricultural Enzymes Market Size Trend (USD Million), 2021–2035 |
  63. FIGURE 5 Agricultural Enzymes Market Share by Enzyme Type, 2025 |
  64. FIGURE 6 Agricultural Enzymes Market Share by Formulation, 2025 |
  65. FIGURE 7 Agricultural Enzymes Market Share by Application, 2025 |
  66. FIGURE 8 Agricultural Enzymes Market Share by Mode of Application, 2025 |
  67. FIGURE 9 Agricultural Enzymes Market Share by Crop Type, 2025 |
  68. FIGURE 10 Agricultural Enzymes Market Share by Region, 2025 |
  69. FIGURE 11 North America Agricultural Enzymes Market Size (USD Million), 2021–2035 |
  70. FIGURE 12 Europe Agricultural Enzymes Market Size (USD Million), 2021–2035 |
  71. FIGURE 13 Asia-Pacific Agricultural Enzymes Market Size (USD Million), 2021–2035 |
  72. FIGURE 14 South America Agricultural Enzymes Market Size (USD Million), 2021–2035 |
  73. FIGURE 15 Middle East & Africa Agricultural Enzymes Market Size (USD Million), 2021–2035 |
  74. FIGURE 16 Competitive Landscape — Agricultural Enzymes Market Revenue Share, 2025
Share::
Request Free Sample

Segmentation Quick Reference

DimensionSub-SegmentsDominant SegmentFastest Growing Segment
Enzyme TypePhosphatases, Cellulases, Dehydrogenases, Ureases, OthersPhosphatases (39% share, 2025)Cellulases (14.0% CAGR)
FormulationLiquid, Granular, PowderLiquid (49% share, 2025)Granular (12.5% CAGR)
ApplicationFertility Enhancement, Crop Protection, Residue ManagementFertility Enhancement (43% share, 2025)Crop Protection (12.1% CAGR)
Mode of ApplicationSoil Treatment, Foliar Spray, Seed TreatmentSoil Treatment (47% share, 2025)Seed Treatment (10.9% CAGR)
Crop TypeCereals & Grains, Fruits & Vegetables, Oilseeds & Pulses, OthersCereals & Grains (42% share, 2025)Fruits & Vegetables (10.9% CAGR)


Market Segmentation Overview

By Enzyme Type

Sub-SegmentKey Trend
PhosphatasesRising demand for phosphorus mobilization in soils depleted by intensive monoculture
CellulasesExpanding use in no-till residue decomposition and organic composting operations
DehydrogenasesGrowing adoption of soil-health diagnostic indicators and redox-activity markers
UreasesIncreasing integration in nitrogen-management programs to reduce volatilization losses
OthersSpecialty proteases and lipases are gaining traction in high-value horticultural applications


Phosphatases remain the backbone of the Agricultural Enzymes Market, reflecting the global urgency of addressing phosphorus scarcity in agricultural soils. Cellulases are attracting the most new investment as conservation-agriculture practices expand and regulators in key markets phase out open-field burning of crop residues.

By Formulation

Sub-SegmentKey Trend
LiquidPreferred for fertigation systems and precision foliar-spray equipment
GranularGaining share in tropical markets where cold-chain limitations favor dry formats
PowderValued for long shelf life and low-cost bulk shipping to emerging markets


Liquid formats dominate current sales due to their seamless integration with modern irrigation infrastructure. Granular products are closing the gap as encapsulation and slow-release technologies improve enzyme stability and extend field-level activity duration.

By Application

Sub-SegmentKey Trend
Fertility EnhancementCore application for phosphatase and urease products in broadacre cropping
Crop ProtectionFast-growing segment driven by biopesticide regulatory incentives in the EU and US.
Residue ManagementGaining importance as no-till acreage expands in South America and South Asia


Fertility enhancement captures the largest revenue share because virtually every crop system benefits from improved nutrient availability. Crop protection is the fastest-growing application as regulators globally accelerate biopesticide approval pathways.

By Mode of Application

Sub-SegmentKey Trend
Soil TreatmentDominant mode delivering enzymes directly to the rhizosphere
Foliar SprayOffers rapid nutrient-uptake response for time-sensitive crop stages
Seed TreatmentFastest-growing mode as coating technologies improve enzyme stability.


Soil treatments account for the largest share of enzyme delivery because root-zone application maximizes catalytic contact time. Seed treatments are the fastest-growing mode, driven by grower preference for single-pass application and reduced operational complexity.

By Crop Type

Sub-SegmentKey Trend
Cereals & GrainsThe largest segment by acreage is led by wheat, rice, and maize
Fruits & VegetablesFastest-growing segment driven by residue-free export market requirements
Oilseeds & PulsesGrowing demand for enzyme seed treatments in soy and canola production
OthersCotton, sugarcane, and specialty crops are adopting enzyme-based soil health programs.


Cereals and grains represent the dominant crop category due to the massive global cultivated area dedicated to staple grain production. Fruits and vegetables are growing fastest as international retailers tighten pesticide-residue standards for imported fresh produce.


 

Share::
Request Free Sample
Download PDF ×

We do not share your information with anyone. However, we may send you emails based on your report interest from time to time. You may contact us at any time to opt-out.