Request Free Sample ×

Kindly complete the form below to receive a free sample of this Report

* Please use a valid business email

Leading companies partner with us for data-driven Insights

clients tt-cursor
Hero Background

Agricultural Inoculants Market

ID: MRFR/Agri/3077-CR
144 Pages
Snehal Singh, Varsha More
Last Updated: May 28, 2026
Agricultural Inoculants Market Size, Share, Industry Trend & Analysis Research Report Information By Function (Crop Nutrition, Biocontrol Agents), By Microorganism (Bacteria, Fungi, Other Microorganisms), By Mode of Application (Seed Inoculation, Soil Inoculation), By Crop Type (Cereals and Grains, Pulses and Oilseeds, Fruits and Vegetables, Other Crops) – Forecast Till 2035
Download PDF ×

We do not share your information with anyone. However, we may send you emails based on your report interest from time to time. You may contact us at any time to opt-out.


Agricultural Inoculants Market Summary

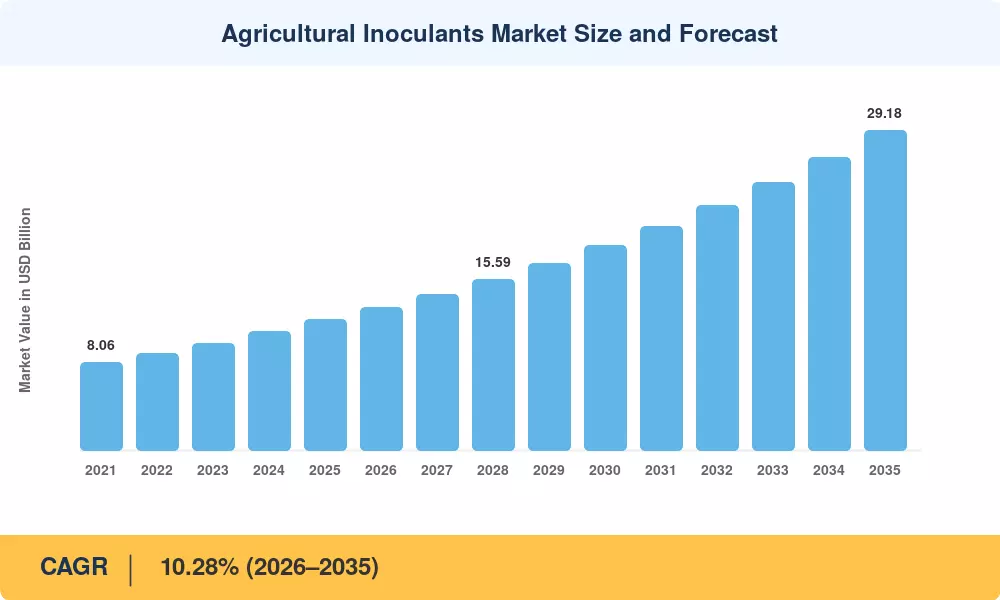
The Agricultural Inoculants Market reached an estimated USD 11.92 billion in 2025 and is projected to grow from USD 13.21 billion in 2026 to USD 29.18 billion by 2035, registering a CAGR of 10.28% during the forecast period. Carbon-credit incentive programs across North America and the EU's revised Common Agricultural Policy are channeling billions toward biological crop inputs, making microbial seed inoculants a core line item in grower input budgets. Venture capital flowing into encapsulation and shelf-life extension platforms — over USD 1.8 billion deployed globally between 2022 and 2025 — has accelerated commercialization timelines for next-generation rhizobium nitrogen-fixing bacteria strains and multi-species consortia [2][3].

A generational shift is underway in crop fertility management. Synthetic fertilizer dependency — which peaked at roughly 200 million metric tons of nutrient consumption globally — is being partially displaced by biofertilizer inoculant products engineered for precision delivery. The EU's Farm to Fork strategy targets a 20% reduction in chemical fertilizer use by 2030, directly elevating demand for mycorrhizal inoculant technology and bacterial nitrogen fixers that can close yield gaps without chemical runoff [4]. Precision agriculture platforms now integrate variable-rate microbial placement with satellite-guided seeding equipment, improving per-hectare ROI by an estimated 12–18% over broadcast methods [5].

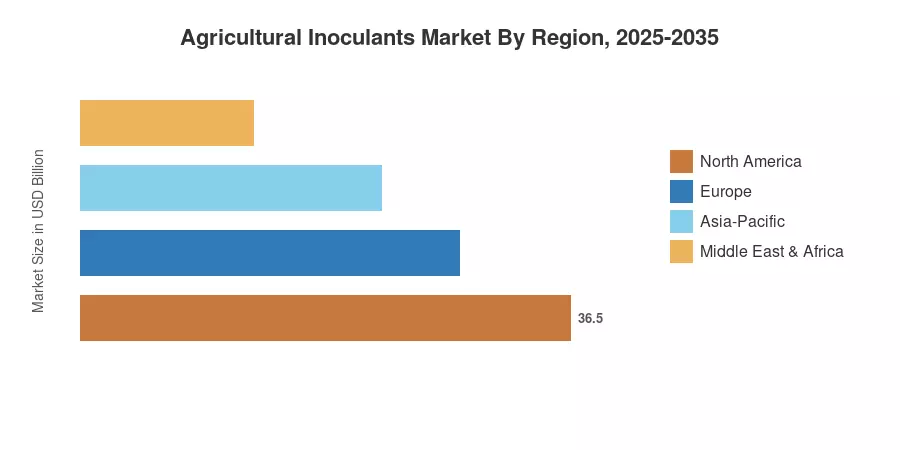
North America commands the largest share of the Agricultural Inoculants Market at approximately 35.1% of 2025 revenue, driven by soybean-dominant cropping systems and established dealer networks for soil microbiome enhancement products. Asia-Pacific is the fastest-growing region with a projected CAGR of 10.72% through 2035, fueled by India's biofertilizer subsidy programs and China's soil health restoration mandates. Europe holds the second-largest share at roughly 27%, anchored by organic farming expansion and tightening pesticide regulation


Key Report Takeaways

• By Function

  • Crop nutrition held the dominant position in the Agricultural Inoculants Market with 63.4% share in 2025, reflecting entrenched use of rhizobium nitrogen-fixing bacteria in legume production systems
  • Biocontrol agents are projected to advance at a 12.3% CAGR through 2035, propelled by integrated pest management mandates and resistance concerns around synthetic pesticides

• By Microorganism

  • Bacterial inoculants generated USD 8.49 billion in 2025 revenue, anchored by decades of field validation for microbial seed inoculants in soybean and pulse crops
  • Fungal inoculants — primarily mycorrhizal inoculant technology — are the fastest-growing segment at a 13.9% CAGR, expanding into horticultural and specialty crop applications

• By Mode of Application

  • Seed inoculation led with 60.8% share of the Agricultural Inoculants Market in 2025, favored for dosing precision and labor efficiency
  • Soil inoculation is projected to grow at a 13.5% CAGR through 2035 as granular and liquid soil-applied formulations gain traction in broadacre cereals

• By Crop Type

  • Cereals and grains accounted for 44.6% of demand in 2025
  • Fruits and vegetables represent the fastest-growing crop segment with an 11.8% CAGR, driven by premium pricing for residue-free produce

• By Region

  • North America captured 35.1% of the 2025 global revenue in the Agricultural Inoculants Market
  • Asia-Pacific is projected to post the highest regional CAGR at 10.72% through 2035, with India and China leading adoption of soil microbiome enhancement programs


Market Size and Forecast (2021–2035)

MRFR's forecast model integrates bottom-up revenue tracking from manufacturer shipments, distributor sell-through data, and regulatory filings across 42 countries. Historical figures (2021–2024) reflect actual reported revenues; the base year (2025) uses preliminary estimates; and the forecast horizon (2026–2035) applies the calibrated CAGR of 10.28% with adjustments for anticipated regulatory inflection points.

Market Size Chart
Our Impact
Enabled $4.3B Revenue Impact for Fortune 500 and Leading Multinationals
Partnering with 2000+ Global Organizations Each Year
30K+ Citations by Top-Tier Firms in the Industry
 

Driver Impact Analysis

Driver ~% Impact on CAGR Geographic Relevance Impact Timeline
Tightening synthetic fertilizer regulations ~2.1% EU, India, Brazil Short-term (≤2 yr)
Carbon-credit and regenerative agriculture programs ~1.8% North America, EU Medium-term (2–4 yr)
Precision agriculture integration for microbial placement ~1.5% North America, Asia-Pacific Medium-term (2–4 yr)
Venture funding for encapsulation and shelf-life platforms ~1.3% Global Short-term (≤2 yr)
Expanding seed-applied microbial consortia portfolios ~1.2% North America, South America Long-term (≥4 yr)
Government biofertilizer subsidy programs ~1.4% India, China, Brazil Short-term (≤2 yr)
Retailer sustainability audits and supply-chain traceability ~0.9% EU, North America Long-term (≥4 yr)


Tightening Synthetic Fertilizer Regulations

The EU's revised Fertilising Products Regulation (2019/1009), fully enforced from July 2022, created a unified legal pathway for biofertilizer inoculant products to access all 27 member states under a single CE mark. This replaced a patchwork of national registrations that had kept adoption below 8% of arable hectarage. India's Fertilizer Subsidy Rationalization Scheme, which redirected approximately USD 1.2 billion toward organic and biological inputs between 2023 and 2025, has made rhizobium nitrogen-fixing bacteria affordable for smallholder pulse farmers across Madhya Pradesh and Rajasthan [4][10].

Carbon-Credit and Regenerative Agriculture Programs

North American voluntary carbon markets — led by Indigo Ag's carbon program and Bayer's ForGround initiative — now compensate growers USD 15–30 per ton of CO₂ equivalent sequestered through cover cropping paired with microbial seed inoculants. By 2024, over 12 million acres in the U.S. Midwest were enrolled in programs that require documented inoculant use as a qualifying practice. The USDA's Partnerships for Climate-Smart Commodities allocated USD 3.1 billion to projects that explicitly include soil microbiome enhancement as a measurable outcome [6][12].

Precision Agriculture Integration

Variable-rate application technology now allows growers to adjust microbial seed inoculants dosing at sub-field resolution using soil sensor data, satellite imagery, and machine learning algorithms. John Deere's See & Spray platform and CNH Industrial's Raven autonomy stack both support inoculant-compatible liquid applicators. Field trials in Iowa and São Paulo state demonstrated 14% higher nodulation efficiency with GPS-guided rhizobium nitrogen-fixing bacteria placement compared to blanket application, translating to a USD 22 per hectare input cost reduction [5][13].

Venture Funding and Encapsulation Innovation

Between 2022 and 2025, ag-biotech startups attracted approximately USD 1.8 billion in venture funding directed at extending the shelf life and field viability of biofertilizer inoculant products. Encapsulation technologies — polymer coatings, alginate beads, and nano-carrier systems — have extended viable shelf life from 90 days to over 18 months for several commercial mycorrhizal inoculant technology products. Pivot Bio raised USD 430 million in cumulative funding through Series D to scale its in-furrow nitrogen-fixing microbe platform [3][14].


Restraints Impact Analysis

The restraint percentages below are directional negative-impact estimates. They are not subtracted from the CAGR and reflect headwinds that modulate — not define — net growth.

Restraint ~% Negative Impact Geographic Relevance Impact Timeline
Inconsistent regulatory approval pathways ~–1.4% Asia-Pacific, Africa Short-term (≤2 yr)
Limited shelf life of live microbial products ~–1.1% Global (tropical climates) Medium-term (2–4 yr)
Farmer awareness and adoption inertia ~–0.9% South Asia, Sub-Saharan Africa Long-term (≥4 yr)
Incompatibility with chemical seed treatments ~–0.8% North America, South America Medium-term (2–4 yr)
Strain efficacy variability across soil types ~–0.7% Global Long-term (≥4 yr)


Inconsistent Regulatory Approval Pathways

Many developing nations lack dedicated registration categories for microbial seed inoculants, forcing manufacturers to navigate pesticide or fertilizer frameworks ill-suited to living organisms. India's Central Insecticides Board does not cover biofertilizers, pushing registration to individual state agriculture departments — a process that can take 18–36 months per state. This fragmentation delays market entry and raises compliance costs by an estimated 25–30% relative to single-window systems in North America [15].

Limited Shelf Life and Cold-Chain Demands

Despite advances in encapsulation, a significant portion of biofertilizer inoculant products still requires cold-chain logistics to maintain colony-forming unit (CFU) counts above labeled guarantees. Tropical markets in Southeast Asia and West Africa experience field failure rates of 15–20% when products are stored above 35°C for extended periods. The cold-chain infrastructure gap adds approximately USD 0.80–1.20 per hectare to delivered product costs in regions where soil microbiome enhancement offers the greatest agronomic potential [14][16].

Farmer Awareness and Adoption Barriers

Smallholder farmers cultivating fewer than 2 hectares — who represent over 80% of farm holdings in South Asia and Sub-Saharan Africa — remain largely unfamiliar with inoculant application techniques. Extension service coverage for mycorrhizal inoculant technology and rhizobium nitrogen-fixing bacteria remains below 15% of eligible farmers in states like Bihar and Odisha, constraining the addressable market despite favorable subsidy environments [10].


Opportunities

Seed-Applied Multi-Species Consortia

The combined product benefits of rhizobium nitrogen-fixing bacteria, phosphorus-solubilizing bacteria and mycorrhizal fungi in single seed coatings provides a bundled value proposition that boosts growers’ willingness to pay by 20-35% over mono-strain goods. Companies such as Novozymes (now part of Novo Holdings’ biosolutions division) and BASF are funding consortia discovery pipelines that aim to identify synergistic strain combinations validated for numerous soil microbiome improvement criteria [9].


Emerging Markets — Africa and Southeast Asia

Agricultural Inoculants Market has a largely untapped addressable base: Arable land expansion in Sub-Saharan Africa is expected to reach 120 million more hectares by 2035. The African Development Bank’s Technologies for African Agricultural Transformation (TAAT) programme has granted USD 950 million to scale up biological inputs in 30 countries. In Southeast Asia, the Philippines and Indonesia are reworking fertilizer subsidies to provide biofertilizer inoculant products for rice paddy systems [10][17].


Data-Driven Microbial Recommendation Engines

Ag-data platforms are starting to monetise soil microbiome mapping by recommending microbial seed inoculant packages for specific fields. Companies like Pattern Ag and Trace Genomics are providing shotgun metagenomic soil profiling that diagnoses microbial deficiencies and correlates them with commercial inoculant strains. This data monetization layer might add a service fee of USD 2–4 per acre on top of product sales, establishing a recurring SaaS-adjacent business model for inoculant suppliers [18].


Organic and Regenerative Certification Premiums

Certified organic land increased 8.2% per year between 2020 and 2025 across North America and Europe, and organic certification requires the use of permitted biological inputs. The USDA NOP and EU organic standards allow for a few yield increasing techniques, such as mycorrhizal inoculant technology and rhizobium nitrogen fixing bacteria, positioning the Agricultural Inoculants Market to grab disproportionate part of high-margin organic input spending [19].


Integration with Carbon Measurement, Reporting, and Verification (MRV)

As carbon markets mature, inoculant manufacturers can partner with MRV platforms to quantify the soil carbon sequestration attributable to microbial inoculation. Verified carbon uplift data strengthens the grower's ROI case and creates a secondary revenue stream through carbon-credit stacking. Early pilots by Indigo Ag showed that microbial seed inoculants plus cover crops generated 0.4–0.7 tons CO₂e per acre in verified sequestration [6][12].


Future Outlook

AI-Guided Strain Discovery and Formulation

Machine learning is compressing microbial strain screening from multi-year greenhouse trials to months-long computational workflows. Platforms trained on metagenomic datasets can predict strain–soil–crop interactions with increasing accuracy, accelerating the pipeline for next-generation microbial seed inoculants. By 2030, AI-guided discovery is expected to double the commercial strain library for soil microbiome enhancement products [18][22].

Biologicals–Genetics Bundling and Platform Economics

Major seed companies — including Bayer, Corteva, and Syngenta — are integrating biofertilizer inoculant products directly into seed treatment packages sold as single-SKU bundles. This platform economics model raises switching costs for growers and consolidates the value chain. By 2028, MRFR estimates that over 40% of soybean seed sold in the Americas will include a pre-applied microbial seed inoculants component [9][23].

ESG Reporting and Scope 3 Agricultural Emissions

Corporate ESG mandates — including the EU's Corporate Sustainability Reporting Directive (CSRD) and the SEC's climate disclosure rules — are pushing food and beverage companies to quantify and reduce Scope 3 agricultural emissions. Mycorrhizal inoculant technology and rhizobium nitrogen-fixing bacteria reduce synthetic nitrogen dependency by 15–25%, directly lowering upstream emission intensity per ton of commodity produced [11][24].

Climate Adaptation and Stress-Tolerant Microbiomes

Rising climate volatility is driving demand for microbial products that confer abiotic stress tolerance — drought resilience, salinity tolerance, and heat-stress mitigation. Field trials in the Indo-Gangetic Plains showed that stress-selected rhizobial strains maintained 85% of nodulation activity under 40°C soil temperatures, compared to 52% for conventional inoculants. The Agricultural Inoculants Market will increasingly bifurcate between commodity nitrogen fixers and premium climate-adapted soil microbiome enhancement formulations [16][20].


Market Segmentation

By Function

Segment Key Metric Primary Demand Driver
Crop Nutrition 63.4% share (2025) Nitrogen fixation and phosphorus solubilization in staple crops
Biocontrol Agents 12.3% CAGR (2026–2035) IPM mandates and pesticide resistance management


The Agricultural Inoculants Market is anchored by crop nutrition products, with rhizobium nitrogen-fixing bacteria for legumes representing the largest single product category. Crop nutrition inoculants reduce synthetic nitrogen input requirements by 40–80 kg/ha in soybean systems, delivering direct input-cost savings that underpin consistent demand. Biocontrol agents — particularly Trichoderma and Bacillus-based formulations — are gaining share rapidly as integrated pest management frameworks tighten across Europe and Asia-Pacific, displacing older chemical fungicide applications [4][9].

By Microorganism

Segment Key Metric Primary Demand Driver
Bacteria USD 8.49 Billion (2025) Established rhizobium and Azotobacter platforms for broadacre crops
Fungi 13.9% CAGR (2026–2035) Mycorrhizal inoculant technology for horticulture and specialty crops
Other Microorganisms USD 0.38 Billion (2025) Algal biostimulants and actinomycete-based products


Bacterial inoculants dominate the Agricultural Inoculants Market due to decades of validated efficacy in legume nitrogen fixation. Fungal products — led by arbuscular mycorrhizal fungi (AMF) — are the fastest-growing category, expanding beyond traditional forestry nursery applications into row crops and high-value vegetables. Mycorrhizal inoculant technology extends root phosphorus uptake zones by up to 40-fold, a benefit increasingly quantified via soil microbiome enhancement analytics platforms [5][16].

By Mode of Application

Segment Key Metric Primary Demand Driver
Seed Inoculation 60.8% share (2025) Precision dosing; compatibility with planter-applied seed treatments
Soil Inoculation 13.5% CAGR (2026–2035) Granular and liquid in-furrow products for non-legume crops


Seed inoculation retains the majority share of the Agricultural Inoculants Market because it integrates seamlessly into existing planting workflows. Growers apply microbial seed inoculants at the seed treatment stage, ensuring direct rhizosphere contact at emergence. Soil inoculation is growing faster as manufacturers develop granular and liquid biofertilizer inoculant products suited to cereals and oilseeds where seed-coat real estate is already occupied by fungicide and insecticide treatments [9][13].

By Crop Type

Segment Key Metric Primary Demand Driver
Cereals and Grains 44.6% share (2025) Wheat, rice, and maize acreage volume
Pulses and Oilseeds USD 3.28 Billion (2025) Soybean rhizobium dominance in Americas
Fruits and Vegetables 11.8% CAGR (2026–2035) Residue-free certification and premium pricing
Other Crops USD 0.72 Billion (2025) Sugarcane, cotton, and turf applications


Cereals and grains lead the Agricultural Inoculants Market by crop type because wheat, rice, and maize collectively cover over 500 million hectares globally. Non-leguminous cereal inoculants — including free-living nitrogen fixers like Azospirillum and phosphorus-solubilizing bacteria — are expanding rapidly. The fruits and vegetables segment commands premium pricing, with growers paying 2–3x per-hectare rates for mycorrhizal inoculant technology tailored to berry, citrus, and vine crops [21][23].


Regional Market Share Analysis

Region Key Metric Primary Investment Themes
North America 35.1% share (2025) Soybean inoculant saturation; carbon-credit integration
Europe 27.0% share (2025) Organic farming mandates; pesticide reduction targets
Asia-Pacific 10.72% CAGR (2026–2035) Government subsidy programs; rice and pulse inoculation
South America USD 2.15 Billion (2025) Soybean expansion; tropical soil health restoration
Middle East & Africa 11.38% CAGR (2026–2035) TAAT program; arable land expansion
Total USD 11.92 Billion (2025)  

The Agricultural Inoculants Market shows distinct regional dynamics shaped by cropping systems, regulatory environments, and soil microbiome enhancement adoption maturity. North America and Europe together account for over 62% of 2025 revenue, while Asia-Pacific and South America are the primary growth frontiers.


North America

Country Key Metric Key Driver
US 72.4% of regional share Soybean and corn belt inoculant penetration
Canada USD 0.87 Billion (2025) Pulse crop exports driving rhizobium demand
Mexico 9.8% CAGR (2026–2035) Smallholder biofertilizer adoption programs


The U.S. dominates the Agricultural Inoculants Market in North America, with established distribution through ag retailers such as Nutrien and GROWMARK. The USDA's Climate-Smart Commodities initiative has created direct financial incentives for microbial seed inoculants use, and the Inflation Reduction Act's conservation provisions allocate over USD 19 billion to soil health practices through 2031. Canada's pulse crop sector — the world's largest lentil and pea exporter — sustains high-volume demand for rhizobium nitrogen-fixing bacteria, while Mexico's expanding avocado and berry sectors are beginning to adopt mycorrhizal inoculant technology for export-quality produce [6][7].

Europe

Country Key Metric Key Driver
Germany 22.1% of regional share Organic farmland expansion targets
UK USD 0.48 Billion (2025) Post-Brexit ELMS soil health payments
France 18.6% of regional share Ecophyto II+ pesticide reduction plan
Italy 8.7% CAGR (2026–2035) High-value horticulture adoption
Spain USD 0.31 Billion (2025) Mediterranean vegetable production
Nordic Countries 9.2% CAGR (2026–2035) Cold-tolerant strain development
Russia USD 0.22 Billion (2025) Import substitution policies
Rest of Europe 7.8% CAGR (2026–2035) EU-wide Green Deal compliance


Europe's regulatory architecture is among the most favorable globally for biofertilizer inoculant products. The Farm to Fork strategy's 20% chemical fertilizer reduction target by 2030 is now codified in national action plans across 22 member states. France's Ecophyto II+ program has cut neonicotinoid use by 35% since 2020, creating substitution demand for biocontrol-grade microbial seed inoculants in rapeseed and sunflower [4][11].

Asia-Pacific

Country Key Metric Key Driver
China 28.3% of regional share Soil health restoration mandates; zero-growth fertilizer policy
India 11.54% CAGR (2026–2035) National biofertilizer subsidy expansion
Japan USD 0.29 Billion (2025) Sustainable agriculture certification programs
South Korea 9.1% CAGR (2026–2035) Organic transition subsidies
ASEAN 12.1% CAGR (2026–2035) Rice paddy inoculant adoption
Rest of Asia-Pacific USD 0.18 Billion (2025) Emerging pulse and oilseed production


Asia-Pacific represents the fastest-growing region for the Agricultural Inoculants Market, propelled by China's zero-growth fertilizer use policy launched in 2015 and extended through 2030. India's biofertilizer production capacity expanded from 380,000 MT in 2020 to an estimated 520,000 MT in 2025, supported by the Paramparagat Krishi Vikas Yojana (PKVY) organic farming scheme. Soil microbiome enhancement programs are now integrated into India's Soil Health Card initiative, which has issued over 230 million cards to date [10][20].

South America

Country Key Metric Key Driver
Brazil 68.7% of regional share World's largest soybean inoculant consumer
Argentina USD 0.42 Billion (2025) Soybean and wheat dual-inoculation programs
Rest of South America 10.4% CAGR (2026–2035) Expanding pulse production in Paraguay and Bolivia


Brazil's soybean production system — exceeding 160 million metric tons annually — is the single largest end market for rhizobium nitrogen-fixing bacteria globally. Embrapa's research programs have documented average yield responses of 8–12% from high-quality inoculants, and Brazilian growers now treat over 90% of soybean seed area with at least one inoculant application [3][21].

Middle East & Africa

Country Key Metric Key Driver
Saudi Arabia USD 0.07 Billion (2025) Protected agriculture and greenhouse inoculant use
UAE 12.8% CAGR (2026–2035) Food security investment programs
South Africa 34.2% of regional share Commercial maize and soybean farms
Egypt 10.6% CAGR (2026–2035) Nile Delta soil salinity remediation
Rest of MEA USD 0.19 Billion (2025) TAAT biological inputs scaling


The Middle East & Africa region, while the smallest in absolute terms, posts the highest combined CAGR for the Agricultural Inoculants Market at 11.38%. The AfDB's TAAT program is deploying biofertilizer inoculant products across maize, rice, and cassava systems in Nigeria, Kenya, and Tanzania, targeting 40 million farming households by 2030 [17].


Regional Market Share
 

Competitive Benchmarking

The Agricultural Inoculants Market exhibits medium concentration, with the top five players accounting for an estimated 38–44% of global revenue. The HHI index sits in the 600–900 range, reflecting a mix of multinational crop-science firms and specialist biologicals companies. Competitive intensity has escalated since 2022 as scale players acquire regional rhizobium nitrogen-fixing bacteria specialists to secure proprietary strain libraries and distribution reach.

Company Est. Revenue Share Range Key Offerings for Agricultural Inoculants Market Strategic Positioning
BASF SE ~7–10% Vault HP, Nodulator PRO; Bacillus biocontrol lines Integrated crop protection + biologicals bundling
Corteva Agriscience ~6–9% Utrisha N, proprietary nitrogen-fixing platform Seed-treatment-first biological strategy
UPL Limited ~5–8% NPK consortium inoculants; Arysta biological range Emerging market distribution strength in India, LatAm
Novozymes / Novo Holdings ~5–7% Optimize ST, TagTeam; mycorrhizal products Fermentation scale and enzyme/microbe R&D depth
Verdesian Life Sciences ~4–6% Midrise, Envita corn nitrogen fixer U.S. specialty biologicals focus
Rizobacter ~3–5% Rizoliq Top, seed-applied rhizobium lines Latin American soybean inoculant leader
ABM (Advanced Biological Marketing) ~2–4% Excalibre SA, mycorrhizal granular products Regional U.S. specialty crop focus
Lallemand Plant Care ~2–4% Lalsil, Raise line of microbial inoculants Fermentation and yeast-platform diversification
Groundwork BioAg ~1–3% Mycorrhizal inoculant technology for broadacre Australia/NZ specialty; carbon-credit positioning
Pivot Bio ~1–3% PROVEN, in-furrow nitrogen-fixing microbes for corn Venture-backed biotech disruptor


Recent News & Developments

  • BASF (September 2024): Acquired a proprietary Trichoderma strain library from a Brazilian biologicals startup, expanding its biocontrol portfolio for the Agricultural Inoculants Market in South America [Ref 9].
  • Corteva Agriscience (June 2024): Received EPA registration for Utrisha N on additional row crop labels including winter wheat, broadening microbial seed inoculants applications beyond corn [Ref 23].
  • Pivot Bio (March 2024): Closed USD 95 million in Series E funding to scale PROVEN production capacity at its Iowa fermentation facility, targeting 10 million corn acres by 2026 [Ref 14].
  • Indian Ministry of Agriculture (January 2025): Expanded the Paramparagat Krishi Vikas Yojana budget by 28%, allocating INR 3,200 crore for biofertilizer inoculant products distribution to smallholders [Ref 10].
  • EU Commission (November 2024): Published updated standards under the Fertilising Products Regulation for microbial plant biostimulants, harmonizing CFU labeling across member states [Ref 4].
  • UPL Limited (August 2023): Launched an integrated biologicals platform across 12 African markets under the TAAT partnership, deploying rhizobium nitrogen-fixing bacteria for cowpea and soybean [Ref 17].
  • Novozymes (May 2023): Signed a multi-year co-development agreement with a precision agriculture data company to optimize variable-rate mycorrhizal inoculant technology recommendations [Ref 18].


Report Scope

Parameter Detail
Market Scope Global Agricultural Inoculants Market — crop nutrition and biocontrol inoculants across all crop types
Study Period 2021–2035
CAGR Window 2026–2035 (10.28%)
Market Size (2025) USD 11.92 Billion
Market Size (2035) USD 29.18 Billion
Fastest Growing Segment Fungal inoculants (13.9% CAGR); Asia-Pacific (10.72% CAGR)
Companies Profiled 10 (BASF, Corteva, UPL, Novozymes, Verdesian, Rizobacter, ABM, Lallemand, Groundwork BioAg, Pivot Bio)
Valuation Currency USD Billion


FAQs

How do live microbial inoculants remain viable during long-distance supply chains?

Modern encapsulation systems — including polymer coatings and lyophilization — extend shelf life to 18+ months under ambient storage. Cold-chain requirements have been largely eliminated for premium formulations [Ref 14].

Can rhizobium inoculants be tank-mixed with chemical seed treatments without efficacy loss?

Compatibility depends on the active ingredient; neonicotinoids and certain fungicides reduce CFU viability by 30–60%. Manufacturers now offer chemical-tolerant strains validated through standardized compatibility protocols [Ref 9].

What ROI can growers expect from switching to mycorrhizal inoculants in vegetable production?

Field trials across Mediterranean and California systems show 15–22% yield improvements in tomato and pepper. Input costs of USD 12–18 per hectare typically deliver a 3:1 return within one season [Ref 21].

How do carbon-credit programs compensate growers for using microbial seed inoculants?

Voluntary markets pay USD 15–30 per ton CO₂e sequestered when inoculant use is paired with cover cropping and reduced tillage. Documentation through MRV platforms is required [Ref 6].

Which registration pathway applies to agricultural inoculants in the EU after 2022?

The Fertilising Products Regulation (2019/1009) provides a unified CE-mark pathway for microbial biostimulants. Manufacturers submit a single dossier instead of navigating 27 national systems [Ref 4].

How does variable-rate inoculant application improve per-hectare economics for the Agricultural Inoculants Market?

GPS-guided applicators adjust dosing to match soil microbial deficits mapped via metagenomic profiling. Trials show 14% higher nodulation efficiency and USD 22/ha savings versus blanket application [Ref 5].

What distinguishes the competitive strategies of venture-backed startups from incumbent crop-science firms in the Agricultural Inoculants Market?

Startups like Pivot Bio focus on single proprietary organisms for major row crops, while incumbents bundle microbial seed inoculants into multi-product seed treatment platforms. Incumbents leverage distribution; startups leverage IP novelty [Ref 14].


Author
Author
Author Profile
Snehal Singh LinkedIn
Manager - Research
High acumen in analyzing complex macro & micro markets with more than 6 years of work experience in the field of market research. By implementing her analytical skills in forecasting and estimation into market research reports, she has expertise in Packaging, Construction, and Equipment domains. She handles a team size of 20-25 resources and ensures smooth running of the projects, associated marketing activities, and client servicing.
Co-Author
Co-Author Profile
Varsha More LinkedIn
Senior Research Analyst
Experienced business professional with a demonstrated history of working in the CFnB industry. Skilled in market research, and market estimation. Strong professional with a Masters focused in marketing management.

Research Approach


Secondary Research

The secondary research process involved comprehensive analysis of agri-regulatory databases, peer-reviewed agronomy journals, soil science publications, and authoritative agricultural organizations. Key sources included the US Environmental Protection Agency (EPA) Biopesticide Registration Database, US Department of Agriculture (USDA) National Agricultural Statistics Service (NASS), European Food Safety Authority (EFSA), Health Canada Pest Management Regulatory Agency (PMRA), Food and Agriculture Organization (FAO) of the United Nations, CGIAR research centers (CIMMYT, IITA, ICARDA), International Institute of Tropical Agriculture (IITA), International Society for Agricultural Engineering (CIGR), Biological Products Industry Alliance (BPIA), International Biocontrol Manufacturers' Association (IBMA), International Federation of Organic Agriculture Movements (IFOAM), CropLife International, Agricultural and Environmental Science Journals (Elsevier), Applied Soil Ecology (Springer), Soil Biology and Biochemistry, Journal of Applied Microbiology, national agricultural ministry reports from Brazil (MAPA), India (ICAR/DAC&FW), Argentina (SENASA), EU Directorate-General for Agriculture (DG AGRI), and Eurostat Agricultural Database. Organic farming acreage statistics, biofertilizer adoption rates, microbial strain registration data, crop yield studies, and regulatory frameworks for nitrogen-fixing bacteria, phosphate-solubilizing microbes, arbuscular mycorrhizal fungi, and biocontrol inoculants were gathered using these sources.


Primary Research

In the primary research process, supply-side and demand-side stakeholders were interviewed to obtain qualitative and quantitative insights. Supply-side sources included CEOs, VPs of Biological R&D, Global Regulatory Affairs Managers, and Commercial Directors from agricultural inoculant manufacturers, microbial strain developers, and seed treatment technology providers. Demand-side sources comprised agronomists, large-scale row-crop farmers, organic farming cooperative managers, chief crop protection officers, seed treatment facility managers, and procurement leads from agricultural distributors and farm input retailers. Primary research validated market segmentation, confirmed microbial pipeline development timelines, and gathered insights on crop-specific adoption patterns, farmer pricing sensitivity, and distribution channel dynamics.

Primary Respondent Breakdown:

By Designation: C-level Primaries (32%), Director Level (30%), Others (38%)

By Region: North America (32%), Europe (23%), Asia-Pacific (35%), Rest of World (10%)


Market Size Estimation

Revenue mapping and treated hectare analysis were employed to determine the global market valuation. The methodology comprised the following:

Identification of over 50 key manufacturers in North America, South America (Mercosur), Europe, Asia-Pacific, and Africa/Middle East

Product mapping for the categories of nitrogen-fixing bacteria, phosphate-solubilizing microorganisms, potassium-mobilizing bacteria, biocontrol agents, and mycorrhizal fungi Analysis of annual revenues that are specific to agricultural inoculant portfolios (soil and seed treatment applications) as reported and modeled

Manufacturers that account for 75-80% of the global market share in 2024 are included in the coverage.

Extrapolation is employed to determine segment-specific valuations and regional penetration rates by combining bottom-up (treated hectares × ASP by crop type/region) and top-down (manufacturer revenue validation) methods.

Download Free Sample

Kindly complete the form below to receive a free sample of this Report