Air Taxi Market (2026 - 2035)

ID: MRFR/AT/12455-HCR
128 Pages
Shubham Munde
Last Updated: August 05, 2026
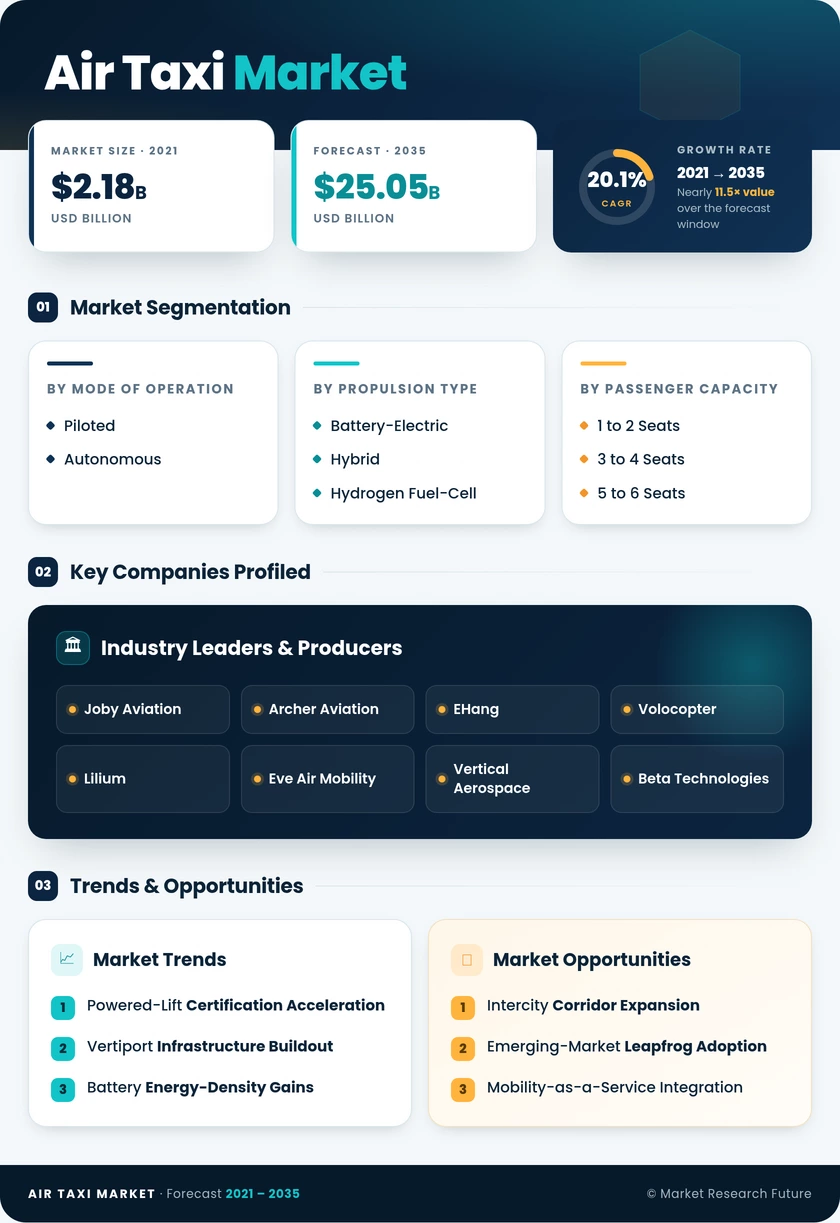
Air Taxi Market Research Report By Mode of Operation (Piloted, Autonomous), By Propulsion Type (Battery-Electric, Hybrid, Turboshaft, Hydrogen Fuel-Cell), By Passenger Capacity (1 to 2 Seats, 3 to 4 Seats, 5 to 6 Seats, More than 6 Seats), By Range (Intracity (≤300 km)), By End-Use (Airport Shuttle, Corporate Shuttle, Tourism & Charter, Emergency Medical, On-Demand Air Taxi), By Lift Technology (Multicopter, Lift-plus-Cruise, Tilt-Rotor, Tilt-Wing) and By Regional (North America, Europe, South America, Asia Pacific, Middle East and Africa) - Forecast to 2035
Air Taxi Market
Market Size
Forecast Period2026-2035
CAGR (2026-2035)20.1%
2021 Market Size4.05 USD Billion
2024 Market Size4.82 USD Billion
Key Players
Joby Aviation
Archer Aviation
EHang
Volocopter
Lilium
Eve Air Mobility
Opportunities
  • Intercity Corridor Expansion
  • Emerging-Market Leapfrog Adoption
  • Mobility-as-a-Service Integration
  1. 1 Market Overview |
    1. 1.1 Study Assumptions & Market Definition |
    2. 1.2 Scope of the Study |
    3. 1.3 Research Methodology
  2. 2 Market Summary & Key Takeaways
  3. 3 Market Dynamics |
    1. 3.1 Market Drivers Analysis | |
      1. 3.1.1 FAA / EASA Powered-Lift Certification Frameworks | |
      2. 3.1.2 Public-Private Vertiport Infrastructure Investment | |
      3. 3.1.3 Battery Energy-Density Improvements | |
      4. 3.1.4 Airline Route Commitment Acceleration | |
      5. 3.1.5 China Low-Altitude Economy National Initiative | |
      6. 3.1.6 Autonomous Flight Software Maturation | |
      7. 3.1.7 Carbon-Reduction Mandates in Aviation |
    2. 3.2 Market Restraints Analysis | |
      1. 3.2.1 Airspace Integration Complexity | |
      2. 3.2.2 Battery Supply-Chain Bottlenecks | |
      3. 3.2.3 Public Acceptance and Noise Concerns | |
      4. 3.2.4 High Per-Seat-Mile Cost vs. Ground Transport | |
      5. 3.2.5 Insurance and Liability Framework Gaps |
    3. 3.3 Market Opportunity Analysis | |
      1. 3.3.1 Intercity Corridor Expansion | |
      2. 3.3.2 Emerging-Market Leapfrog Adoption | |
      3. 3.3.3 Mobility-as-a-Service Integration | |
      4. 3.3.4 Fleet Data Monetization | |
      5. 3.3.5 Cargo and Medical-Logistics Extension |
    4. 3.4 Industry Value Chain Analysis |
    5. 3.5 Porter's Five Forces Analysis
  4. 4 Global Air Taxi Market Size & Forecast (2021–2035) |
    1. 4.1 Historical Market Size (2021–2025) |
    2. 4.2 Current & Forecast Market Size (2026–2035) |
    3. 4.3 Market Size by Revenue (USD Billion) |
    4. 4.4 Year-over-Year Growth Analysis
  5. 5 Segmentation Analysis |
    1. 5.1 By Mode of Operation | |
      1. 5.1.1 Piloted | |
      2. 5.1.2 Autonomous |
    2. 5.2 By Propulsion Type | |
      1. 5.2.1 Battery-Electric | |
      2. 5.2.2 Hybrid | |
      3. 5.2.3 Turboshaft | |
      4. 5.2.4 Hydrogen Fuel-Cell |
    3. 5.3 By Passenger Capacity | |
      1. 5.3.1 1 to 2 Seats | |
      2. 5.3.2 3 to 4 Seats | |
      3. 5.3.3 5 to 6 Seats | |
      4. 5.3.4 More than 6 seats |
    4. 5.4 By Range | |
      1. 5.4.1 Intracity ( 300 km) |
    5. 5.5 By End-Use | |
      1. 5.5.1 Airport Shuttle | |
      2. 5.5.2 Corporate Shuttle | |
      3. 5.5.3 Tourism & Charter | |
      4. 5.5.4 Emergency Medical | |
      5. 5.5.5 On- Demand Air Taxi |
    6. 5.6 By Lift Technology | |
      1. 5.6.1 Multicopter | |
      2. 5.6.2 Lift-plus-Cruise | |
      3. 5.6.3 Tilt-Rotor | |
      4. 5.6.4 Tilt-Wing
  6. 6 Regional Analysis |
    1. 6.1 North America | |
      1. 6.1.1 United States | |
      2. 6.1.2 Canada | |
      3. 6.1.3 Mexico |
    2. 6.2 Europe | |
      1. 6.2.1 Germany | |
      2. 6.2.2 United Kingdom | |
      3. 6.2.3 France | |
      4. 6.2.4 Italy | |
      5. 6.2.5 Spain | |
      6. 6.2.6 Nordic Countries | |
      7. 6.2.7 Russia | |
      8. 6.2.8 Rest of Europe |
    3. 6.3 Asia-Pacific | |
      1. 6.3.1 China | |
      2. 6.3.2 India | |
      3. 6.3.3 Japan | |
      4. 6.3.4 South Korea | |
      5. 6.3.5 ASEAN | |
      6. 6.3.6 Rest of Asia-Pacific |
    4. 6.4 South America | |
      1. 6.4.1 Brazil | |
      2. 6.4.2 Argentina | |
      3. 6.4.3 Rest of South America |
    5. 6.5 Middle East & Africa | |
      1. 6.5.1 Saudi Arabia | |
      2. 6.5.2 UAE | |
      3. 6.5.3 South Africa | |
      4. 6.5.4 Egypt | |
      5. 6.5.5 Rest of MEA
  7. 7 Competitive Landscape |
    1. 7.1 Market Share Analysis (2025) |
    2. 7.2 Competitive Benchmarking Matrix |
    3. 7.3 Company Profiles | |
      1. 7.3.1 Joby Aviation | |
      2. 7.3.2 Archer Aviation | |
      3. 7.3.3 EHang | |
      4. 7.3.4 Volocopter | |
      5. 7.3.5 Lilium | |
      6. 7.3.6 Eve Air Mobility | |
      7. 7.3.7 Vertical Aerospace | |
      8. 7.3.8 Beta Technologies | |
      9. 7.3.9 Wisk Aero | |
      10. 7.3.10 SkyDrive
  8. 8 Future Outlook & Strategic Recommendations (2026–2035) |
    1. 8.1 Autonomous Operations and AI-Driven Flight Management |
    2. 8.2 Platform Economics and Network Effects |
    3. 8.3 Electrification and Next-Generation Powertrains |
    4. 8.4 ESG Alignment and Carbon-Credit Revenue
  9. 9 Recent Developments & News
  10. 10 Frequently Asked Questions (FAQs)
  11. 11 Report Scope & Methodology |
    1. 11.1 Study Period & Base Year |
    2. 11.2 Data Sources & Citations |
    3. 11.3 Abbreviations
  12. 12 LIST OF TABLES |
  13. TABLE 1 Global Air Taxi Market Size & Forecast, by Revenue (USD Billion), 2021–2035 |
  14. TABLE 2 Global Air Taxi Market – Year-over-Year Growth Analysis, 2021–2035 |
  15. TABLE 3 Global Air Taxi Market – Driver Impact Analysis, 2026–2035 |
  16. TABLE 4 Global Air Taxi Market – Restraint Impact Analysis, 2026–2035 |
  17. TABLE 5 Global Air Taxi Market Size, by Mode of Operation, 2021–2035 (USD Billion) |
  18. TABLE 6 Global Air Taxi Market Size, by Propulsion Type, 2021–2035 (USD Billion) |
  19. TABLE 7 Global Air Taxi Market Size, by Passenger Capacity, 2021–2035 (USD Billion) |
  20. TABLE 8 Global Air Taxi Market Size, by Range, 2021–2035 (USD Billion) |
  21. TABLE 9 Global Air Taxi Market Size, by End-Use, 2021–2035 (USD Billion) |
  22. TABLE 10 Global Air Taxi Market Size, by Lift Technology, 2021–2035 (USD Billion) |
  23. TABLE 11 Global Air Taxi Market Size, by Region, 2021–2035 (USD Billion) |
  24. TABLE 12 North America Air Taxi Market Size, by Country, 2021–2035 (USD Billion) |
  25. TABLE 13 Europe Air Taxi Market Size, by Country, 2021–2035 (USD Billion) |
  26. TABLE 14 Asia-Pacific Air Taxi Market Size, by Country, 2021–2035 (USD Billion) |
  27. TABLE 15 South America Air Taxi Market Size, by Country, 2021–2035 (USD Billion) |
  28. TABLE 16 Middle East & Africa Air Taxi Market Size, by Country, 2021–2035 (USD Billion) |
  29. TABLE 17 Competitive Benchmarking Matrix – Global Air Taxi Market, 2025 |
  30. TABLE 18 Company Profiles – Key Players, Global Air Taxi Market |
  31. TABLE 19 Recent Developments & Strategic Announcements, 2024–2025 |
  32. TABLE 20 Report Scope & Methodology Summary |
  33. TABLE 21 Detailed Sources and Citations
  34. 13 LIST OF FIGURES |
  35. FIGURE 1 Global Air Taxi Market Dynamics — Drivers, Restraints, and Opportunities |
  36. FIGURE 2 Air Taxi Market Industry Value Chain Analysis |
  37. FIGURE 3 Porter's Five Forces Analysis — Global Air Taxi Market |
  38. FIGURE 4 Global Air Taxi Market Size & Trend, 2021–2035 (USD Billion) |
  39. FIGURE 5 Global Air Taxi Market Share, by Mode of Operation, 2025 (%) |
  40. FIGURE 6 Global Air Taxi Market Share, by Propulsion Type, 2025 (%) |
  41. FIGURE 7 Global Air Taxi Market Share, by Passenger Capacity, 2025 (%) |
  42. FIGURE 8 Global Air Taxi Market Share, by Range, 2025 (%) |
  43. FIGURE 9 Global Air Taxi Market Share, by End-Use, 2025 (%) |
  44. FIGURE 10 Global Air Taxi Market Share, by Lift Technology, 2025 (%) |
  45. FIGURE 11 Global Air Taxi Market Share, by Region, 2025 (%) |
  46. FIGURE 12 North America Air Taxi Market Share, by Country, 2025 (%) |
  47. FIGURE 13 Europe Air Taxi Market Share, by Country, 2025 (%) |
  48. FIGURE 14 Asia-Pacific Air Taxi Market Share, by Country, 2025 (%) |
  49. FIGURE 15 South America Air Taxi Market Share, by Country, 2025 (%) |
  50. FIGURE 16 Middle East & Africa Air Taxi Market Share, by Country, 2025 (%) |
  51. FIGURE 17 Competitive Landscape — Global Air Taxi Market, 2025

Segmentation Quick Reference

DimensionSub-SegmentsDominant SegmentFastest Growing Segment
Mode of OperationPiloted, AutonomousPilotedAutonomous
Propulsion TypeBattery-Electric, Hybrid, Hydrogen Fuel-CellBattery-ElectricHydrogen Fuel-Cell
Passenger Capacity1 to 2 Seats, 3 to 4 Seats, 5 to 6 Seats3 to 4 Seats5 to 6 Seats
RangeIntracity, Short Intercity, Regional, ExtendedIntracity (< 50 km)Regional (150–300 km)
End-UseAirport Shuttle, Corporate Shuttle, Tourism & Charter, Emergency MedicalAirport ShuttleCorporate Shuttle
Lift TechnologyMulticopter, Lift-plus-Cruise, Tilt-Rotor, Tilt-WingMulticopterLift-plus-Cruise


Market Segmentation Overview

By Mode of Operation

Sub-SegmentKey Trend
PilotedDominant through 2030 as regulatory agencies mandate human-piloted configurations for initial commercial operations
AutonomousAccelerating post-2031 as detect-and-avoid systems mature and regulators approve remotely supervised corridors


Piloted aircraft continue to anchor the Air Taxi Market because certification bodies require onboard pilots for inaugural commercial routes. As autonomous software accumulates certified flight hours and public confidence grows, the transition toward remotely monitored and fully autonomous operations will reshape fleet economics.

By Propulsion Type

Sub-SegmentKey Trend
Battery-ElectricDominates intracity routes with zero direct emissions and lowest maintenance overhead
HybridServes as a bridge powertrain for 120–250 km intercity corridors
Hydrogen Fuel-CellTargets routes exceeding 300 km where battery weight penalties become prohibitive


Battery-electric platforms define the current Air Taxi Market production pipeline, benefiting from established lithium-ion supply chains and declining cell costs. Hydrogen fuel-cell variants represent the highest-growth frontier, particularly for regional corridors where energy density requirements exceed practical battery limits.

By Passenger Capacity

Sub-SegmentKey Trend
1 to 2 SeatsNiche applications including pilot training and personal air vehicles
3 to 4 SeatsPreferred configuration for high-frequency airport and commuter shuttle services
5 to 6 SeatsGrowing adoption in corporate and premium group transport


The 3-to-4-seat layout remains the industry standard for early commercial routes, balancing payload efficiency with airframe simplicity. Larger 5-to-6-seat designs are gaining traction for corporate shuttle and premium tourism applications where higher per-trip revenue justifies the larger airframe investment.

By Range

Sub-SegmentKey Trend
Intracity (< 50 km)Core use case for airport-to-CBD and intra-metropolitan shuttle services
Short Intercity (50–150 km)Expanding as battery range improves beyond 120 km single-charge thresholds
Regional (150–300 km)Fastest-growing segment driven by hybrid and fuel-cell powertrain maturation
Extended (> 300 km)Early-stage development targeting thin regional airline routes


Intracity legs represent the foundational revenue base for the Air Taxi Market, with airport shuttle and CBD connector routes offering the highest utilization rates. The regional segment is poised for the steepest growth as next-generation powertrains make 150-to-300 km corridors economically viable.

By End-Use

Sub-SegmentKey Trend
Airport ShuttleLargest revenue segment anchored by fixed-route, predictable-demand operations
Corporate ShuttleFastest growth driven by time-sensitive executive and enterprise transport
Tourism & CharterPremium pricing supports early unit-level profitability in resort and scenic markets
Emergency MedicalGrowing adoption for organ transport and critical-patient airlift


Airport shuttle services provide the highest-volume demand floor for the Air Taxi Market, with routes between city centers and major airports operating on 10-to-15-minute headways during peak hours. Corporate shuttle services are scaling fastest as enterprises seek to reduce executive travel time across congested metropolitan corridors.

By Lift Technology

Sub-SegmentKey Trend
MulticopterSimplest architecture; dominant in hover-intensive intracity routes
Lift-plus-CruiseSuperior cruise efficiency for intercity corridors; fastest growth trajectory
Tilt-RotorMilitary-crossover technology with strong VTOL-to-cruise transition performance
Tilt-WingEmerging designs offering aerodynamic advantages in longer-range profiles


Multicopter architectures lead the current Air Taxi Market production cycle due to mechanical simplicity and precise hover control. Lift-plus-cruise airframes — which use separate lift rotors and a pusher propeller — deliver significantly better cruise efficiency on routes beyond 50 km, positioning them as the fastest-growing lift-technology segment through 2035.


 

Download PDF ×

We do not share your information with anyone. However, we may send you emails based on your report interest from time to time. You may contact us at any time to opt-out.