Segmentation Quick Reference
| Dimension | Sub-Segments | Dominant Segment | Fastest Growing Segment |
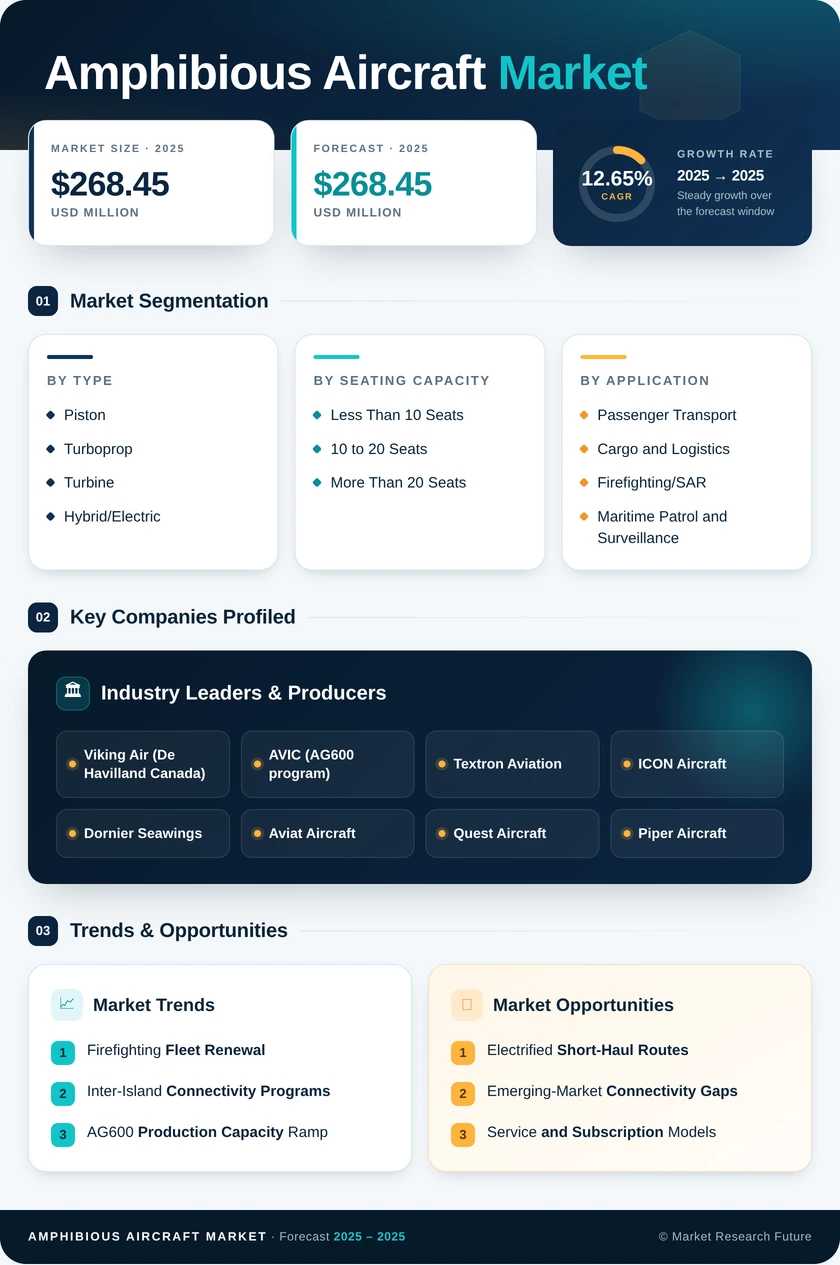
| By Engine Type | Piston, Turboprop, Turbine, Hybrid/Electric | Turboprop | Hybrid/Electric |
| By Seating Capacity | Less Than 10 Seats, 10 to 20 Seats, More Than 20 Seats | Less Than 10 Seats | More Than 20 Seats |
| By End Use | Passenger Transport, Cargo and Logistics, Firefighting/SAR, Maritime Patrol and Surveillance | Passenger Transport | Firefighting/SAR |
| By Geography | North America, Europe, Asia-Pacific, South America, Middle East & Africa | North America | Asia-Pacific |
Market Segmentation Overview
By Engine Type
| Sub-Segment | Key Trend |
| Piston | Stable demand from light recreational and training aircraft |
| Turboprop | Preferred platform for utility and firefighting missions |
| Turbine | Concentrated in heavy-lift patrol and fire-response roles |
| Hybrid/Electric | Fastest-growing class of electrified demonstrators reaches certification |
Engine type remains the most strategically significant segmentation lens for the amphibious aircraft Market. Turboprop platforms hold the dominant position on proven reliability, while hybrid/electric propulsion attracts rising investment as operators pursue lower operating costs on short routes.
By Seating Capacity
| Sub-Segment | Key Trend |
| Less Than 10 Seats | Anchored by bush operations and small-charter demand |
| 10 to 20 Seats | Tied to regional inter-island passenger growth |
| More Than 20 Seats | Expanding fastest in firefighting and high-density payloads |
Seating capacity segmentation reflects how mission profiles shape airframe choice. Smaller aircraft dominate the amphibious aircraft Market through versatility, while larger variants grow quickest as firefighting and high-capacity passenger needs scale.
By End Use
| Sub-Segment | Key Trend |
| Passenger Transport | Driven by inter-island amphibious air transport service routes |
| Cargo and Logistics | Serving remote-region freight beyond road networks |
| Firefighting/Search and Rescue | Fastest-growing use case amid climate-driven demand |
| Maritime Patrol and Surveillance | Rising in coastal security investment |
End use segmentation captures the breadth of amphibious aircraft demand. Passenger transport leads, while firefighting and SAR expand fastest as intensifying wildfire seasons push public agencies toward fleet renewal.