Anti-Rust Coating Market Summary
As per Market Research Future analysis, the Anti-Rust Coating Market Size was estimated at 32.45 USD Billion in 2024. The Anti-Rust Coating industry is projected to grow from 34.53 USD Billion in 2025 to 64.21 USD Billion by 2035, exhibiting a compound annual growth rate (CAGR) of 6.4% during the forecast period 2025 - 2035
Key Market Trends & Highlights
The Anti-Rust Coating Market is experiencing robust growth driven by sustainability and technological advancements.
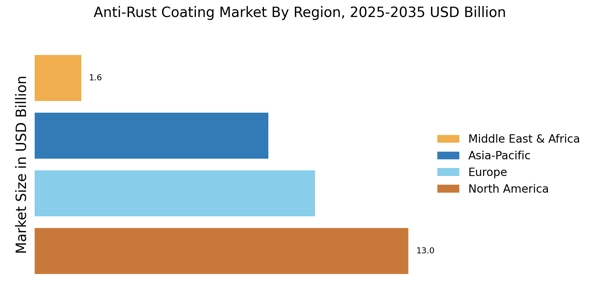
- North America remains the largest market for anti-rust coatings, driven by extensive infrastructure development.
- Asia-Pacific is recognized as the fastest-growing region, fueled by rapid industrialization and urbanization.
- Epoxy coatings dominate the market due to their superior performance, while zinc coatings are emerging as the fastest-growing segment.
- Key market drivers include rising infrastructure development and stringent environmental regulations that promote advanced coating solutions.
Market Size & Forecast
| 2024 Market Size | 32.45 (USD Billion) |
| 2035 Market Size | 64.21 (USD Billion) |
| CAGR (2025 - 2035) | 6.4% |
Major Players
AkzoNobel (NL), PPG Industries (US), Sherwin-Williams (US), BASF (DE), Nippon Paint (JP), RPM International (US), Hempel (DK), Kansai Paint (JP), Jotun (NO)