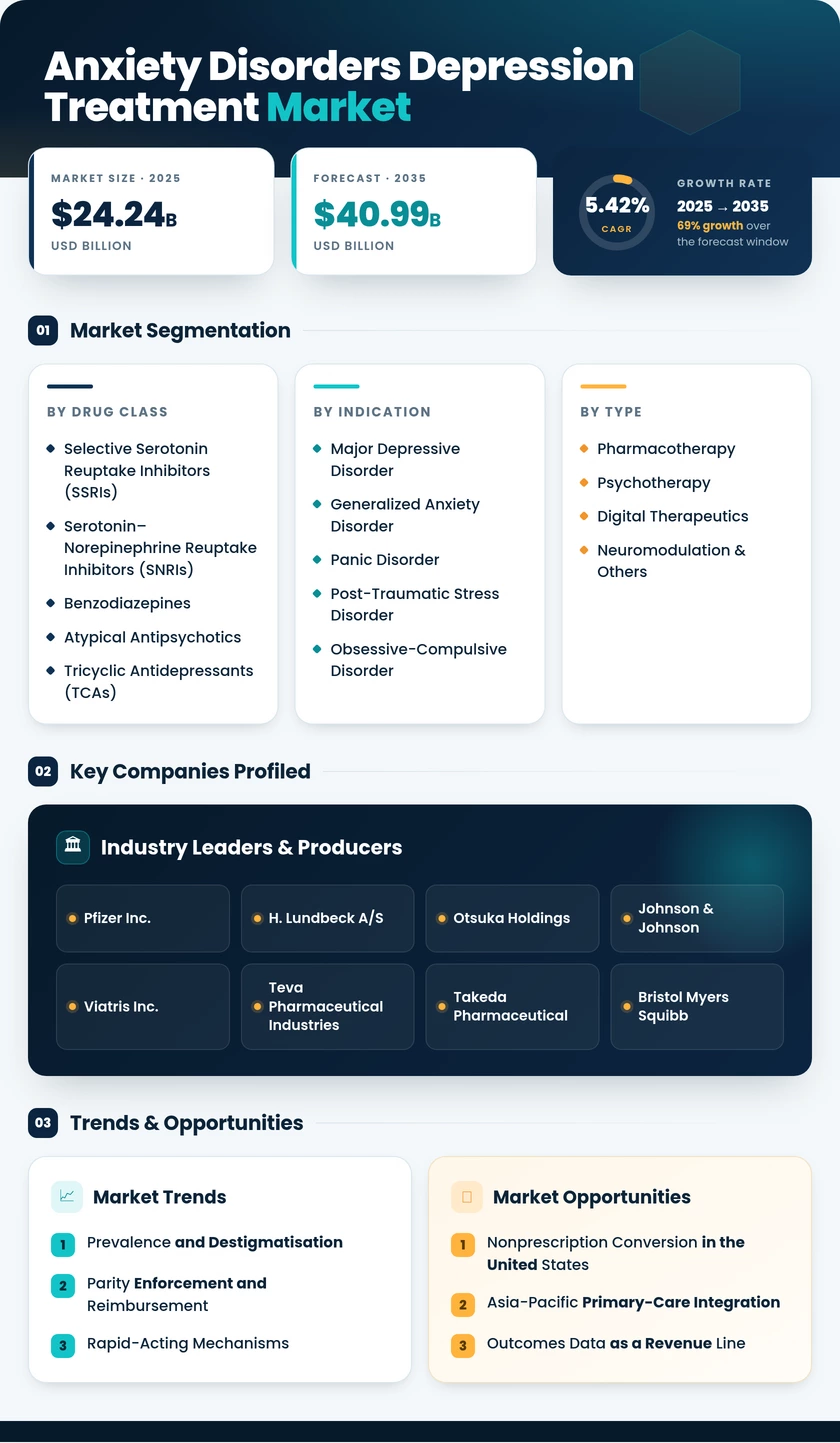
Anxiety Disorders and Depression Treatment Market (2026 - 2035)

Anxiety Disorders And Depression Treatment Market Research Report By Treatment Type (Pharmacological Treatment, Psychotherapy, Combined Treatment), By Type of Anxiety Disorder (Generalized Anxiety Disorder, Social Anxiety Disorder, Panic Disorder, Phobias, Obsessive-Compulsive Disorder), By Type of Depression (Major Depressive Disorder, Persistent Depressive Disorder, Bipolar Disorder, Seasonal Affective Disorder), By Patient Age Group (Adults, Adolescents, Children), By Severity of Condition (Mild, Moderate, Severe) and By Regional (North America, Europe, South America, Asia Pacific, Middle East and Africa) - Growth & Industry Forecast 2025 To 2035

Forecast Period
2026-2035
CAGR
5.42%
2025 Market Size
USD 24.24 Billion
2035 Market Size
USD 40.99 Billion
Healthcare ● Updated August 2026 Report ID: MRFR/HC/20824-HCR | Pages: 100 | Author: Satyendra Maurya, Rahul Gotadki
  1. 1 Market Overview |
    1. 1.1 Study Assumptions & Market Definition |
    2. 1.2 Scope of the Study |
    3. 1.3 Research Methodology
  2. 2 Market Summary & Key Report Takeaways |
    1. 2.1 Takeaways by Drug Class |
    2. 2.2 Takeaways by Indication and Therapy |
    3. 2.3 Takeaways by Geography
  3. 3 Global Market Size & Forecast (2021–2035) |
    1. 3.1 Historical Market Size (2021–2025) |
    2. 3.2 Current & Forecast Market Size (2026–2035) |
    3. 3.3 Market Size by Revenue (USD Billion) |
    4. 3.4 Year-over-Year Growth Analysis
  4. 4 Market Dynamics — Driver Impact Analysis |
    1. 4.1 Prevalence and Destigmatisation |
    2. 4.2 Parity Enforcement and Reimbursement |
    3. 4.3 Rapid-Acting Mechanisms |
    4. 4.4 Digital and Blended Care
  5. 5 Market Dynamics — Restraints Impact Analysis |
    1. 5.1 Generic Price Deflation |
    2. 5.2 Efficacy Plateau |
    3. 5.3 Access Infrastructure
  6. 6 Market Opportunity Analysis |
    1. 6.1 Nonprescription Conversion in the United States |
    2. 6.2 Asia-Pacific Primary-Care Integration |
    3. 6.3 Outcomes Data as a Revenue Line |
    4. 6.4 Adolescent and Perinatal Niches |
    5. 6.5 Emerging-Market Local Manufacturing |
    6. 6.6 Industry Value Chain Analysis |
    7. 6.7 Porter's Five Forces Analysis
  7. 7 Regional Market Share & Country-Level Analysis |
    1. 7.1 North America | |
      1. 7.1.1 United States | |
      2. 7.1.2 Canada | |
      3. 7.1.3 Mexico |
    2. 7.2 Europe | |
      1. 7.2.1 Germany | |
      2. 7.2.2 United Kingdom | |
      3. 7.2.3 France | |
      4. 7.2.4 Italy | |
      5. 7.2.5 Spain | |
      6. 7.2.6 Nordic Countries | |
      7. 7.2.7 Russia | |
      8. 7.2.8 Rest of Europe |
    3. 7.3 Asia-Pacific | |
      1. 7.3.1 China | |
      2. 7.3.2 India | |
      3. 7.3.3 Japan | |
      4. 7.3.4 South Korea | |
      5. 7.3.5 ASEAN | |
      6. 7.3.6 Rest of Asia-Pacific |
    4. 7.4 South America | |
      1. 7.4.1 Brazil | |
      2. 7.4.2 Argentina | |
      3. 7.4.3 Rest of South America |
    5. 7.5 Middle East & Africa | |
      1. 7.5.1 Saudi Arabia | |
      2. 7.5.2 UAE | |
      3. 7.5.3 South Africa | |
      4. 7.5.4 Egypt | |
      5. 7.5.5 Rest of Middle East & Africa
  8. 8 Future Outlook (2026–2035) |
    1. 8.1 Precision Psychiatry |
    2. 8.2 Measurement-Based Contracting |
    3. 8.3 The Neuroplastogen Question |
    4. 8.4 Workforce Automation
  9. 9 Market Segmentation Analysis |
    1. 9.1 By Drug Class | |
      1. 9.1.1 Selective Serotonin Reuptake Inhibitors (SSRIs) | |
      2. 9.1.2 Serotonin–Norepinephrine Reuptake Inhibitors (SNRIs) | |
      3. 9.1.3 Benzodiazepines | |
      4. 9.1.4 Atypical Antipsychotics | |
      5. 9.1.5 Tricyclic Antidepressants (TCAs) | |
      6. 9.1.6 Monoamine Oxidase Inhibitors (MAOIs) | |
      7. 9.1.7 Others |
    2. 9.2 By Indication | |
      1. 9.2.1 Major Depressive Disorder | |
      2. 9.2.2 Generalized Anxiety Disorder | |
      3. 9.2.3 Panic Disorder | |
      4. 9.2.4 Post-Traumatic Stress Disorder | |
      5. 9.2.5 Obsessive-Compulsive Disorder | |
      6. 9.2.6 Social Anxiety Disorder | |
      7. 9.2.7 Other Indications |
    3. 9.3 By Therapy Type | |
      1. 9.3.1 Pharmacotherapy | |
      2. 9.3.2 Psychotherapy | |
      3. 9.3.3 Digital Therapeutics | |
      4. 9.3.4 Neuromodulation & Others |
    4. 9.4 By End User | |
      1. 9.4.1 Hospitals & Clinics | |
      2. 9.4.2 Specialty Mental Health Centres | |
      3. 9.4.3 Homecare Settings | |
      4. 9.4.4 Others
  10. 10 Competitive Landscape |
    1. 10.1 Market Share Analysis (2026) |
    2. 10.2 Competitive Benchmarking Matrix |
    3. 10.3 Company Profiles | |
      1. 10.3.1 Pfizer Inc. | |
      2. 10.3.2 Eli Lilly and Company | |
      3. 10.3.3 H. Lundbeck A/S | |
      4. 10.3.4 Otsuka Holdings | |
      5. 10.3.5 Johnson & Johnson | |
      6. 10.3.6 Viatris Inc. | |
      7. 10.3.7 Teva Pharmaceutical Industries | |
      8. 10.3.8 Takeda Pharmaceutical | |
      9. 10.3.9 Bristol Myers Squibb | |
      10. 10.3.10 AbbVie Inc. | |
      11. 10.3.11 Sun Pharmaceutical Industries | |
      12. 10.3.12 Biogen Inc.
  11. 11 Recent News & Developments
  12. 12 Report Scope & Methodology |
    1. 12.1 Study Period & Base Year |
    2. 12.2 Data Sources & Citations |
    3. 12.3 Abbreviations
  13. 13 Detailed Sources and Citations
  14. 14 Frequently Asked Questions (FAQs)
  15. 15 LIST OF TABLES |
  16. TABLE 1 Global Market Size & Forecast, by Revenue (USD Billion), 2021–2035 |
  17. TABLE 2 Global Market — Year-over-Year Growth Analysis, 2021–2035 |
  18. TABLE 3 Driver Impact Analysis Matrix, 2026–2035 |
  19. TABLE 4 Restraints Impact Analysis Matrix, 2026–2035 |
  20. TABLE 5 Global Market Size, by Drug Class, 2021–2035 (USD Billion) |
  21. TABLE 6 Global Market Size, by Indication, 2021–2035 (USD Billion) |
  22. TABLE 7 Global Market Size, by Therapy Type, 2021–2035 (USD Billion) |
  23. TABLE 8 Global Market Size, by End User, 2021–2035 (USD Billion) |
  24. TABLE 9 Global Market Size, by Region, 2021–2035 (USD Billion) |
  25. TABLE 10 North America Market Size, by Country, 2021–2035 (USD Billion) |
  26. TABLE 11 Europe Market Size, by Country, 2021–2035 (USD Billion) |
  27. TABLE 12 Asia-Pacific Market Size, by Country, 2021–2035 (USD Billion) |
  28. TABLE 13 South America Market Size, by Country, 2021–2035 (USD Billion) |
  29. TABLE 14 Middle East & Africa Market Size, by Country, 2021–2035 (USD Billion) |
  30. TABLE 15 North America Market Size, by Drug Class, 2021–2035 (USD Billion) |
  31. TABLE 16 North America Market Size, by Indication, 2021–2035 (USD Billion) |
  32. TABLE 17 North America Market Size, by Therapy Type, 2021–2035 (USD Billion) |
  33. TABLE 18 North America Market Size, by End User, 2021–2035 (USD Billion) |
  34. TABLE 19 Europe Market Size, by Drug Class, 2021–2035 (USD Billion) |
  35. TABLE 20 Europe Market Size, by Indication, 2021–2035 (USD Billion) |
  36. TABLE 21 Europe Market Size, by Therapy Type, 2021–2035 (USD Billion) |
  37. TABLE 22 Europe Market Size, by End User, 2021–2035 (USD Billion) |
  38. TABLE 23 Asia-Pacific Market Size, by Drug Class, 2021–2035 (USD Billion) |
  39. TABLE 24 Asia-Pacific Market Size, by Indication, 2021–2035 (USD Billion) |
  40. TABLE 25 Asia-Pacific Market Size, by Therapy Type, 2021–2035 (USD Billion) |
  41. TABLE 26 Asia-Pacific Market Size, by End User, 2021–2035 (USD Billion) |
  42. TABLE 27 South America Market Size, by Drug Class, 2021–2035 (USD Billion) |
  43. TABLE 28 South America Market Size, by Therapy Type, 2021–2035 (USD Billion) |
  44. TABLE 29 Middle East & Africa Market Size, by Drug Class, 2021–2035 (USD Billion) |
  45. TABLE 30 Middle East & Africa Market Size, by Therapy Type, 2021–2035 (USD Billion) |
  46. TABLE 31 United States Market Size, by Drug Class, 2021–2035 (USD Billion) |
  47. TABLE 32 China Market Size, by Indication, 2021–2035 (USD Billion) |
  48. TABLE 33 Competitive Benchmarking Matrix, 2026 |
  49. TABLE 34 Company Profiles — Key Players |
  50. TABLE 35 Recent Developments & Strategic Announcements, 2023–2025 |
  51. TABLE 36 Report Scope & Methodology Summary |
  52. TABLE 37 Detailed Sources and Citations Index
  53. 16 LIST OF FIGURES |
  54. FIGURE 1 Market Dynamics — Drivers, Restraints, Opportunities and Challenges |
  55. FIGURE 2 Industry Value Chain Analysis |
  56. FIGURE 3 Porter's Five Forces Analysis |
  57. FIGURE 4 Global Market Size Trend, 2021–2035 (USD Billion) |
  58. FIGURE 5 Year-over-Year Growth Trajectory, 2022–2035 (%) |
  59. FIGURE 6 Market Share by Drug Class, 2025 vs 2035 (%) |
  60. FIGURE 7 Market Share by Indication, 2025 vs 2035 (%) |
  61. FIGURE 8 Market Share by Therapy Type, 2025 vs 2035 (%) |
  62. FIGURE 9 Market Share by End User, 2025 (%) |
  63. FIGURE 10 Regional Revenue Share, 2025 (%) |
  64. FIGURE 11 Regional CAGR Comparison, 2026–2035 (%) |
  65. FIGURE 12 North America Country-Level Share, 2025 (%) |
  66. FIGURE 13 Europe Country-Level Share, 2025 (%) |
  67. FIGURE 14 Asia-Pacific Country-Level Share, 2025 (%) |
  68. FIGURE 15 Competitive Landscape — Estimated Revenue Share Bands, 2026 |
  69. FIGURE 16 Strategic Positioning Matrix — Innovation vs Scale |
  70. FIGURE 17 Pipeline Maturity Heat Map by Mechanism Class |
  71. FIGURE 18 Reimbursement Readiness Index by Region
Share::
Request Free Sample

Segmentation Quick Reference

DimensionSub-SegmentsDominant SegmentFastest Growing Segment
By Drug ClassSSRIs; SNRIs; Benzodiazepines; Atypical Antipsychotics; TCAs; MAOIs; OthersSelective Serotonin Reuptake Inhibitors (SSRIs)Atypical Antipsychotics
By IndicationMajor Depressive Disorder; Generalized Anxiety Disorder; Panic Disorder; PTSD; OCD; Social Anxiety Disorder; OthersMajor Depressive DisorderPost-Traumatic Stress Disorder
By Therapy TypePharmacotherapy; Psychotherapy; Digital Therapeutics; Neuromodulation & OthersPharmacotherapyDigital Therapeutics
By End UserHospitals & Clinics; Specialty Mental Health Centres; Homecare Settings; OthersHospitals & ClinicsHomecare Settings
By GeographyNorth America; Europe; Asia-Pacific; South America; Middle East & AfricaNorth AmericaAsia-Pacific


Market Segmentation Overview

By Drug Class

Sub-SegmentKey Trend
Selective Serotonin Reuptake Inhibitors (SSRIs)Volume leadership with steady value erosion from genericisation
Serotonin–Norepinephrine Reuptake Inhibitors (SNRIs)Growth tied to comorbid pain and generalized anxiety prescribing
BenzodiazepinesTightening guidelines cap long-term use; acute settings persist
Atypical AntipsychoticsAdjunctive labelling drives premium-priced expansion
Tricyclic Antidepressants (TCAs)Retained in cost-constrained systems as second-line therapy
Monoamine Oxidase Inhibitors (MAOIs)Stable niche use in atypical and refractory presentations
Others (NMDA antagonists, neuroactive steroids)Highest-growth pocket driven by rapid-onset mechanisms


Drug-class economics diverge sharply from drug-class volumes. Genericised molecules dispense most scripts yet contribute a shrinking revenue share, while branded adjuncts and rapid-acting entrants capture disproportionate value.

By Indication

Sub-SegmentKey Trend
Major Depressive DisorderLargest base; screening expansion sustains steady growth
Generalized Anxiety DisorderPrimary-care detection lifts treated prevalence
Panic DisorderEmergency-department pathways drive initial diagnosis
Post-Traumatic Stress DisorderDense late-stage pipeline against a small current base
Obsessive-Compulsive DisorderHigh-dose protocols and neuromodulation referral growth
Social Anxiety DisorderAdolescent and young-adult diagnosis rates rising
Other IndicationsPerinatal and seasonal subtypes gaining dedicated therapies


Indication mix determines pricing power more than volume. Narrow, well-defined populations such as perinatal depression have proven capable of supporting premium launch prices that broad depression labels cannot.

By Therapy Type

Sub-SegmentKey Trend
PharmacotherapyMajority share sustained by scalability and low delivery cost
PsychotherapyGuideline first-line status in Europe supports funded expansion
Digital TherapeuticsReimbursement precedents in the U.S. and Germany unlock growth
Neuromodulation & OthersReferral volumes rise as treatment-resistance is better identified


Modality boundaries are blurring. Blended pathways that pair a molecule with structured digital support are becoming the reimbursable unit of care rather than either component alone.

By End User

Sub-SegmentKey Trend
Hospitals & ClinicsDiagnosis initiation and supervised dosing keep share concentrated
Specialty Mental Health CentresTreatment-resistant referrals drive high-value throughput
Homecare SettingsTelepsychiatry and self-administered regimens accelerate share gain
OthersAcademic, correctional and occupational health settings expand slowly


Care is migrating outward from the hospital. Homecare grows fastest because remote monitoring now satisfies the safety documentation that once required a clinic visit.

By Region

Sub-SegmentKey Trend
North AmericaParity enforcement and rapid-acting launches sustain value leadership
EuropeHTA rigour concentrates spend on moderate-to-severe cohorts
Asia-PacificPrimary-care screening scale-up delivers the steepest growth curve
South AmericaPublic tender volumes favour local and generic suppliers
Middle East & AfricaNational strategies and localisation mandates open new tenders


Regional divergence is widening. Mature markets grow through price and mechanism; emerging markets grow through diagnosis and access, and the two require entirely different commercial models.




Share::
Request Free Sample
Download PDF ×

We do not share your information with anyone. However, we may send you emails based on your report interest from time to time. You may contact us at any time to opt-out.