Automated Dispensing Machines Market (2026 - 2035)

Automated Dispensing Machines Market Research Report Information By Product Type (Centralized Automated Dispensing Systems, De-Centralized Automated Dispensing Systems), By End User (Hospitals, Pharmacy Stores, Laboratories, Others), And By Region (North America, Europe, Asia-Pacific, And Rest Of The World) –Market Forecast Till 2035
ID: MRFR/MED/5168-HCR
90 Pages
Rahul Gotadki, Snehal Singh
Last Updated: July 03, 2026
Automated Dispensing Machines Market
Market Size
Forecast Period2026-2035
CAGR (2026-2035)8.25%
2025 Market SizeUSD 4.75 Billion
2035 Market SizeUSD 10.51 Billion
Key Players
Omnicell Inc.
Swisslog Healthcare
Capsa Healthcare
ARxIUM
Talyst
ScriptPro
Opportunities
  • Decentralized Bedside Dispensing Expansion
  • Emerging Market Infrastructure Gaps
  • Data Monetization Through Diversion Analytics

Automated Dispensing Machines Market Summary

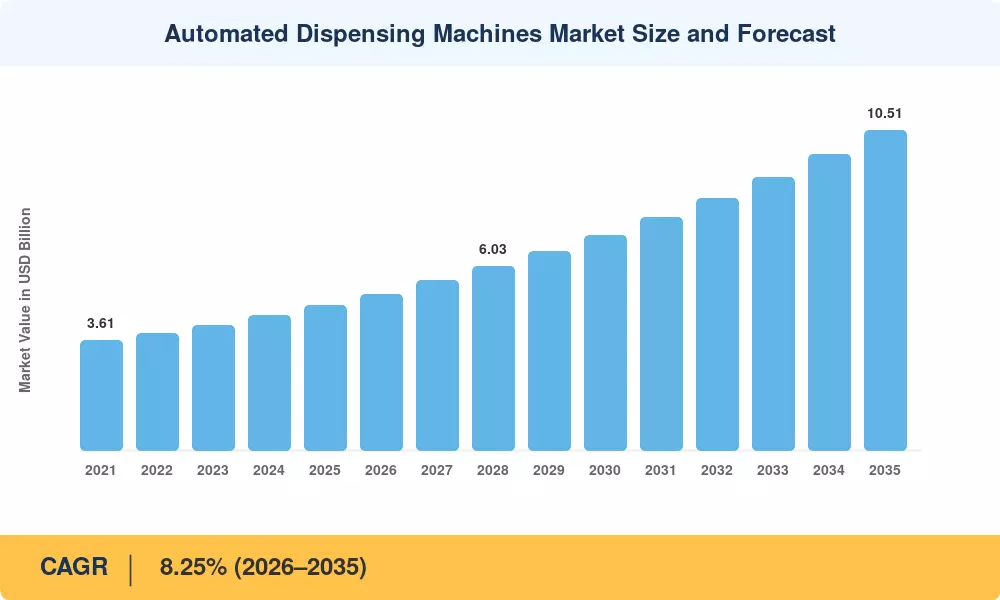
The Automated Dispensing Machines Market size was valued at USD 4.75 Billion in 2025, and the market is projected to grow from USD 5.14 Billion in 2026 to USD 10.51 Billion by 2035, registering a CAGR of 8.25% during the forecast period 2026–2035. Two catalysts anchor this trajectory: the DEA's expanded electronic prescribing mandate for controlled substances, which has pushed U.S. hospitals toward auditable point-of-care dispensing, and FDA Class II clearance pathways that have shortened time-to-market for remote medication management hardware.

Networked, sensor-driven cabinets that record every withdrawal against a patient record in real time are replacing legacy med-cart and manual cabinet procedures. Major U.S. health networks have committed $1.2 billion to pharmacy IT modernization since 2023 [1], a sign of a growing trend toward health systems buying hardware, analytics and cybersecurity as part of a single enterprise contract instead of point solutions.

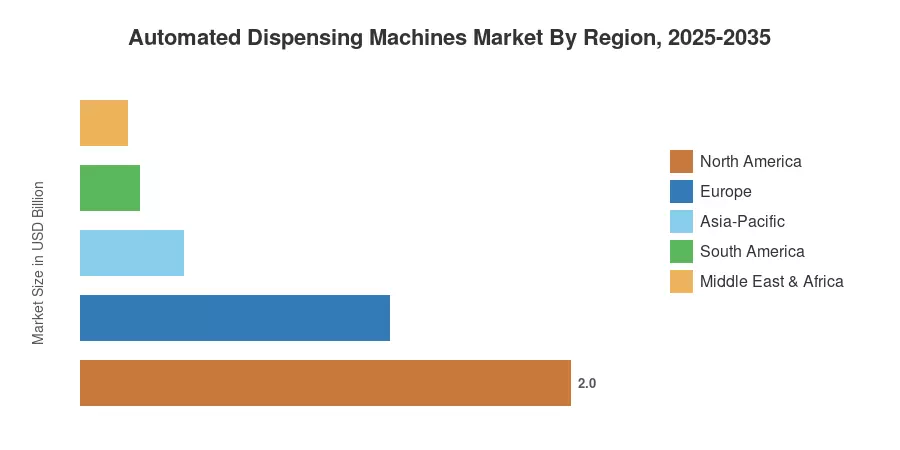
North America is the largest market, estimated to account for 42.2% of revenue in 2025, driven by dense hospital networks and pressure to comply with DEA regulations. Asia-Pacific is the fastest-growing region at a CAGR of 8.8%, with China, India, and South Korea funding modern pharmacy infrastructure. Europe is the runner-up, helped by the EU Falsified Medicines Directive serialization requirements. And the next decade will see vendors competing more on the depth of their software, not just their hardware.

Key Report Takeaways

• By Technology

  • Automated dispensing cabinets held an estimated 41.2% share of the Automated Dispensing Machines Market revenue in 2024.
  • Decentralized cabinet formats are expanding at roughly 11.5% CAGR through 2035 as bedside dispensing gains traction.
  • Centralized robotic dispensing infrastructure generated an estimated USD 2.74 billion in 2025.

• By Sector

  • Hospital inpatient pharmacies captured close to 60.1% of the Automated Dispensing Machines Market revenue in 2024.
  • Retail and community pharmacy deployments are growing near 9.8% CAGR as chain pharmacies adopt narcotics tracking.
  • Unit-dose oral solids accounted for an estimated 46.1% share of dispensed medication volume.

• By Geography

  • North America led the Automated Dispensing Machines Market with an estimated 42.2% revenue share in 2024.
  • Asia-Pacific is forecast to expand at approximately 8.8% CAGR through 2035.
  • Europe contributed an estimated USD 1.26 billion in 2025 revenue.

Market Size and Forecast (2021–2035)

We combine data from hospital procurement, vendor shipment data and disclosures from regulatory filings and triangulate against national pharmacy infrastructure expenditure reports to generate a consistent series for the 2021-2035 period.
Automated Dispensing Machines Market Size and Forecast
Our Impact
Enabled $4.3B Revenue Impact for Fortune 500 and Leading Multinationals
Partnering with 2000+ Global Organizations Each Year
30K+ Citations by Top-Tier Firms in the Industry

Driver Impact Analysis

Driver ~% Impact on CAGR Geographic Relevance Impact Timeline
DEA electronic controlled-substance mandates 22% North America Short-term (≤2 yr)
Hospital consolidation & enterprise procurement 18% Global Medium-term (2–4 yr)
APAC pharmacy infrastructure investment 16% Asia-Pacific Medium-term (2–4 yr)
EU Falsified Medicines Directive compliance 14% Europe Short-term (≤2 yr)
AI-driven diversion and inventory analytics 12% Global Long-term (≥4 yr)
Nursing labor shortages are driving automation 10% North America, Europe Medium-term (2–4 yr)
Retail pharmacy chain digitization 8% Global Long-term (≥4 yr)


Regulatory Tightening Around Controlled Substances

The DEA's electronic prescribing requirement for Schedule II–V drugs has made auditable, cabinet-level dispensing close to mandatory for U.S. hospital pharmacies, with non-compliant facilities facing licensing scrutiny [1].

Enterprise-Level Procurement Consolidation

As regional health systems merge, purchasing committees increasingly favor single-vendor automation suites; one 2024 health-system RFP bundled cabinet hardware, software, and cybersecurity into a contract exceeding $40 million [4].

Asia-Pacific Infrastructure Investment

China's tertiary hospital modernization program and India's National Digital Health Mission have both earmarked pharmacy automation as a funded category, lifting vendor order books across the region [7].

Restraints Impact Analysis

Restraint ~% Impact on CAGR Geographic Relevance Impact Timeline
High upfront capital cost for smaller facilities -15% Global, especially LMICs Medium-term (2–4 yr)
Integration complexity with legacy EHR systems -12% North America, Europe Short-term (≤2 yr)
Cybersecurity and data-sovereignty concerns -10% Global Long-term (≥4 yr)
Skilled pharmacy-technician shortages for upkeep -9% North America Medium-term (2–4 yr)
Fragmented regional medical-device approval timelines -8% Asia-Pacific, MEA Long-term (≥4 yr)


Capital Cost Barriers in Smaller Facilities

Community hospitals and independent pharmacies frequently cite six-figure upfront cabinet costs as the primary barrier, slowing adoption outside large health systems [15].

Legacy System Integration Friction

Many institutions still operate on EHR platforms over a decade old, requiring costly middleware to achieve real-time dispensing-record synchronization [13].

Automated Dispensing Machines Market Opportunities

Decentralized Bedside Dispensing Expansion

Bedside cabinet formats reduce nurse travel time and medication-error rates, creating a clear upgrade path for hospitals still running centralized-only fleets.

Emerging Market Infrastructure Gaps

Southeast Asia and the Gulf states currently have low automated-cabinet penetration relative to bed count, presenting a greenfield opportunity for vendors willing to localize service networks.

Data Monetization Through Diversion Analytics

Vendors are beginning to layer subscription analytics on top of hardware sales, turning dispensing logs into recurring-revenue diversion-monitoring products for hospital compliance teams.

Retail Pharmacy Narcotics Compliance

Chain pharmacies face growing state-level reporting requirements for controlled substances, opening a new buyer segment beyond traditional hospital pharmacy customers.

Dispensing-as-a-Service Contracts

Subscription pricing models lower the entry barrier for mid-sized hospitals that previously could not justify capital purchases, broadening the addressable customer base.

Automated Dispensing Machines Market Future Outlook

AI and Autonomous Dispensing Operations

Machine-learning inventory forecasting is moving from pilot to standard feature, with vendors citing double-digit reductions in stockout incidents across early enterprise deployments [11].

Platform Economics and Subscription Models

Dispensing-as-a-service contracts are restructuring vendor revenue toward recurring software and analytics fees rather than one-time hardware sales.

Interoperability as Competitive Differentiator

EHR-native integration is becoming a baseline procurement requirement; hospitals increasingly disqualify vendors lacking certified interfaces during RFP review [13].

Sustainability and Compliance Reporting

Health systems are beginning to factor device energy consumption and cybersecurity audit reporting into vendor scorecards, echoing broader ESG procurement trends seen in adjacent medical-device categories [16].

Automated Dispensing Machines Market Segmentation

By System Type

Segment Metric Primary Demand Driver
Automated Dispensing Cabinets 41.2% share Bedside medication safety
Robotic Central Pharmacy Dispensing Systems USD 1.71B High-volume hospital throughput
Other System Types 11.5% CAGR Niche specialty pharmacy needs


Automated dispensing cabinets remain the largest Automated Dispensing Machines Market segment, valued for their direct integration into nursing workflows. Robotic central pharmacy systems, though smaller in share, are growing fastest as large hospitals centralize high-volume unit-dose packaging.

By Deployment Model

Segment Metric Primary Demand Driver
Centralized Systems 57.8% share Bulk medication processing efficiency
Decentralized Systems 11.8% CAGR Point-of-care accessibility


Centralized deployment still dominates the Automated Dispensing Machines Market by share, but decentralized formats are closing the gap as hospitals push dispensing closer to the patient.

By End User

Segment Metric Primary Demand Driver
Hospital In-Patient Pharmacies 60.1% share Controlled-substance audit requirements
Retail & Community Pharmacies 9.8% CAGR Chain-level diversion compliance
Long-Term Care Facilities USD 0.38B Staffing-constrained medication rounds


Hospital inpatient pharmacies anchor demand across the Automated Dispensing Machines Market, while retail and community pharmacy adoption is accelerating as narcotics management systems become a competitive differentiator for chain operators.

By Medication Class

Segment Metric Primary Demand Driver
Unit-Dose Oral Solids 46.1% share Highest dispensing volume category
Controlled Substances 10.1% CAGR Regulatory tracking mandates
Injectable/IV Medications USD 0.62B High-risk medication safety protocols


Regional Market Share Analysis

Region Metric Primary Investment Themes
North America 42.2% share Controlled-substance compliance, enterprise contracts
Europe USD 1.26B FMD serialization, hospital consolidation
Asia-Pacific 8.8% CAGR Hospital infrastructure build-out
South America 5.0% share Public hospital modernization
Middle East & Africa USD 0.19B Private hospital network expansion
Total USD 4.75B Global pharmacy digitization


North America

Country Metric Key Driver
United States 84.5% of regional share DEA e-prescribing enforcement
Canada USD 0.21B Provincial hospital digitization
Mexico 7.2% CAGR Private hospital expansion


The U.S. continues to anchor regional demand as hospital systems standardize on enterprise dispensing suites ahead of stricter DEA audit cycles [1].

Europe

Country Metric Key Driver
Germany 24.8% of regional share FMD compliance investment
UK USD 0.29B NHS pharmacy modernization
France 9.1% CAGR Hospital consolidation
Italy 13.5% of regional share Regional health-system tenders
Spain USD 0.11B Public hospital procurement
Nordic Countries 8.4% CAGR Early digital-health adoption
Russia 6.0% of regional share Domestic vendor partnerships
Rest of Europe USD 0.18B Gradual cabinet replacement cycles


Germany and the UK together account for the largest share of European spending, with NHS England's pharmacy automation framework agreements driving multi-year vendor commitments [6].

Asia-Pacific

Country Metric Key Driver
China 34.6% of regional share Tertiary hospital modernization program
India 10.2% CAGR National Digital Health Mission
Japan USD 0.22B Aging population care infrastructure
South Korea 12.8% of regional share Smart hospital initiatives
ASEAN 9.6% CAGR Private hospital network growth
Rest of Asia-Pacific USD 0.09B Early-stage automation pilots


China's tertiary hospital build-out remains the single largest regional growth engine, with provincial procurement budgets prioritizing connected pharmacy infrastructure [7].

South America

Country Metric Key Driver
Brazil 58.0% of regional share Public hospital modernization fund
Argentina USD 0.06B Private hospital adoption
Rest of South America 6.5% CAGR Gradual regulatory alignment


Brazil's public hospital modernization fund has become the dominant procurement channel for cabinet vendors entering the region [15].

Middle East & Africa

Country Metric Key Driver
Saudi Arabia 38.0% of regional share Vision 2030 healthcare investment
UAE USD 0.05B Private hospital network expansion
South Africa 9.0% CAGR National health insurance rollout
Egypt 14.0% of regional share Public hospital digitization
Rest of MEA USD 0.02B Nascent adoption stage


Saudi Arabia's Vision 2030 healthcare investment program is the clearest near-term growth catalyst across the MEA region [17].

Automated Dispensing Machines Market By Region, 2025-2035

Competitive Benchmarking

The Automated Dispensing Machines Market is moderately consolidated, with the top five players accounting for about 48% of the revenue and HHI suggesting fragmentation of competition beyond the top tier. Mid-size specialists compete on service density and software depth, not just price.

Company Est. Revenue Share Range Key Offerings for Automated Dispensing Machines Market Strategic Positioning
Omnicell Inc. ~11–14% Cabinet hardware, central pharmacy robotics, analytics Enterprise software-led leader
Becton, Dickinson and Company ~9–12% ADC hardware, medication management suites Broad medical-device portfolio integration
Swisslog Healthcare ~7–10% Robotic central-fill systems Hospital workflow automation specialist
Capsa Healthcare (Kirby Lester) ~6–9% Pharmacy packaging and dispensing robotics Mid-market retail and hospital focus
ARxIUM ~5–8% Central-fill and cabinet automation Workflow customization specialist
Talyst ~4–6% Inventory management software Software-first niche player
ScriptPro ~4–6% Robotic dispensing for retail pharmacy Retail chain specialist
Yuyama Co. Ltd. ~4–7% Packaging and dispensing hardware APAC manufacturing strength
RxSafe ~3–5% Adherence packaging robotics Compliance-packaging niche
McKesson Corporation ~3–5% Distribution-linked dispensing solutions Supply-chain bundled offering


Recent News & Developments


  • NHS England (September 2023): Issued a national framework agreement for pharmacy automation procurement [6].


  • Capsa Healthcare (April 2024): Expanded retail pharmacy packaging robotics line for chain pharmacy customers [8].

Automated Dispensing Machines Market Report Scope

Field Detail
Market Scope Global automated dispensing machine hardware, software, and analytics
Study Period 2021–2035
CAGR 8.25% (2026–2035)
Market Size Checkpoints 2025: USD 4.75B; 2030: USD 7.07B; 2035: USD 10.51B
Fastest Growing Segments Decentralized cabinets, controlled-substance tracking, Asia-Pacific
Companies Profiled 10
Valuation Currency USD billion


FAQs

What total cost of ownership factors matter most when evaluating Automated Dispensing Machines Market vendors?
Buyers should weigh service-contract terms, software licensing fees, and integration costs alongside hardware price. Subscription models often lower upfront spend but raise long-term recurring costs [12].
How does EHR interoperability influence vendor selection?
Hospitals increasingly require certified, real-time EHR interfaces before shortlisting vendors. Lack of certified connectivity often disqualifies otherwise competitive bids during procurement review [13].
What cybersecurity certifications should buyers require for Automated Dispensing Machines Market vendors handling controlled substances?
Buyers should request documented penetration-testing results and compliance with current medical-device cybersecurity guidance. This reduces diversion and data-breach exposure significantly [16].
How are subscription-based dispensing-as-a-service models reshaping vendor contracts?
Recurring-revenue contracts are replacing one-time hardware sales, lowering entry barriers for mid-sized hospitals. This shift also ties vendor incentives more closely to ongoing system performance [12].
What integration challenges arise when retrofitting legacy pharmacy workflows with robotic central-fill systems?
Older facilities often require costly middleware to bridge robotic systems with decades-old inventory software. Workflow redesign and staff retraining add further implementation time [13].
How do narcotics management systems differ across leading platforms?
Diversion-monitoring depth varies widely; some platforms offer only basic withdrawal logs while others provide predictive anomaly detection. This gap increasingly drives premium pricing tiers [11].
What emerging use cases are pushing Automated Dispensing Machines Market adoption beyond hospitals?
Long-term care facilities and retail pharmacy chains are adopting cabinets for compliance and staffing relief. Outpatient surgical centers are also beginning to pilot point-of-care dispensing [8].  
What is the current size of the automated dispensing machines market?
The automated dispensing machines market reached USD 4.75 billion in 2025 and is projected to reach USD 10.51 billion by 2035.
What is the CAGR of the automated dispensing machines market?
The automated dispensing machines market is projected to grow at a CAGR of 8.25% during the forecast period 2026–2035.
Which region leads the automated dispensing machines market?
North America holds the largest share at 42.2%, while Asia-Pacific is the fastest-growing region at 8.8% CAGR.
Author
Author
Author Profile
Rahul Gotadki LinkedIn
Research Manager
He holds an experience of about 9+ years in Market Research and Business Consulting, working under the spectrum of Life Sciences and Healthcare domains. Rahul conceptualizes and implements a scalable business strategy and provides strategic leadership to the clients. His expertise lies in market estimation, competitive intelligence, pipeline analysis, customer assessment, etc.
Co-Author
Co-Author Profile
Snehal Singh LinkedIn
Manager - Research
High acumen in analyzing complex macro & micro markets with more than 6 years of work experience in the field of market research. By implementing her analytical skills in forecasting and estimation into market research reports, she has expertise in Packaging, Construction, and Equipment domains. She handles a team size of 20-25 resources and ensures smooth running of the projects, associated marketing activities, and client servicing.

Research Approach


Secondary Research

The secondary research process involved comprehensive analysis of regulatory databases, peer-reviewed medical and pharmacy journals, clinical publications, and authoritative health and industrial organizations. Key sources included the US Food & Drug Administration (FDA) Center for Devices and Radiological Health (CDRH), European Medicines Agency (EMA) Medical Device Coordination Group, International Society for Automation in Pharmacy (ISAP), American Society of Health-System Pharmacists (ASHP), American Association of Pharmacy Technicians (AAPT), National Institutes of Health (NIH) National Library of Medicine, National Center for Biotechnology Information (NCBI/PubMed), Centers for Medicare & Medicaid Services (CMS) Healthcare Cost and Utilization Project, World Health Organization (WHO) Global Health Observatory, EU Eurostat Healthcare Database, Organisation for Economic Co-operation and Development (OECD) Health Statistics, American Hospital Association (AHA) Annual Survey Database, International Federation of Robotics (IFR) Service Robotics Statistics, Pharmacy Quality Alliance (PQA) Metrics Database, and national health ministry and pharmacy regulatory reports from key markets (US, Germany, UK, Japan, China, India). These sources were used to collect hospital automation statistics, medical device regulatory approval data (510(k), PMA, CE Mark), clinical safety and medication error reduction studies, healthcare infrastructure and pharmacy automation trends, and market landscape analysis for centralized automated dispensing systems, de-centralized automated dispensing systems, and emerging robotic dispensing technologies.


Primary Research

In order to gather both qualitative and quantitative insights, supply-side and demand-side stakeholders were interviewed during the primary research process. CEOs, VPs of Product Development, heads of regulatory affairs, and commercial directors from automated dispensing machine manufacturers, pharmacy automation OEMs, and healthcare technology integrators were examples of supply-side sources. Chief pharmacy officers, hospital pharmacy directors, clinical pharmacists, procurement leads from health systems and hospital networks, executives from retail pharmacy chains, and laboratory operations managers from academic medical centers, community hospitals, specialty pharmacies, and long-term care facilities were examples of demand-side sources. Primary research obtained information on clinical adoption patterns, hospital capital expenditure cycles, pricing strategies, reimbursement dynamics, and integration challenges with current electronic health record (EHR) and pharmacy information management systems (PIMS). It also verified product development and regulatory pipeline timelines and validated market segmentation by product type (centralized vs. decentralized systems).

Primary Respondent Breakdown:

By Designation: C-level Primaries (32%), Director Level (30%), Others (38%)

By Region: North America (32%), Europe (30%), Asia-Pacific (28%), Rest of World (10%)


Market Size Estimation

Global market valuation was derived through revenue mapping, installed base analysis, and procedure volume (dispensing transaction volume) analysis. The methodology included:

Identification of 50+ key manufacturers across North America, Europe, Asia-Pacific, and Latin America, including McKesson Corporation, BD (Becton Dickinson), Omnicell, Swisslog Healthcare, ScriptPro, Parata Systems, Talyst, Asteres, TouchPoint Medical, and emerging players in robotics and AI-integrated dispensing

Product mapping across centralized automated dispensing systems (carousels, robotic dispensing cabinets, unit-dose packaging systems), de-centralized automated dispensing systems (point-of-care cabinets, automated dispensing lockers, bedside medication dispensing), and emerging categories (AI-driven inventory management, cloud-connected dispensing, telepharmacy-enabled systems)

Analysis of reported and modeled annual revenues specific to automated dispensing machine portfolios, including hardware sales, software subscriptions, maintenance contracts, and implementation services

Coverage of manufacturers representing 72–78% of global market share in 2024

Extrapolation using bottom-up (installed base × average selling price by country/region, dispensing transaction volumes × revenue per transaction by end-user segment) and top-down (manufacturer revenue validation, industry association shipment data cross-referencing) approaches to derive segment-specific valuations for hospitals, pharmacy stores, laboratories, and other end-user categories

Download Free Sample

Kindly complete the form below to receive a free sample of this Report

Download PDF ×

We do not share your information with anyone. However, we may send you emails based on your report interest from time to time. You may contact us at any time to opt-out.
















