Automated Optical Inspection System Market (2026 - 2035)

Automated Optical Inspection System Market Size, Share and Research Report By  Component (Software, System), by Technology (Inline AOI, Offline AOI), by Type (2D AOI Systems, 3D AOI Systems), by End User (Automotive, Aerospace & Defense) and By Region (North America, Europe, Asia-Pacific, Middle East & Africa, and South America) - Industry Forecast Till 2035
ID: MRFR/SEM/4521-HCR
200 Pages
Nirmit Biswas, Aarti Dhapte
Last Updated: July 20, 2026
Automated Optical Inspection System Market
Market Size
Forecast Period2026-2035
CAGR (2026-2035)8.8%
2025 Market SizeUSD 0.97 Billion
2035 Market SizeUSD 2.26 Billion
Key Players
Koh Young Technology
Omron Corporation
Nordson
Viscom AG
Saki Corporation
Test Research Inc.
Opportunities
  • Emerging Market Leapfrogging
  • AOI-as-a-Service and Subscription Models
  • Advanced Packaging Inspection

Automated Optical Inspection System Market Summary

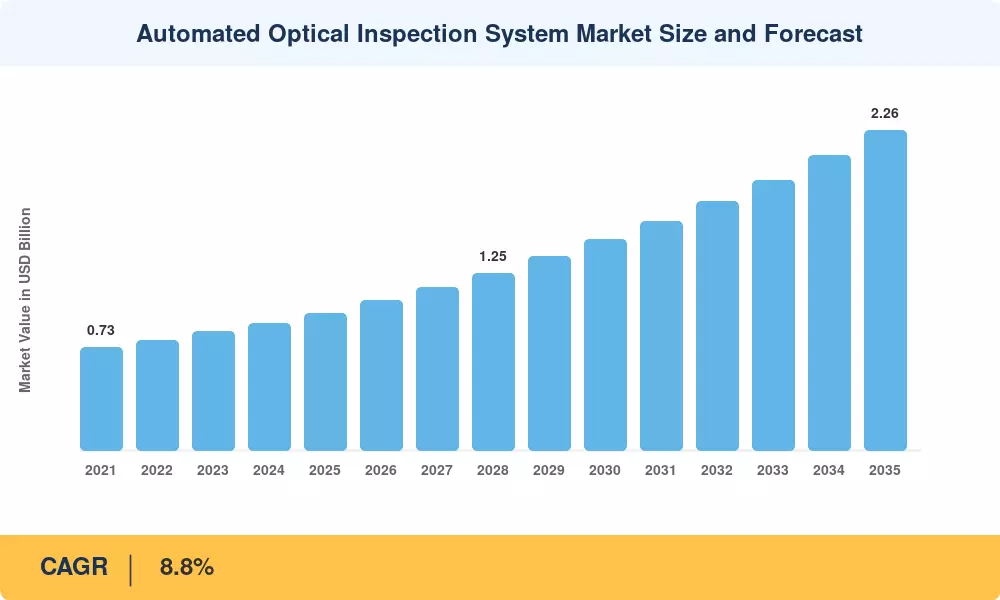
The Automated Optical Inspection System Market stood at USD 0.97 billion in 2025 and is projected to grow from USD 1.06 billion in 2026 to USD 2.26 billion by 2035, registering a CAGR of 8.8% during 2026–2035. This growth trajectory reflects intensifying demand for zero-defect manufacturing across semiconductor fabrication, automotive electronics, and 5G infrastructure rollout. Government-backed programs such as the U.S. CHIPS and Science Act — which earmarked over USD 52 billion for domestic semiconductor capacity — have directly catalyzed investment in advanced inspection infrastructure [1]. The Automated Optical Inspection System Market is entering a pivotal transformation phase as legacy manual visual inspection and rule-based machine vision give way to AI-driven, deep-learning-powered systems capable of sub-micron defect classification.

Traditional 2D line-scan cameras are yielding ground to 3D measurement-based platforms that combine structured light projection with multi-angle imaging. This shift accelerates as component miniaturization pushes pad pitches below 0.3 mm, rendering conventional inspection inadequate. Europe's Chips Act, committing EUR 43 billion in public and private investment through 2030, adds another demand pillar for the Automated Optical Inspection System Market as new fabs require complete inline inspection ecosystems [2].

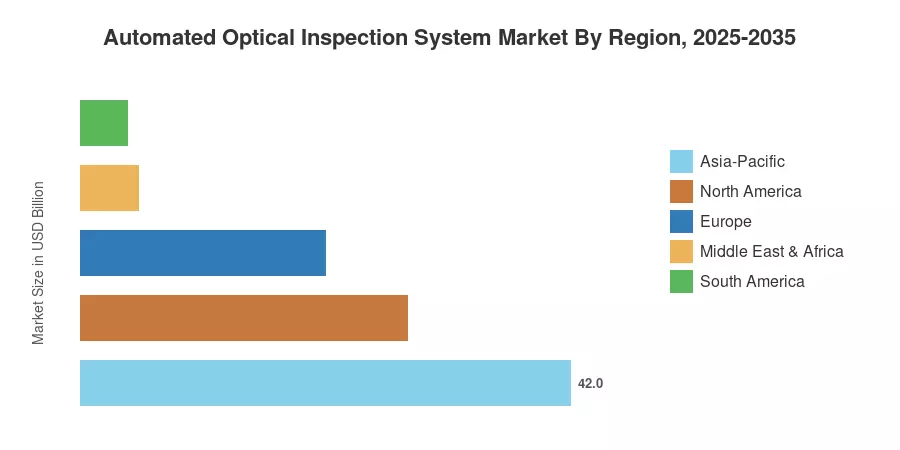
Asia-Pacific commands the largest share of the Automated Optical Inspection System Market at roughly 42%, driven by concentrated PCB and semiconductor manufacturing in China, South Korea, and Japan. The region also registers the fastest CAGR at 9.6%, fueled by India's semiconductor incentive scheme and ASEAN capacity expansion. North America holds the second-largest position with approximately a 28% share, anchored by defense electronics and EV battery module assembly lines. As the Automated Optical Inspection System Market matures, convergence of AI analytics, edge computing, and Industry 4.0 connectivity will redefine quality assurance paradigms through 2035.


Key Report Takeaways

• By Type

  • 3D AOI systems captured the dominant share of the Automated Optical Inspection System Market at approximately 58% in 2025, propelled by demand for volumetric solder measurement and coplanarity checks on fine-pitch BGAs.
  • 2D AOI platforms are projected to grow at a CAGR of 7.2% through 2035 as cost-sensitive mid-tier manufacturers in Southeast Asia continue deployment.

• By Technology

  • Inline inspection accounted for roughly 65% of the Automated Optical Inspection System Market, reflecting the shift toward real-time closed-loop process control on high-speed SMT lines.
  • Offline AOI systems represented approximately USD 0.34 billion in 2025, serving prototype verification and low-volume aerospace assembly.

• By Region

  • Asia-Pacific leads the Automated Optical Inspection System Market with a 42% revenue share and the highest regional CAGR of 9.6%.
  • North America maintains a 28% share, underpinned by defense-grade inspection mandates and onshoring semiconductor packaging.
  • Europe holds a 21% share, with Germany and France driving automotive electronics inspection adoption.


Automated Optical Inspection System Market Size and Forecast (2021–2035)

Market sizing draws from bottom-up revenue modeling across equipment OEM shipments, validated against top-down demand from end-user capital expenditure disclosures and cross-referenced with trade data from major importing economies. Historical figures reflect actual shipment records, while forecast values apply the calibrated 8.8% CAGR with adjustments for anticipated technology cycle inflections.
Automated Optical Inspection System Market Size and Forecast
Our Impact
Enabled $4.3B Revenue Impact for Fortune 500 and Leading Multinationals
Partnering with 2000+ Global Organizations Each Year
30K+ Citations by Top-Tier Firms in the Industry

Driver Impact Analysis

Driver ~% Impact on CAGR Geographic Relevance Impact Timeline
Semiconductor capacity expansion (CHIPS Act, EU Chips Act) 22% North America, Europe Short-term (≤2 yr)
EV and ADAS electronics proliferation 18% Global Medium-term (2–4 yr)
5G/6G infrastructure PCB complexity 15% Asia-Pacific, North America Short-term (≤2 yr)
AI and deep-learning defect classification 14% Global Medium-term (2–4 yr)
Industry 4.0 and smart factory integration 12% Europe, Asia-Pacific Long-term (≥4 yr)
Miniaturization and advanced packaging 11% Asia-Pacific Long-term (≥4 yr)
Medical device regulatory tightening 8% North America, Europe Medium-term (2–4 yr)


Semiconductor Capacity Expansion

The U.S. CHIPS and Science Act allocated USD 52.7 billion to domestic chip manufacturing, and TSMC, Samsung, and Intel have collectively initiated over USD 120 billion in new fab initiatives through 2028 [1]. For inline wafer-level and package-level inspection, each advanced fab necessitates between 15 and 40 AOI stations. The Automated Optical Inspection System Market will benefit from a dual-continent expansion wave that front-loads demand into the 2026–2029 window, as this dynamic is mirrored by the EU Chips Act, which mobilizes EUR 43 billion in investment [2].


EV and ADAS Electronics Growth

Global EV sales surpassed 17 million units in 2024, and the average electronic content per EV exceeds USD 3,500 — roughly double that of internal combustion vehicles [6]. Battery management systems, power inverters, and ADAS modules demand multi-layer HDI boards where solder joint reliability is safety-critical. Tier-1 automotive suppliers such as Bosch and Continental now mandate 100% AOI coverage on all safety-relevant assemblies, pushing the Automated Optical Inspection System Market deeper into automotive supply chains.

5G Infrastructure and High-Density Interconnect

The rollout of 5G-Advanced and early 6G R&D is driving base-station antenna modules toward 16-layer and 20-layer PCB architectures with 50-µm line/space geometries [7]. These boards require 3D inspection at every reflow stage to detect micro-voids, head-in-pillow defects, and pad cratering. Telecom operators in China alone installed over 3.7 million 5G base stations through 2024, each containing multiple boards subject to AOI verification. This infrastructure buildout sustains the Automated Optical Inspection System Market growth across Asia-Pacific through 2030.

AI-Driven Defect Classification

Deep-learning algorithms trained on millions of defect images now achieve false-call rates below 0.1% — a tenfold improvement over traditional rule-based systems [8]. This shift reduces operator review burden by up to 70% and enables real-time statistical process control feedback loops. Companies such as Koh Young and CyberOptics have integrated neural-network engines directly onto inspection platforms, making AI capabilities a standard differentiator in the Automated Optical Inspection System Market.


Restraints Impact Analysis

Restraint ~% Drag on CAGR Geographic Relevance Impact Timeline
High capital cost of 3D AOI systems –18% Emerging markets Short-term (≤2 yr)
Integration complexity with legacy MES –15% Global Medium-term (2–4 yr)
Shortage of trained inspection engineers –12% Asia-Pacific, MEA Long-term (≥4 yr)
Data security concerns in cloud-connected AOI –10% North America, Europe Medium-term (2–4 yr)
Competing inspection modalities (X-ray, SPI) –8% Global Long-term (≥4 yr)


Capital Cost Barriers

A single high-end 3D AOI station carries a price tag between USD 150,000 and USD 350,000 depending on throughput and measurement capability [12]. For small and mid-size EMS providers in Southeast Asia, Latin America, and Africa, this represents a significant capital hurdle. Many continue to rely on manual inspection or refurbished 2D systems, constraining the addressable market for premium platforms in the Automated Optical Inspection System Market.

Legacy System Integration Challenges

Connecting modern AOI platforms to older manufacturing execution systems built on proprietary protocols remains a friction point. Approximately 35% of global SMT lines still operate on pre-Industry 4.0 architectures that lack standardized data interfaces [9]. Retrofitting these lines for closed-loop AOI feedback requires middleware development and extended commissioning cycles, delaying upgrade timelines for the Automated Optical Inspection System Market.

Skilled Workforce Gaps

Expertise in optics, image processing, and statistical process control is necessary to operate and program sophisticated AOI equipment. According to industry surveys, there is a 25% vacancy rate for inspection engineering positions in the APAC electronics clusters [13]. The deployment velocity is impeded by this talent disparity, which also restricts the yield-improvement ROI that justifies AOI investment.


Automated Optical Inspection System Market Opportunities

Emerging Market Leapfrogging

India's USD 10 billion semiconductor incentive program and Vietnam's expanding electronics export sector create greenfield opportunities for AOI vendors to establish footprints in markets that lack installed inspection infrastructure. These regions can leapfrog directly to 3D AI-enabled platforms, bypassing the 2D upgrade cycle that characterized earlier APAC adoption.

AOI-as-a-Service and Subscription Models

Equipment vendors are beginning to offer inspection capacity on pay-per-board or subscription pricing, lowering the entry barrier for cost-sensitive manufacturers. This model converts capital expenditure into operating expenditure and opens the Automated Optical Inspection System Market to thousands of small EMS providers currently priced out of premium systems.

Advanced Packaging Inspection

Fan-out wafer-level packaging, chiplet architectures, and 2.5D/3D IC stacking introduce new inspection requirements at the die-attach and redistribution layer stages. A recent source projects the advanced packaging equipment market to exceed USD 8 billion by 2028 [10], and AOI systems specifically designed for panel-level and wafer-level inspection represent a high-growth adjacency for the Automated Optical Inspection System Market.

Data Monetization Through Process Analytics

AOI platforms annually produce terabytes of process data and defect imagery per production line. On top of hardware sales, vendors can generate recurring software revenue streams by layering analytics dashboards, predictive maintenance alerts, and yield-optimization consulting. The competitive moats within the Automated Optical Inspection System Market are fortified by this data-centric value proposition.


Medical Device and Aerospace Regulatory Tailwinds

FDA's increased scrutiny of Class III medical device manufacturing and updated AS9100 aerospace quality standards are expanding mandatory inspection coverage [11]. These regulated end-users accept premium pricing and long-term service contracts, offering higher margins than consumer electronics applications.


Automated Optical Inspection System Market Future Outlook

AI-Autonomous Inspection and Adaptive Learning

By 2030, the Automated Optical Inspection System Market will see widespread adoption of self-tuning inspection systems that autonomously adjust detection thresholds based on real-time process drift. Generative AI models trained on synthetic defect data will reduce programming time from hours to minutes, making zero-operator inspection lines commercially viable. The source estimates AI-driven quality systems can reduce scrap rates by 30–50% in electronics manufacturing [8].

Platform Economics and Software-Defined Inspection

As Chinese and Taiwanese competitors increase production, hardware margins in the Automated Optical Inspection System Market will decrease. The focus of differentiation will be on software platforms that aggregate inspection data across multiple sites, providing fleet management, predictive maintenance, and yield benchmarking as subscription services. This transition is indicative of the more extensive Industry 4.0 transition from capital equipment sales to recurring digital revenue.


Electrification and Power Electronics Inspection

The global EV transition — projected to reach 40 million annual unit sales by 2030 according to IEA [6] — demands specialized AOI capabilities for power semiconductor modules, thick-copper PCBs, and battery management boards. These substrates present unique inspection challenges including high-reflectance surfaces and large thermal pad geometries that require purpose-built 3D measurement algorithms.

Sustainability and ESG-Driven Quality Mandates

Electronics manufacturers face mounting ESG reporting requirements that tie environmental impact directly to manufacturing yield. The Automated Optical Inspection System Market benefits as OEMs adopt first-pass yield targets exceeding 99.5% to minimize material waste, energy consumption from rework, and scrap disposal. The EU's Corporate Sustainability Reporting Directive will extend these pressures across European supply chains starting 2026 [16].


Automated Optical Inspection System Market Segmentation

By Type

Segment Key Metric Primary Demand Driver
3D AOI 58% market share Volumetric solder measurement for fine-pitch components
2D AOI CAGR 7.2% Cost-effective inspection for standard SMT lines


Three-dimensional AOI platforms dominate the Automated Optical Inspection System Market because they deliver height-measurement data essential for detecting insufficient solder, tombstoning, and coplanarity defects invisible to 2D cameras. Structured light and phase-shift profilometry enable sub-10-µm height resolution, making 3D systems the default choice for automotive, aerospace, and advanced consumer electronics lines. Two-dimensional systems retain relevance in cost-sensitive applications where through-hole components and larger pad geometries simplify defect detection. The 2D segment's growth trajectory reflects ongoing first-time AOI adoption across emerging manufacturing regions where solder joint AOI analysis requirements remain less demanding.

By Technology

Segment Key Metric Primary Demand Driver
Inline USD 0.63 Billion (2025) Real-time closed-loop process control
Offline 35% market share Prototype verification, low-volume production


Inline inspection dominates the Automated Optical Inspection System Market as manufacturers integrate AOI directly into SMT production flows between reflow and wave soldering stations. This configuration enables immediate defect feedback and automatic diversion of nonconforming boards, reducing downstream rework costs by up to 40% [9]. Offline systems serve prototype development labs, failure analysis departments, and low-volume aerospace assembly where production throughput is secondary to measurement precision.

By End-User

Segment Key Metric Primary Demand Driver
Consumer and Electronics 32% market share Smartphone, laptop, and IoT device assembly
IT and Telecom CAGR 9.4% 5G base station and server PCB complexity
Automotive USD 0.19 Billion (2025) ADAS, EV power electronics
Aerospace and Defense CAGR 8.1% AS9100 compliance, mission-critical reliability
Healthcare 8% market share FDA Class III device manufacturing mandates
Other End-Users CAGR 7.0% Industrial controls, energy systems


Consumer electronics manufacturing drives the largest share of the Automated Optical Inspection System Market due to sheer board volume — a single smartphone assembly line can produce 20,000 units per shift, each requiring multi-stage inspection. The IT and telecom segment registers the fastest growth as 5G-Advanced and AI server platforms push board complexity beyond 16 layers with 01005-size passives. Automotive ranks third by value, but its quality requirements — zero-defect mandates for safety-critical ADAS modules — command premium inspection system pricing and longer service contract durations.


Regional Market Share Analysis

Region Key Metric Primary Investment Themes
Asia-Pacific 42% share Semiconductor fabs, consumer electronics, 5G base stations
North America 28% share Defense electronics, EV battery modules, reshoring
Europe 21% share Automotive ADAS, aerospace, EU Chips Act
South America 4% share EMS growth in Brazil, automotive entry
Middle East & Africa 5% share Defense modernization, telecom buildout
Total 100%

The Automated Optical Inspection System Market exhibits strong regional concentration, with Asia-Pacific and North America together accounting for approximately 70% of global revenue. Regional dynamics differ sharply: mature markets prioritize system upgrades and AI integration, while emerging regions focus on first-time AOI adoption tied to new manufacturing capacity.


North America

Country Key Metric Key Driver
US CAGR 8.5% CHIPS Act fab investments, defense procurement
Canada USD 0.03 Billion (2025) Automotive electronics, telecom
Mexico CAGR 9.1% Nearshoring EMS operations


The United States anchors regional demand as CHIPS Act–funded fabs from TSMC (Arizona), Samsung (Texas), and Intel (Ohio) enter equipment procurement phases through 2028. Mexico's role as a nearshoring destination for North American OEMs is accelerating first-time AOI deployment across Monterrey and Guadalajara electronics clusters [1].

Europe

Country Key Metric Key Driver
Germany 34% of regional share Automotive Tier-1 inspection mandates
UK CAGR 7.8% Aerospace and defense electronics
France USD 0.04 Billion (2025) Semiconductor R&D, automotive
Italy CAGR 7.5% Industrial automation
Spain 5% of regional share Renewable energy electronics
Nordic Countries CAGR 8.0% Telecom equipment manufacturing
Russia 3% of regional share Defense electronics
Rest of Europe USD 0.02 Billion (2025) General electronics manufacturing


Germany's dominance reflects its automotive electronics concentration, where Bosch, Continental, and ZF require 100% AOI coverage across safety-critical ADAS module lines. The EU Chips Act is seeding new inspection demand as Intel's Magdeburg fab and STMicroelectronics' Crolles expansion enter commissioning [2].

Asia-Pacific

Country Key Metric Key Driver
China 38% of regional share Consumer electronics and telecom PCB production
Japan USD 0.07 Billion (2025) Precision electronics, automotive
South Korea CAGR 9.2% Semiconductor packaging, display manufacturing
India CAGR 11.4% Semiconductor incentive scheme, new fab capacity
ASEAN 12% of regional share EMS outsourcing growth
Rest of Asia-Pacific CAGR 8.3% General manufacturing expansion


China's massive PCB production base — accounting for over 50% of global PCB output — ensures the country remains the single largest national market. India's semiconductor mission, backed by USD 10 billion in government incentives, is projected to bring three new fab and OSAT facilities online by 2028, each requiring full AOI installation [3]. South Korea's advanced memory and display packaging operations from Samsung and SK Hynix continue pushing 3D inspection adoption.

South America

Country Key Metric Key Driver
Brazil 62% of regional share EMS sector, automotive electronics
Argentina CAGR 7.6% Telecom infrastructure expansion
Rest of South America USD 0.005 Billion (2025) Early-stage electronics manufacturing


Brazil's Manaus Free Trade Zone remains the regional electronics manufacturing hub, where incentive structures attract multinational EMS providers expanding capacity. The Automated Optical Inspection System Market in South America remains nascent but is gaining traction as quality requirements from North American OEMs flow through to contract manufacturers.

Middle East & Africa

Country Key Metric Key Driver
Saudi Arabia 28% of regional share Vision 2030 electronics diversification
UAE CAGR 9.8% Smart city electronics infrastructure
South Africa USD 0.006 Billion (2025) Automotive assembly electronics
Egypt CAGR 8.6% Telecom network expansion
Rest of MEA 18% of regional share Defense modernization


Saudi Arabia's Vision 2030 is catalyzing electronics manufacturing diversification, with several joint ventures targeting localized PCB assembly for defense and telecom applications. UAE's smart-city programs drive demand for high-reliability inspection across IoT device manufacturing lines.


Automated Optical Inspection System Market By Region, 2025-2035

Competitive Benchmarking

The Automated Optical Inspection System Market exhibits medium concentration, with the top five vendors collectively holding an estimated 45–55% revenue share. The Herfindahl-Hirschman Index approximates 1,100–1,300, indicating a moderately competitive field where technology differentiation and regional distribution strength determine positioning. Competition intensifies as Chinese entrants gain traction in mid-tier segments while established players invest in AI software ecosystems.

Company Est. Revenue Share Range Key Offerings Strategic Positioning
Koh Young Technology ~12–16% 3D SPI and AOI with AI-powered analytics Premium 3D measurement leader with deep-learning platform
Omron Corporation ~8–12% VT-S series inline 2D/3D AOI Broad factory automation integration
Nordson (CyberOptics) ~7–10% SQ3000 multi-function 3D inspection Multi-process inspection consolidation
Viscom AG ~5–8% S3088 and X7056 3D AOI/AXI Combined optical and X-ray inspection
Saki Corporation ~5–7% 3Di and BF-Planet 3D AOI High-speed inline inspection
Test Research Inc. (TRI) ~4–7% TR7700Q 3D AOI Cost-competitive platforms for Asian EMS
Mirtec Co., Ltd. ~4–6% MV-6 OMNI 3D AOI Value-segment 3D inspection
Machvision Inc. ~3–5% MV-7U and MV-3U AOI Taiwan and China market penetration
Yamaha Motor (Intelligent Machines) ~3–5% YSi-V 3D AOI SMT line integration synergies
Göpel Electronic ~2–4% OptiCon 3D AOI and boundary scan Hybrid electrical/optical test


Recent News & Developments

  • Koh Young Technology (March 2025): Launched the Zenith Alpha 3D AOI platform featuring on-device generative AI for autonomous threshold optimization, reducing false-call rates by 45% [8].
  • Nordson Corporation (January 2025): Completed integration of CyberOptics' MRS sensor technology into the ASYMTEK dispensing platform, creating a closed-loop dispense-and-inspect workflow for the Automated Optical Inspection System Market [17].


  • Saki Corporation (November 2023): Expanded manufacturing capacity at its Gunma, Japan facility by 30% to meet rising demand from EV electronics assembly lines [20].


Automated Optical Inspection System Market Report Scope

Parameter Detail
Market Scope Global Automated Optical Inspection System Market — hardware, software, and services revenue
Study Period 2021–2035
CAGR Window 2026–2035
Base Year 2025
Market Size (2025) USD 0.97 Billion
Market Size (2035) USD 2.26 Billion
CAGR 8.8%
Fastest Growing Segment 3D AOI (by type); IT and Telecom (by end-user)
Companies Profiled 10 major players
Valuation Unit USD Billion
Methodology Bottom-up revenue modeling validated with top-down demand analysis, trade data, and expert interviews


FAQs

How do AOI systems compare with automated X-ray inspection for hidden solder defects?
AOI excels at surface-level defects like missing components and bridging but cannot see joints beneath BGAs or QFNs. X-ray systems complement AOI by detecting voids and head-in-pillow defects under packages [15].
What typical ROI timeline should manufacturers expect from a 3D AOI investment?
Most electronics manufacturers achieve payback within 12–18 months through reduced rework labor, lower scrap rates, and avoided field-return costs. High-volume lines with over 50,000 placements per day see faster returns [12].
How does AI-based AOI handle new product introductions with no training data?
Leading platforms use transfer learning from existing defect libraries combined with synthetic data generation to create baseline models before first-article production. Initial accuracy typically exceeds 90% within the first production lot [8].
What maintenance frequency do inline AOI systems require?
Standard maintenance intervals run every 2,000–3,000 operating hours, covering camera calibration, lighting module replacement, and conveyor alignment checks. Annual service contracts typically cost 5–8% of the system purchase price [12].
Can existing 2D AOI platforms be upgraded to 3D capability?
Most 2D-to-3D upgrades require full sensor-head replacement rather than software-only updates, costing 40–60% of a new 3D system. Some vendors offer modular upgrade paths with trade-in credits [17].
How do data privacy regulations affect cloud-connected AOI deployments?
Manufacturers in regulated industries increasingly deploy on-premise edge servers for defect data processing to comply with ITAR, EAR, and GDPR requirements. Hybrid architectures keep sensitive data local while transmitting anonymized analytics [14].
What staffing model works best for operating a multi-line AOI installation?
One trained inspection engineer can typically manage four to six inline AOI stations when systems feature centralized review software. Outsourced managed-service models are gaining traction among mid-tier EMS providers [13].    
Author
Author
Author Profile
Nirmit Biswas LinkedIn
Senior Research Analyst
With 5+ years of expertise in Market Intelligence and Strategic Research, Nirmit Biswas specializes in ICT, Semiconductors, and BFSI. Backed by an MBA in Financial Services and a Computer Science foundation, Nirmit blends technical depth with business acumen. He has successfully led 100+ projects for global enterprises and startups, including Amazon, Cisco, L&T and Huawei, delivering market estimations, competitive benchmarking, and GTM strategies. His focus lies in transforming complex data into clear, actionable insights that drive growth, innovation, and investment decisions. Recognized for bridging engineering innovation with executive strategy, Nirmit helps businesses navigate dynamic markets with confidence.
Co-Author
Co-Author Profile
Aarti Dhapte LinkedIn
AVP - Research
A consulting professional focused on helping businesses navigate complex markets through structured research and strategic insights. I partner with clients to solve high-impact business problems across market entry strategy, competitive intelligence, and opportunity assessment. Over the course of my experience, I have led and contributed to 100+ market research and consulting engagements, delivering insights across multiple industries and geographies, and supporting strategic decisions linked to $500M+ market opportunities. My core expertise lies in building robust market sizing, forecasting, and commercial models (top-down and bottom-up), alongside deep-dive competitive and industry analysis. I have played a key role in shaping go-to-market strategies, investment cases, and growth roadmaps, enabling clients to make confident, data-backed decisions in dynamic markets.

Research Approach


Secondary Research

The secondary research process involved comprehensive analysis of regulatory databases, industry association publications, technical standards repositories, and authoritative manufacturing reports. Key sources included the International Electronics Manufacturing Initiative (iNEMI), Association Connecting Electronics Industries (IPC.org), Semiconductor Equipment and Materials International (SEMI.org), Institute of Electrical and Electronics Engineers (IEEE.org), International Organization for Standardization (ISO.org) for ISO 9001/ISO 14001 quality standards, Occupational Safety and Health Administration (OSHA) for manufacturing safety compliance, US Department of Commerce Bureau of Industry and Security (BIS) for export control regulations, European Semiconductor Industry Association (ESIA), China Semiconductor Industry Association (CSIA), Japan Electronics and Information Technology Industries Association (JEITA), Korea Semiconductor Industry Association (KSIA), Taiwan Semiconductor Industry Association (TSIA), US Bureau of Labor Statistics (BLS) for electronics manufacturing employment data, US Census Bureau for electronics import/export statistics, Eurostat for EU manufacturing output data, National Bureau of Statistics of China for industrial production metrics, and Organisation for Economic Co-operation and Development (OECD) industrial production indices. These sources were used to collect equipment installation statistics, technology adoption rates, manufacturing capacity data, supply chain dynamics, and competitive landscape analysis for 2D AOI systems, 3D AOI systems, inline AOI, offline AOI, software platforms, and integrated inspection solutions across automotive, aerospace & defense, consumer electronics, telecommunications, and medical device sectors.


Primary Research

In order to gather both qualitative and quantitative insights, supply-side and demand-side stakeholders were interviewed during the primary research process. CEOs, VPs of engineering, heads of product development, regional sales directors, and customer support leads from makers of AOI systems, suppliers of machine vision components, and OEMs of semiconductor equipment were examples of supply-side sources. VP of Manufacturing, SMT (Surface Mount Technology) production managers, quality assurance directors, process engineers from electronics manufacturing services (EMS) providers, OEM electronics manufacturers, tier-1 automotive suppliers, aerospace component fabricators, and procurement leads from PCB assembly facilities were examples of demand-side sources. Technology adoption schedules, software-hardware integration roadmaps, and preferences for inline versus offline deployment, capital expenditure cycles, total cost of ownership models, and aftermarket service requirements were all verified by primary research.

Primary Respondent Breakdown:

By Designation: C-level Primaries (28%), Director Level (35%), Others (37%)

By Region: North America (40%), Europe (25%), Asia-Pacific (28%), Rest of World (7%)

By End-User Industry: Automotive (32%), Consumer Electronics (28%), Aerospace & Defense (18%), Telecommunications/5G Infrastructure (12%), Medical Devices (10%)


Market Size Estimation

Global market valuation was derived through revenue mapping and equipment installation analysis. The methodology included:

Identification of 50+ key manufacturers across North America, Europe, Asia-Pacific, and Latin America specializing in AOI hardware, machine vision software, and integrated inspection platforms

Product mapping across 2D AOI systems, 3D AOI systems, inline AOI configurations, offline AOI stations, standalone software licenses, and cloud-based inspection analytics

Analysis of reported and modeled annual revenues specific to AOI system portfolios, excluding adjacent metrology and X-ray inspection product lines where possible

Coverage of manufacturers representing 75-80% of global market share in 2024, with particular focus on KLA Corporation, Omron Corporation, Cognex Corporation, Viscom AG, Test Research Inc., CyberOptics Corporation, Saki Corporation, Mirtec Co. Ltd., and Yxlon International GmbH

Extrapolation using bottom-up (unit shipments × ASP by country/region, segmented by 2D vs 3D technology) and top-down (manufacturer revenue validation, factoring in software versus hardware mix) approaches to derive segment-specific valuations across component (software vs. system), technology (inline vs. offline), type (2D vs. 3D), and end-user verticals

Download Free Sample

Kindly complete the form below to receive a free sample of this Report

Download PDF ×

We do not share your information with anyone. However, we may send you emails based on your report interest from time to time. You may contact us at any time to opt-out.

















