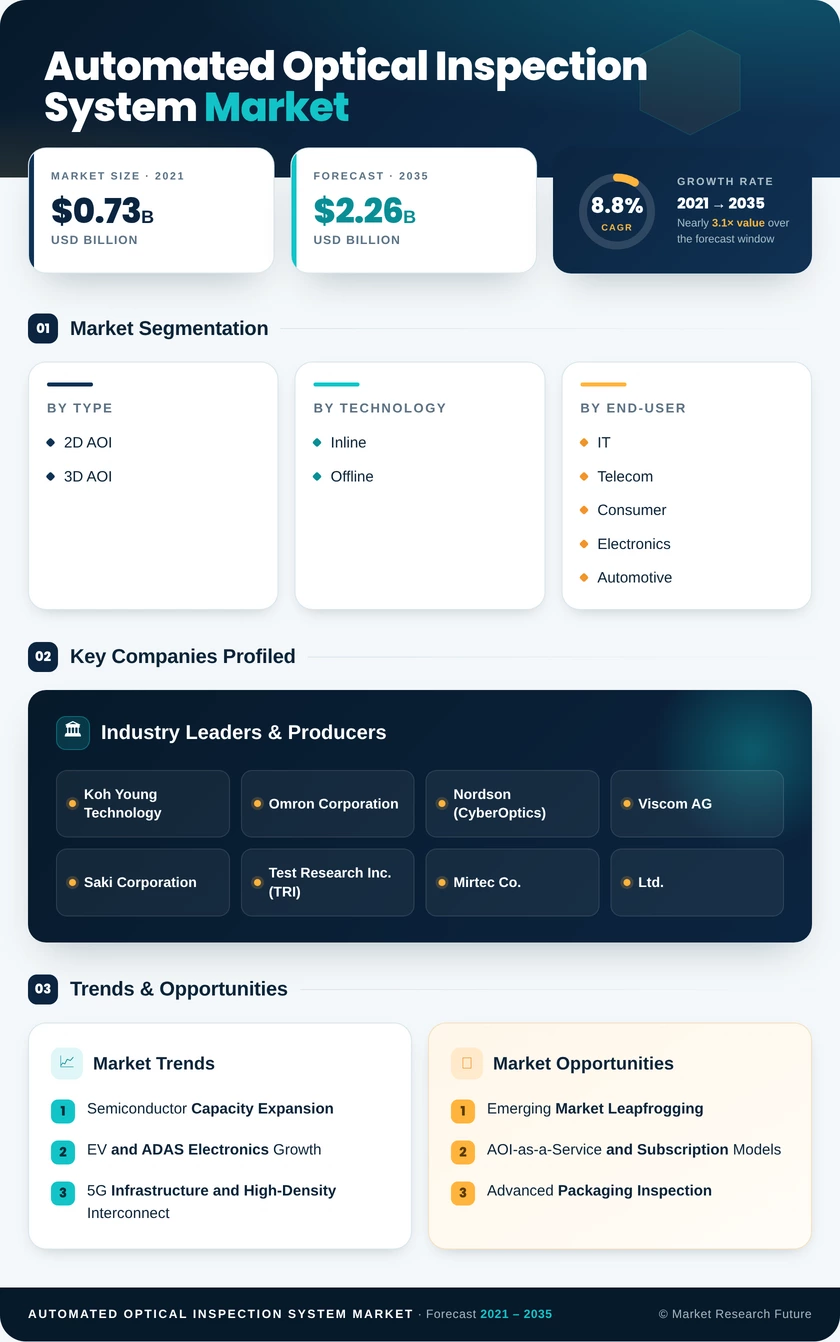
Automated Optical Inspection System Market (2026 - 2035)

ID: MRFR/SEM/4521-HCR
200 Pages
Nirmit Biswas
Last Updated: July 20, 2026
Automated Optical Inspection System Market Size, Share and Research Report By  Component (Software, System), by Technology (Inline AOI, Offline AOI), by Type (2D AOI Systems, 3D AOI Systems), by End User (Automotive, Aerospace & Defense) and By Region (North America, Europe, Asia-Pacific, Middle East & Africa, and South America) - Industry Forecast Till 2035
Automated Optical Inspection System Market
Market Size
Forecast Period2026-2035
CAGR (2026-2035)8.8%
2025 Market SizeUSD 0.97 Billion
2035 Market SizeUSD 2.26 Billion
Key Players
Koh Young Technology
Omron Corporation
Nordson
Viscom AG
Saki Corporation
Test Research Inc.
Opportunities
  • Emerging Market Leapfrogging
  • AOI-as-a-Service and Subscription Models
  • Advanced Packaging Inspection
  1. 1 Market Overview |
    1. 1.1 Study Assumptions & Market Definition |
    2. 1.2 Scope of the Study |
    3. 1.3 Research Methodology
  2. 2 Market Summary & Key Takeaways
  3. 3 Market Dynamics |
    1. 3.1 Market Drivers Analysis | |
      1. 3.1.1 Semiconductor Capacity Expansion (CHIPS Act, EU Chips Act) | |
      2. 3.1.2 EV and ADAS Electronics Proliferation | |
      3. 3.1.3 5G/6G Infrastructure PCB Complexity | |
      4. 3.1.4 AI and Deep-Learning Defect Classification | |
      5. 3.1.5 Industry
    2. 4.0 and Smart Factory Integration | |
      1. 3.1.6 Miniaturization and Advanced Packaging | |
      2. 3.1.7 Medical Device Regulatory Tightening |
    3. 3.2 Market Restraints Analysis | |
      1. 3.2.1 High Capital Cost of 3D AOI Systems | |
      2. 3.2.2 Integration Complexity with Legacy MES | |
      3. 3.2.3 Shortage of Trained Inspection Engineers | |
      4. 3.2.4 Data Security Concerns in Cloud-Connected AOI | |
      5. 3.2.5 Competing Inspection Modalities (X-ray, SPI) |
    4. 3.3 Market Opportunity Analysis | |
      1. 3.3.1 Emerging Market Leapfrogging | |
      2. 3.3.2 AOI-as-a-Service and Subscription Models | |
      3. 3.3.3 Advanced Packaging Inspection | |
      4. 3.3.4 Data Monetization Through Process Analytics | |
      5. 3.3.5 Medical Device and Aerospace Regulatory Tailwinds |
    5. 3.4 Industry Value Chain Analysis |
    6. 3.5 Porter's Five Forces Analysis
  4. 4 Global Automated Optical Inspection System Market Size & Forecast (2021–2035) |
    1. 4.1 Historical Market Size (2021–2025) |
    2. 4.2 Current & Forecast Market Size (2026–2035) |
    3. 4.3 Market Size by Revenue (USD Billion) |
    4. 4.4 Year-over-Year Growth Analysis
  5. 5 Segmentation Analysis |
    1. 5.1 By Type | |
      1. 5.1.1 2D AOI | |
      2. 5.1.2 3D AOI |
    2. 5.2 By Technology | |
      1. 5.2.1 Inline | |
      2. 5.2.2 Offline |
    3. 5.3 By End-User | |
      1. 5.3.1 IT and Telecom | |
      2. 5.3.2 Consumer and Electronics | |
      3. 5.3.3 Automotive | |
      4. 5.3.4 Aerospace and Defense | |
      5. 5.3.5 Healthcare | |
      6. 5.3.6 Other End-Users
  6. 6 Regional Analysis |
    1. 6.1 North America | |
      1. 6.1.1 United States | |
      2. 6.1.2 Canada | |
      3. 6.1.3 Mexico |
    2. 6.2 Europe | |
      1. 6.2.1 Germany | |
      2. 6.2.2 United Kingdom | |
      3. 6.2.3 France | |
      4. 6.2.4 Italy | |
      5. 6.2.5 Spain | |
      6. 6.2.6 Nordic Countries | |
      7. 6.2.7 Russia | |
      8. 6.2.8 Rest of Europe |
    3. 6.3 Asia-Pacific | |
      1. 6.3.1 China | |
      2. 6.3.2 Japan | |
      3. 6.3.3 South Korea | |
      4. 6.3.4 India | |
      5. 6.3.5 ASEAN | |
      6. 6.3.6 Rest of Asia-Pacific |
    4. 6.4 South America | |
      1. 6.4.1 Brazil | |
      2. 6.4.2 Argentina | |
      3. 6.4.3 Rest of South America |
    5. 6.5 Middle East & Africa | |
      1. 6.5.1 Saudi Arabia | |
      2. 6.5.2 UAE | |
      3. 6.5.3 South Africa | |
      4. 6.5.4 Egypt | |
      5. 6.5.5 Rest of MEA
  7. 7 Competitive Landscape |
    1. 7.1 Market Share Analysis (2025) |
    2. 7.2 Competitive Benchmarking Matrix |
    3. 7.3 Company Profiles | |
      1. 7.3.1 Koh Young Technology | |
      2. 7.3.2 Omron Corporation | |
      3. 7.3.3 Nordson (CyberOptics) | |
      4. 7.3.4 Viscom AG | |
      5. 7.3.5 Saki Corporation | |
      6. 7.3.6 Test Research Inc. (TRI) | |
      7. 7.3.7 Mirtec Co., Ltd. | |
      8. 7.3.8 Machvision Inc. | |
      9. 7.3.9 Yamaha Motor (Intelligent Machines) | |
      10. 7.3.10 Göpel Electronic
  8. 8 Future Outlook & Strategic Recommendations (2026–2035) |
    1. 8.1 AI-Autonomous Inspection and Adaptive Learning |
    2. 8.2 Platform Economics and Software-Defined Inspection |
    3. 8.3 Electrification and Power Electronics Inspection |
    4. 8.4 Sustainability and ESG-Driven Quality Mandates
  9. 9 Recent Developments & News
  10. 10 Frequently Asked Questions (FAQs)
  11. 11 Report Scope & Methodology |
    1. 11.1 Study Period & Base Year |
    2. 11.2 Data Sources & Citations |
    3. 11.3 Abbreviations
  12. 12 LIST OF TABLES |
  13. TABLE 1 Global Automated Optical Inspection System Market Size & Forecast, by Revenue (USD Billion), 2021–2035 |
  14. TABLE 2 Global Automated Optical Inspection System Market – Year-over-Year Growth Analysis, 2021–2035 |
  15. TABLE 3 Market Driver Impact Analysis |
  16. TABLE 4 Market Restraint Impact Analysis |
  17. TABLE 5 Regional Market Share Summary |
  18. TABLE 6 North America Automated Optical Inspection System Market Size, by Country, 2021–2035 (USD Billion) |
  19. TABLE 7 Europe Automated Optical Inspection System Market Size, by Country, 2021–2035 (USD Billion) |
  20. TABLE 8 Asia-Pacific Automated Optical Inspection System Market Size, by Country, 2021–2035 (USD Billion) |
  21. TABLE 9 South America Automated Optical Inspection System Market Size, by Country, 2021–2035 (USD Billion) |
  22. TABLE 10 Middle East & Africa Automated Optical Inspection System Market Size, by Country, 2021–2035 (USD Billion) |
  23. TABLE 11 Global Automated Optical Inspection System Market Size, by Type, 2021–2035 (USD Billion) |
  24. TABLE 12 Global Automated Optical Inspection System Market Size, by Technology, 2021–2035 (USD Billion) |
  25. TABLE 13 Global Automated Optical Inspection System Market Size, by End-User, 2021–2035 (USD Billion) |
  26. TABLE 14 Competitive Benchmarking Matrix – Global Automated Optical Inspection System Market, 2025 |
  27. TABLE 15 Company Profiles – Key Players, Global Automated Optical Inspection System Market |
  28. TABLE 16 Recent Developments & Strategic Announcements, 2023–2025 |
  29. TABLE 17 Report Scope & Methodology Summary |
  30. TABLE 18 Detailed Sources and Citations |
  31. TABLE 19 North America Automated Optical Inspection System Market Size, by Type, 2021–2035 (USD Billion) |
  32. TABLE 20 North America Automated Optical Inspection System Market Size, by Technology, 2021–2035 (USD Billion) |
  33. TABLE 21 North America Automated Optical Inspection System Market Size, by End-User, 2021–2035 (USD Billion) |
  34. TABLE 22 Europe Automated Optical Inspection System Market Size, by Type, 2021–2035 (USD Billion) |
  35. TABLE 23 Europe Automated Optical Inspection System Market Size, by Technology, 2021–2035 (USD Billion) |
  36. TABLE 24 Europe Automated Optical Inspection System Market Size, by End-User, 2021–2035 (USD Billion) |
  37. TABLE 25 Asia-Pacific Automated Optical Inspection System Market Size, by Type, 2021–2035 (USD Billion) |
  38. TABLE 26 Asia-Pacific Automated Optical Inspection System Market Size, by Technology, 2021–2035 (USD Billion) |
  39. TABLE 27 Asia-Pacific Automated Optical Inspection System Market Size, by End-User, 2021–2035 (USD Billion) |
  40. TABLE 28 South America Automated Optical Inspection System Market Size, by Type, 2021–2035 (USD Billion) |
  41. TABLE 29 South America Automated Optical Inspection System Market Size, by Technology, 2021–2035 (USD Billion) |
  42. TABLE 30 South America Automated Optical Inspection System Market Size, by End-User, 2021–2035 (USD Billion) |
  43. TABLE 31 Middle East & Africa Automated Optical Inspection System Market Size, by Type, 2021–2035 (USD Billion) |
  44. TABLE 32 Middle East & Africa Automated Optical Inspection System Market Size, by Technology, 2021–2035 (USD Billion) |
  45. TABLE 33 Middle East & Africa Automated Optical Inspection System Market Size, by End-User, 2021–2035 (USD Billion)
  46. 13 LIST OF FIGURES |
  47. FIGURE 1 Automated Optical Inspection System Market Dynamics Overview |
  48. FIGURE 2 Industry Value Chain Analysis |
  49. FIGURE 3 Porter's Five Forces Analysis |
  50. FIGURE 4 Global Automated Optical Inspection System Market Size Trend (USD Billion), 2021–2035 |
  51. FIGURE 5 Market Size by Type — Share Chart (2025) |
  52. FIGURE 6 Market Size by Technology — Share Chart (2025) |
  53. FIGURE 7 Market Size by End-User — Share Chart (2025) |
  54. FIGURE 8 Regional Market Share — Pie Chart (2025) |
  55. FIGURE 9 North America Country-Level Share Chart |
  56. FIGURE 10 Europe Country-Level Share Chart |
  57. FIGURE 11 Asia-Pacific Country-Level Share Chart |
  58. FIGURE 12 South America Country-Level Share Chart |
  59. FIGURE 13 Middle East & Africa Country-Level Share Chart |
  60. FIGURE 14 Competitive Landscape — Market Share Analysis (2025) |
  61. FIGURE 15 Competitive Positioning Matrix

Segmentation Quick Reference

DimensionSub-SegmentsDominant SegmentFastest Growing Segment
By Type2D AOI, 3D AOI3D AOI3D AOI
By TechnologyInline, OfflineInlineInline
By End-UserIT and Telecom, Consumer and Electronics, Automotive, Aerospace and Defense, Healthcare, Other End-UsersConsumer and ElectronicsIT and Telecom


Market Segmentation Overview

By Type

Sub-SegmentKey Trend
2D AOICost-effective adoption in emerging EMS markets; maintained by legacy line compatibility
3D AOIDominant platform driven by volumetric solder measurement and AI-powered defect classification


Three-dimensional AOI has become the industry standard for high-reliability applications, while 2D systems continue serving price-sensitive manufacturers and simpler board geometries.

By Technology

Sub-SegmentKey Trend
InlineReal-time closed-loop integration within SMT production lines for immediate defect feedback
OfflinePrototype validation, failure analysis, and low-volume production environments


Inline technology captures the majority of new installations as manufacturers prioritize continuous process monitoring over batch-mode inspection.

By End-User

Sub-SegmentKey Trend
IT and TelecomFastest growth driven by 5G-Advanced base station and AI server board complexity
Consumer and ElectronicsLargest segment sustained by smartphone, laptop, and IoT device assembly volumes
AutomotiveExpanding rapidly with ADAS and EV power electronics mandating zero-defect inspection
Aerospace and DefenseRegulatory compliance (AS9100) drives premium system adoption with long service contracts
HealthcareFDA Class III device manufacturing requirements expanding mandatory AOI coverage
Other End-UsersIndustrial controls, energy systems, and general electronics manufacturing


Consumer electronics retains the largest revenue share due to sheer production volume, while IT and telecom end-users drive the fastest growth trajectory as board complexity escalates across next-generation networking and compute platforms.


 

Download PDF ×

We do not share your information with anyone. However, we may send you emails based on your report interest from time to time. You may contact us at any time to opt-out.