Automotive Digital Mapping Market

Key Players: HERE Technologies, TomTom, Google (Alphabet), Mobileye (Intel), NavInfo, Baidu, Apple, Mapbox

Automotive Digital Mapping Market

Automotive Digital Mapping Market Research Report By Component (Solutions, Services), By Application (Autonomous Cars, ADAS, Fleet Management), and By Regional (North America, Europe, South America, Asia Pacific, Middle East and Africa) - Forecast to 2035
ID: MRFR/AT/21981-HCR
128 Pages
Shubham Munde, Aarti Dhapte
Last Updated: June 19, 2026

Automotive Digital Mapping Market Summary

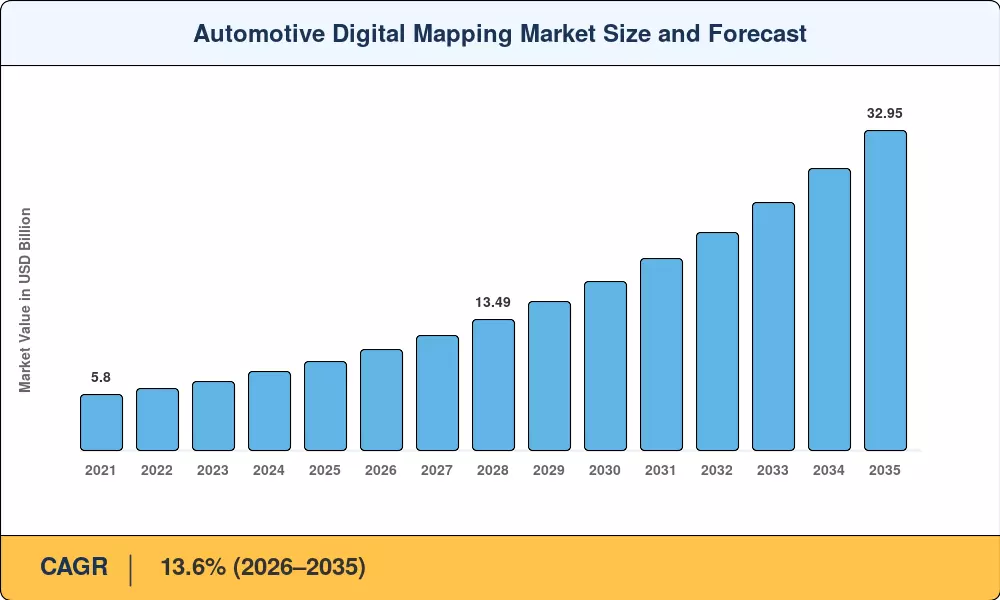
The automotive digital mapping market reached an estimated USD 9.20 billion in 2025 and is projected to grow from USD 10.45 billion in 2026 to USD 32.95 billion by 2035, registering a compound annual growth rate of 13.6% over the forecast period. Government-backed autonomous vehicle testing programs and the rapid expansion of connected car ecosystems across North America and Europe are the primary investment catalysts behind this acceleration. Automakers committed over USD 35 billion globally toward self-driving R&D between 2023 and 2025, much of which flows directly into high-definition spatial data infrastructure [2].

The automotive digital mapping market is experiencing a fundamental technology shift. Legacy turn-by-turn navigation databases — static, updated quarterly, and centimeter-imprecise — are being replaced by cloud-refreshed, sensor-fused spatial layers capable of sub-10-centimeter accuracy. This transition gained momentum after the European Commission allocated EUR 1.8 billion under Horizon Europe for intelligent transport corridor digitization through 2027 [3]. OEMs now treat mapping not as an infotainment add-on but as a safety-critical tier-one subsystem.

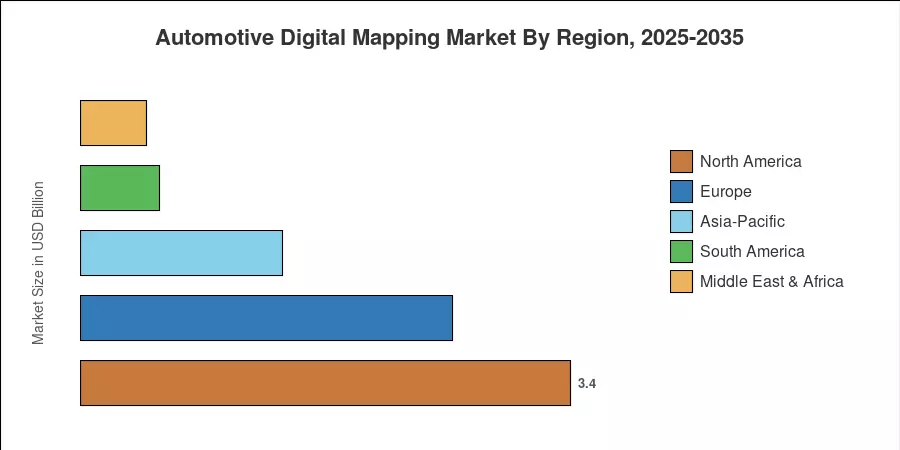
North America commands approximately 37% of the automotive digital mapping market, driven by Silicon Valley mapping investments and federal ADAS mandates. Asia-Pacific is the fastest-growing region with an estimated CAGR of 15.2%, fueled by Chinese and Japanese OEM demand. Europe holds a roughly 28% share, anchored by Germany's automotive corridor programs. As vehicle autonomy levels increase from L2+ to L3 and L4 through 2035, the mapping layer becomes the operational backbone of every self-driving platform.


Key Report Takeaways

• By Component

  • Solutions dominate the automotive digital mapping market with approximately 64% revenue share in 2025, reflecting OEM preference for integrated map platforms over standalone service contracts.
  • Services are expanding at a CAGR of 15.1% as fleet operators and ride-hail platforms demand real-time map update subscriptions.

• By Application

  • The autonomous cars segment generated approximately USD 3.45 billion in 2025, reflecting the capital intensity of L3+ mapping requirements.
  • ADAS applications represent the fastest-growing segment in the automotive digital mapping market at roughly 14.8% CAGR, driven by Euro NCAP and NHTSA mandates.
  • Fleet management holds a steady 22% application share, benefiting from logistics digitization across e-commerce supply chains.

• By Region

  • North America accounts for the largest share of the automotive digital mapping market, estimated at 37% of global revenue.
  • Asia-Pacific is projected to grow at 15.2% CAGR through 2035.
  • Europe contributes approximately USD 2.58 billion in 2025 base-year revenues.


Market Size and Forecast (2021–2035)

Market Research Future's sizing methodology triangulates top-down revenue analysis from OEM mapping procurement budgets with bottom-up licensing and subscription data from mapping vendors. Historical figures rely on verified company filings and regional trade data, while forward projections apply segment-adjusted growth modeling calibrated against macroeconomic and regulatory pipelines.

Automotive Digital Mapping Market Size and Forecast
Our Impact
Enabled $4.3B Revenue Impact for Fortune 500 and Leading Multinationals
Partnering with 2000+ Global Organizations Each Year
30K+ Citations by Top-Tier Firms in the Industry

Driver Impact Analysis

Driver ~% Impact on CAGR Geographic Relevance Impact Timeline
L3/L4 autonomous vehicle commercialization +3.2% Global Long-term (≥4 yr)
ADAS regulatory mandates (Euro NCAP, NHTSA) +2.5% North America, Europe Short-term (≤2 yr)
Connected car penetration growth +2.1% Global Medium-term (2–4 yr)
5G/V2X network rollouts +1.8% Asia-Pacific, North America Medium-term (2–4 yr)
Fleet digitization and logistics optimization +1.5% Global Short-term (≤2 yr)
Smart city and intelligent transport corridor investment +1.3% Europe, Asia-Pacific Long-term (≥4 yr)
Location-based services monetization +0.9% North America, Europe Medium-term (2–4 yr)


L3/L4 Autonomous Vehicle Commercialization

The commercialization of Level 3 and Level 4 autonomous cars provides the automotive digital mapping market with its greatest long-term growth vector. For lane-level localization, Mercedes-Benz's DRIVE PILOT system, which is approved for L3 highway driving in Germany and a few US states, uses centimetre-precision map layers that are updated on a regular basis [9]. By 2024, Waymo's L4 robotaxi fleet in Phoenix and San Francisco used more than 20 petabytes of geographic data per year, demonstrating the linear scaling of per-vehicle mapping intensity with fleet size. Every new certified corridor translates directly into mapping vendor revenue as L3 regulatory certifications spread to South Korea, Japan, and the UK through 2028.


ADAS Regulatory Mandates

Regulatory bodies are converting mapping from an optional feature into a compliance requirement. The EU General Safety Regulation, effective July 2024, mandates intelligent speed assistance and emergency lane-keeping for all new vehicles — both systems that perform best with map-aware contextual data [7]. NHTSA's proposed rulemaking on automatic emergency braking, finalized in 2024, similarly incentivizes OEMs to integrate predictive map data for curve-speed and intersection awareness. These mandates expand the addressable vehicle base for the automotive digital mapping market well beyond premium segments.

Connected Car Penetration

Global connected car shipments are expected to exceed 76 million units annually by 2028, up from an estimated 52 million in 2024, according to GSMA Intelligence [10]. Each connected vehicle becomes a potential subscriber to over-the-air map update services, transforming the automotive digital mapping market from a one-time licensing model into a recurring-revenue platform. OEMs like BMW and Stellantis are embedding connectivity SIMs as standard across all trim levels, lowering the adoption barrier.

5G and V2X Network Deployments

South Korea completed nationwide 5G coverage across all major expressways by 2024, and China's Ministry of Industry and Information Technology approved C-V2X deployment across 28 pilot cities [11]. These networks enable real-time map refresh cycles measured in seconds rather than weeks, a capability essential for construction-zone re-routing and dynamic lane management. The automotive digital mapping market benefits directly as telecom infrastructure investment reduces latency constraints that previously limited cloud-based map services.


Restraints Impact Analysis

Restraint ~% Impact on CAGR Geographic Relevance Impact Timeline
Data privacy and geospatial regulation −1.4% Europe, China Short-term (≤2 yr)
High upfront integration costs for OEMs −1.1% Global Medium-term (2–4 yr)
Fragmented mapping standards across regions −0.9% Global Long-term (≥4 yr)
Cybersecurity vulnerabilities in OTA map updates −0.7% North America, Europe Medium-term (2–4 yr)
Limited digital infrastructure in emerging markets −0.5% South America, MEA Long-term (≥4 yr)


Data Privacy and Geospatial Regulation

China's 2022 regulation on surveying and mapping data restricts the export and processing of high-precision geospatial data, forcing foreign mapping vendors to partner with licensed domestic entities like NavInfo or AutoNavi [14]. Europe's GDPR intersects with mapping when vehicle-generated probe data includes personally identifiable location trails. These regulatory layers add compliance costs and slow cross-border product launches, constraining the automotive digital mapping market in its two largest regional segments.

High Integration Costs for OEMs

It takes specialized computation units, verified sensor-fusion pipelines, and continuous data-hosting agreements to integrate centimetre-precision map stacks into vehicle E/E designs. For L3-ready platforms, McKinsey calculates the per-vehicle mapping integration cost to be between $120 and $180, which adds up over fleets of millions of vehicles [15]. This expense continues to be a major adoption barrier for mass-market OEMs with narrow profit margins, concentrating demand in luxury car segments.


Fragmented Standards

The absence of a unified global standard for digital map data formats forces vendors to maintain parallel product variants. HERE uses NDS. Live, TomTom supports OpenLR, and Chinese players use proprietary schemas mandated by national standards bodies [16]. Interoperability friction slows the development cycle for the automotive digital mapping market and raises the total cost of ownership for multinational OEMs seeking a single-source mapping solution.


Automotive Digital Mapping Market Opportunities

Software-Defined Vehicle Map Platforms

As OEMs migrate to centralized compute architectures, the mapping layer shifts from embedded ROM to a cloud-updatable software service. This unlocks subscription-based revenue models where map freshness becomes a paid feature tier. Volkswagen's CARIAD unit and Stellantis's STLA platform both plan OTA map monetization from 2026 onward, expanding the addressable automotive digital mapping market beyond initial hardware licensing.

Emerging Market Leapfrog in Southeast Asia and Latin America

Southeast Asian ride-hail operators like Grab and Gojek are investing in proprietary street-level mapping to reduce dependency on global providers. Indonesia's national mapping agency, BIG, launched a USD 85 million digital twin road initiative in 2024 [18]. Latin American logistics corridors between São Paulo and Buenos Aires present similar greenfield mapping demand. The automotive digital mapping market stands to capture significant incremental revenue as these regions bypass legacy navigation tiers entirely.

Data Monetization via Anonymized Probe Analytics

Mapping platforms sit atop a treasure trove of real-time traffic flow, road conditions, and weather-hazard data. HERE and TomTom already license anonymized probe datasets to insurance companies, municipal planners, and advertising networks [13]. As vehicle fleets grow more connected, probe-data monetization could contribute an estimated 12–15% of total mapping vendor revenue by 2030, creating an adjacent revenue stream for the automotive digital mapping market.

Regulatory-Driven Corridor Digitization

The EU's proposed TEN-T revision requires all core network motorways to support cooperative intelligent transport systems by 2030, implying a digital map baseline across 45,000 km of European highways [3]. Similar programs under China's Transport Powerhouse Strategy and Japan's SIP-adus Phase 3 designate specific corridors for L4 automated freight. Each mandated corridor converts from a future opportunity into a contracted revenue event for the automotive digital mapping market.

Integration with Digital Twin and Simulation Ecosystems

Every year, billions of simulated driving kilometres are used by autonomous car engineers, and each simulation necessitates a photorealistic, physics-accurate map. Real-world map data is licensed as simulation-grade assets for Nvidia's Omniverse and Cognata's simulation platforms [19]. Beyond in-car deployment, this new use case broadens the automotive digital mapping market to include the whole AV development toolchain.


Automotive Digital Mapping Market Future Outlook

AI-Native Mapping and Autonomous Operations

Machine learning is shifting map creation from manual survey fleets to automated pipelines that process dashcam and LiDAR data at a continental scale. Mobileye's Road Experience Management system crowdsources map updates from over 1.5 million equipped vehicles [23]. By 2030, the automotive digital mapping market will see AI-driven map compilation reduce per-kilometer production costs by an estimated 60–70%, democratizing access for mid-tier OEMs and emerging-market operators.

Platform Economics and Ecosystem Lock-In

Mapping is evolving into a platform game. Navigation, traffic analytics, EV charging locators, and insurance telematics all share a similar spatial layer in location-data ecosystems being built by HERE, TomTom, and Google. Vendors with the broadest data flywheel will be rewarded more and more in the automotive digital mapping industry; more vehicles feeding probe data enhance map quality, which draws more OEM contracts, which adds more vehicles. By 2032, platform-integrated mapping contracts are expected to make up more than 55% of new OEM sales, according to IHS Markit.


Electrification and Range-Aware Routing

The global EV fleet is expected to surpass 230 million units by 2030, per IEA projections [25]. Every EV requires energy-aware routing that factors elevation, temperature, charging station availability, and real-time battery state into navigation capabilities absent from legacy map stacks. The automotive digital mapping market is expanding its scope beyond road geometry into energy-topology layers, with TomTom's EV Routing API and HERE's EV charge-aware maps already deployed across multiple OEM platforms.

ESG Reporting and Carbon-Optimized Navigation

Corporate fleet operators face increasing Scope 3 emissions reporting requirements under the EU's Corporate Sustainability Reporting Directive and California's Climate Accountability Acts. Mapping vendors are responding with carbon-optimized routing engines that select the lowest-emission paths based on traffic, gradient, and vehicle type. The automotive digital mapping market stands to benefit as ESG compliance transforms route optimization from a convenience feature into an auditable regulatory deliverable.


Automotive Digital Mapping Market Segmentation

By Component

Segment Key Metric Primary Demand Driver
Solutions ~64% share (2025) OEM demand for integrated platform licensing
Services ~CAGR 15.1% Fleet OTA update subscriptions and consulting


Solutions represent the dominant revenue source in the automotive digital mapping market, encompassing on-premise map databases, cloud-hosted spatial platforms, and embedded navigation SDKs. OEMs overwhelmingly prefer bundled solution contracts that include map data, rendering engines, and localization middleware in a single license. HERE's HD Live Map and TomTom's ORBIS platform exemplify this integrated approach, delivering pre-validated map stacks that plug directly into ADAS and autonomous driving domain controllers.

Services are accelerating faster as the industry pivots toward recurring-revenue models. Real-time map refresh subscriptions, fleet analytics dashboards, and custom mapping consultancy collectively form the services segment. Ride-hail operators, last-mile delivery companies, and municipal transit authorities are the primary subscribers, valuing continuous data freshness over one-time licensing.

By Application

Segment Key Metric Primary Demand Driver
Autonomous Cars ~USD 3.45 B (2025) L3/L4 localization and path planning
ADAS ~CAGR 14.8% Euro NCAP and NHTSA compliance mandates
Fleet Management ~22% share (2025) Logistics optimization and route efficiency


The autonomous cars application segment commands the highest absolute revenue in the automotive digital mapping market, reflecting the capital-intensive nature of L3 and L4 map requirements. Each autonomous vehicle requires multi-layer spatial data — including lane markings, signage semantics, traffic-signal phasing, and 3D structural models — refreshed at intervals ranging from daily to sub-hourly depending on operational domain. Waymo, Cruise, Motional, and Pony.ai are among the largest consumers of this data class.

ADAS applications represent the fastest-growing segment by CAGR, driven by regulatory mandates rather than consumer choice. As Euro NCAP tightens star-rating criteria to include map-aware intelligent speed assist and predictive emergency braking, every new European vehicle effectively becomes a mapping customer. The fleet management application segment remains a steady contributor, with logistics operators using map data for predictive ETAs, geo-fenced compliance, and fuel-optimized routing across long-haul corridors.

By Geography

Region Key Metric Primary Demand Driver
North America ~37% share (2025) AV investment, federal ITS funding
Europe ~28% share (2025) Regulatory mandates, OEM R&D clusters
Asia-Pacific ~CAGR 15.2% NEV volumes, C-V2X rollouts
South America ~USD 0.55 B (2025) Logistics corridors, ride-hail platforms
Middle East & Africa ~5% share (2025) Smart city megaprojects, mining fleets


The geographic segmentation of the automotive digital mapping market mirrors the global distribution of autonomous vehicle testing and ADAS adoption. North America and Europe together account for nearly two-thirds of global revenue, though Asia-Pacific's higher growth rate signals a rebalancing over the forecast period. Country-level dynamics are detailed in Section 7.


Regional Market Share Analysis

Region Key Metric Primary Investment Themes
North America ~37% global share Robotaxi mapping, ADAS compliance, and federal ITS funding
Europe ~USD 2.58 B (2025) TEN-T corridor digitization, Euro NCAP mandates
Asia-Pacific ~15.2% CAGR NEV integration, C-V2X pilot cities, domestic mapping platforms
South America ~USD 0.55 B (2025) Logistics corridor mapping, ride-hail demand
Middle East & Africa ~5% global share Smart city programs, oil-sector fleet management
Total USD 9.20 B (2025)

The automotive digital mapping market displays a pronounced concentration in North America and Europe, though Asia-Pacific's growth trajectory is reshaping the competitive balance. Investment themes vary sharply by region — North America prioritizes L4 robotaxi infrastructure, Europe leans on regulatory-mandated ADAS corridors, and Asia-Pacific benefits from massive NEV production volumes.


North America

Country Key Metric Key Driver
United States ~81% of regional share AV testing corridors, NHTSA ADAS rulemaking
Canada ~CAGR 13.1% Ontario AV testing programs, cold-weather map validation
Mexico ~USD 0.14 B (2025) Nearshoring OEM assembly, logistics digitization


The United States anchors the North American automotive digital mapping market through the intersection of private AV investment and federal infrastructure spending. The 2021 Infrastructure Investment and Jobs Act directed USD 7.5 billion to EV infrastructure with embedded ITS requirements, portions of which flow into mapping-grade road digitization [20]. Waymo, Cruise, and Zoox collectively operate across 15 US metropolitan areas, each requiring continuously refreshed spatial datasets. Canada's Ontario province hosts Tier 1 supplier test facilities specializing in winter-condition map validation, while Mexico's growing role as a nearshored vehicle assembly hub is pulling map integration requirements southward.

Europe

Country Key Metric Key Driver
Germany ~32% of regional share OEM mapping R&D (BMW, Mercedes, VW)
United Kingdom ~CAGR 14.0% Automated Lane Keeping System approval, London AV trials
France ~USD 0.34 B (2025) Renault-Nissan mapping alliance, Toulouse AV corridor
Italy ~9% of regional share Stellantis STLA Brain platform integration
Spain ~CAGR 12.8% Barcelona smart mobility zone, SEAT digitization
Nordic Countries ~USD 0.21 B (2025) Winter-resilient mapping R&D, Volvo/Zenseact
Russia ~3% of regional share Yandex mapping platform, domestic fleet telematics
Rest of Europe ~CAGR 12.5% EU Cohesion Fund-supported ITS deployment


Germany represents the technological epicenter of Europe's automotive digital mapping market. HERE Technologies, headquartered in Eindhoven but operationally centered in Berlin, supplies mapping data to BMW, Mercedes-Benz, and Audi under a consortium investment structure. The UK became the first European nation to approve Automated Lane Keeping Systems in 2024, catalyzing map vendor activity. France's Toulouse-Bordeaux autonomous freight corridor and the Nordics' emphasis on adverse-weather robustness add specialized demand vectors across the region.

Asia-Pacific

Country Key Metric Key Driver
China ~44% of regional share NavInfo/Baidu dominance, NEV mapping mandates
Japan ~USD 0.42 B (2025) SIP-adus L4 freight corridors, Dynamic Map Platform
India ~CAGR 16.3% MapmyIndia expansion, ONDC logistics platform
South Korea ~12% of regional share Nationwide 5G-V2X, Hyundai-Kia integration
ASEAN ~CAGR 15.8% Grab/Gojek mapping, Thailand EV hub
Rest of Asia-Pacific ~USD 0.09 B (2025) Australia ITS corridors, NZ transport digitization


China's regulatory framework shapes the Asia-Pacific automotive digital mapping market decisively. Only domestically licensed entities may collect and process high-precision road data, giving NavInfo, Baidu, and AutoNavi (Alibaba) an effective oligopoly within the world's largest NEV producer [14]. Japan's Dynamic Map Platform consortium — backed by Mitsubishi Electric, Zenrin, and six OEMs — targets L4-ready highway maps across all national expressways by 2028 [21]. India's MapmyIndia (CE Info Systems) is scaling rapidly on the back of domestic EV adoption and government logistics digitization programs.

South America

Country Key Metric Key Driver
Brazil ~58% of regional share São Paulo logistics mapping, Stellantis Latin America ops
Argentina ~CAGR 11.9% Agricultural fleet GPS modernization
Rest of South America ~USD 0.10 B (2025) Chile mining fleet telematics, Colombia ride-hail growth


Brazil dominates South America's automotive digital mapping market through its combination of massive urban logistics networks and Stellantis's regional production footprint. São Paulo alone hosts over 8 million registered vehicles, creating dense probe-data generation and navigation demand. Agricultural fleet operators across Argentina's Pampas region are upgrading from basic GPS to precision-mapped guidance systems, while Chile's mining industry invests in autonomous haul-truck mapping for open-pit operations.

Middle East & Africa

Country Key Metric Key Driver
Saudi Arabia ~31% of regional share NEOM smart city, Vision 2030 transport modernization
UAE ~CAGR 14.5% Dubai RTA autonomous transit strategy
South Africa ~USD 0.06 B (2025) Mining fleet telematics, Johannesburg ITS
Egypt ~CAGR 12.0% New Administrative Capital smart transport grid
Rest of MEA ~22% of regional share GCC logistics corridors, Nairobi mobility platforms


The Middle East automotive digital mapping market benefits from concentrated smart city megaprojects. Saudi Arabia's NEOM and The Line projects incorporate L4-ready autonomous transport mapping from inception, with contracts awarded to international mapping vendors partnered with local systems integrators [22]. Dubai's Roads and Transport Authority targets 25% autonomous trip share by 2030, requiring comprehensive high-definition map coverage across the emirate. African demand remains nascent but is emerging through mining fleet digitization in South Africa and ride-hail mapping needs in Nairobi and Lagos.


Automotive Digital Mapping Market By Region, 2025-2035

Competitive Benchmarking

The automotive digital mapping market exhibits low concentration, with an estimated HHI below 1,200 and the top five players collectively holding approximately 48–55% of global revenue. The landscape is fragmented across pure-play mapping providers, tech conglomerates with mapping divisions, and regionally protected national champions. Competitive differentiation hinges on data freshness, geographic coverage breadth, OEM integration depth, and the ability to serve both ADAS and full-autonomy use cases from a unified platform.

Company Est. Revenue Share Range Key Offerings Strategic Positioning
HERE Technologies ~12–16% HD Live Map, ORBIS, fleet analytics platform Broadest OEM consortium backing (BMW, Mercedes, Audi); strong in ADAS and L4
TomTom ~10–14% ORBIS Maps, EV Routing, Traffic Stats Independent platform strategy; deep European OEM relationships
Google (Alphabet) ~8–12% Google Maps Platform, Waymo HD maps Consumer and enterprise mapping scale; captive L4 robotaxi demand
Mobileye (Intel) ~6–9% REM crowdsourced mapping, SuperVision Largest crowdsourced probe fleet; vertically integrated ADAS-to-L4 pipeline
NavInfo ~5–8% HD mapping China, ADAS map services Dominant domestic player in China's regulated mapping landscape
Baidu ~4–7% Apollo HD Map, an intelligent driving platform Integrated AV stack with captive robotaxi demand across Chinese cities
Apple ~3–6% Apple Maps, a custom EV mapping platform Closed ecosystem; maps tied to CarPlay and rumored EV program
Mapbox ~3–5% Navigation SDK, Vision SDK, live traffic Developer-friendly platform; strong in ride-hail and logistics segments
Qualcomm ~2–4% Snapdragon Ride, connected car mapping stack Chipset-mapping integration; embedded in next-gen automotive SoCs
Dynamic Map Platform (DMP) ~2–3% Japan L4 HD map infrastructure Government-backed consortium; sole provider for Japan's expressway HD maps


Recent News & Developments


  • TomTom (January 2025): Signed a multi-year global contract with Stellantis to supply ORBIS HD maps across 14 vehicle brands, replacing legacy HERE licenses in select platforms [6].
  • Mobileye (November 2024): Expanded its Road Experience Management fleet to 2 million vehicles globally, achieving sub-weekly map refresh cycles across North America and Europe [23].
  • Baidu (September 2024): Received approval from Beijing authorities to operate fully driverless Apollo Go robotaxis in five new urban zones, each requiring real-time HD map maintenance [8].
  • European Commission (July 2024): Published implementing acts under the EU General Safety Regulation mandating intelligent speed assistance in all new M1 vehicles, explicitly referencing map-based speed-limit data as a compliance pathway [7].
  • NavInfo (May 2024): Partnered with Huawei's intelligent automotive solutions unit to co-develop a joint HD mapping and V2X platform for Chinese OEMs [14].


  • NHTSA (April 2024): Finalized automatic emergency braking requirements for all new passenger vehicles by 2029, incentivizing predictive map integration for intersection and curve-speed awareness [7].


Automotive Digital Mapping Market Report Scope

Parameter Detail
Market Scope Global automotive digital mapping market by component, application, and geography
Study Period 2021–2035
CAGR 13.6% (2026–2035)
Base Year Market Size USD 9.20 Billion (2025)
Forecast Endpoint USD 32.95 Billion (2035)
Fastest Growing Segment ADAS (by application, ~14.8% CAGR); Asia-Pacific (by region, ~15.2% CAGR)
Companies Profiled HERE Technologies, TomTom, Google, Mobileye, NavInfo, Baidu, Apple, Mapbox, Qualcomm, Dynamic Map Platform
Valuation Currency USD (constant 2025 dollars)


FAQs

How do mapping vendors differentiate when the underlying road geometry data is largely commoditized?

Differentiation centers on refresh speed, semantic richness, and ecosystem breadth. Vendors compete on how quickly construction zones and lane closures reach the vehicle, and on value-added layers like EV energy topology and parking availability.

What contractual models dominate OEM–mapping vendor relationships?

Most OEMs use hybrid licensing, combining an upfront platform fee with per-vehicle royalties and annual data-refresh subscriptions. Volume tiers and exclusivity windows are the primary negotiation levers [6].

How does map data quality affect autonomous vehicle insurance premiums?

Insurers increasingly tie premiums to verified map freshness. Vehicles operating in well-mapped L3 corridors with sub-weekly updates qualify for 8–12% lower autonomy-related premiums compared to those relying on monthly refresh cycles [17].

What role do crowdsourced probe data models play versus dedicated survey fleets?

Crowdsourced models from companies like Mobileye achieve continental coverage at a fraction of survey fleet costs. However, dedicated fleets remain necessary for initial high-definition baseline creation in unmapped regions [23].

How should fleet operators evaluate mapping vendor lock-in risk?

Operators should prioritize vendors supporting open standards like NDS. Live and OpenLR, and negotiate data portability clauses. Multi-vendor strategies add cost but reduce dependency on any single provider's refresh commitments [16].

What cybersecurity certifications should buyers require for OTA map update systems?

Buyers should mandate ISO/SAE 21434 compliance and UN Regulation 155 certification for the entire map delivery pipeline. These standards ensure threat analysis, secure boot, and encrypted transmission are validated end-to-end [17].

How will the automotive digital mapping market respond if L4 autonomous deployment timelines slip further?

ADAS mandates provide a regulatory floor that sustains demand regardless of L4 delays. L2+ and L3 map requirements already account for roughly 60% of current revenue, insulating the market from full-autonomy timeline risk [7].


Author
Author
Author Profile
Shubham Munde LinkedIn
Team Lead - Research
Shubham brings over 7 years of expertise in Market Intelligence and Strategic Consulting, with a strong focus on the Automotive, Aerospace, and Defense sectors. Backed by a solid foundation in semiconductors, electronics, and software, he has successfully delivered high-impact syndicated and custom research on a global scale. His core strengths include market sizing, forecasting, competitive intelligence, consumer insights, and supply chain mapping. Widely recognized for developing scalable growth strategies, Shubham empowers clients to navigate complex markets and achieve a lasting competitive edge. Trusted by start-ups and Fortune 500 companies alike, he consistently converts challenges into strategic opportunities that drive sustainable growth.
Co-Author
Co-Author Profile
Aarti Dhapte LinkedIn
AVP - Research
A consulting professional focused on helping businesses navigate complex markets through structured research and strategic insights. I partner with clients to solve high-impact business problems across market entry strategy, competitive intelligence, and opportunity assessment. Over the course of my experience, I have led and contributed to 100+ market research and consulting engagements, delivering insights across multiple industries and geographies, and supporting strategic decisions linked to $500M+ market opportunities. My core expertise lies in building robust market sizing, forecasting, and commercial models (top-down and bottom-up), alongside deep-dive competitive and industry analysis. I have played a key role in shaping go-to-market strategies, investment cases, and growth roadmaps, enabling clients to make confident, data-backed decisions in dynamic markets.

Research Approach


Secondary Research

The secondary research process involved comprehensive analysis of regulatory databases, industry publications, technical standards, and authoritative transportation organizations. Key sources included the US Department of Transportation (DOT), National Highway Traffic Safety Administration (NHTSA), European Commission Directorate-General for Mobility and Transport (DG MOVE), European GNSS Agency (GSA), European Space Agency (ESA), Japan Ministry of Land, Infrastructure, Transport and Tourism (MLIT), China Ministry of Transport, Bureau of Transportation Statistics (BTS), US Geological Survey (USGS), National Oceanic and Atmospheric Administration (NOAA), Federal Aviation Administration (FAA) for drone mapping regulations, International Organization for Standardization (ISO/TC 204) for intelligent transport systems, Open Geospatial Consortium (OGC), Society of Automotive Engineers (SAE International), International Telecommunication Union (ITU), World Road Association (PIARC), OECD International Transport Forum, United Nations Economic Commission for Europe (UNECE) WP.29 vehicle regulations, National Institute of Standards and Technology (NIST), and national mapping agencies including Ordnance Survey (UK), Bundesamt für Kartographie (Germany), and National Geographic Information Institute (South Korea). These sources were used to collect autonomous vehicle testing data, HD mapping standards, satellite navigation policies, road infrastructure statistics, regulatory frameworks for autonomous driving, and competitive landscape analysis for 3D mapping, satellite mapping, indoor mapping, and outdoor mapping technologies.


Primary Research

Supply-side and demand-side stakeholders were interviewed during the primary research phase in order to gather both qualitative and quantitative information. CEOs, VPs of Engineering, heads of Autonomous Driving/ADAS divisions, and product directors from tier-1 suppliers, automakers, and digital mapping companies were examples of supply-side sources. Fleet managers, autonomous vehicle operators, urban planners, and procurement leads from ride-hailing services, logistics firms, smart city authorities, and automakers were among the demand-side sources. Market segmentation, HD mapping development schedules, and information on LiDAR adoption trends, cloud-based mapping service costs, and data monetization tactics were all verified by primary research.

Primary Respondent Breakdown:

By Designation: C-level Primaries (32%), Director Level (31%), Others (37%)

By Region: North America (32%), Europe (30%), Asia-Pacific (33%), Rest of World (5%)


Market Size Estimation

Global market valuation was derived through revenue mapping and deployment volume analysis. The methodology included:

Identification of 40+ key mapping technology providers and automotive integrators across North America, Europe, Asia-Pacific, and Middle East

Technology mapping across 3D mapping, satellite mapping, indoor mapping, and outdoor mapping solution categories

Analysis of reported and modeled annual revenues specific to automotive digital mapping portfolios

Coverage of providers representing 65-70% of global market share in 2024

Extrapolation using bottom-up (vehicle deployment volume × mapping service ASP by country) and top-down (provider revenue validation) approaches to derive segment-specific valuations

Download Free Sample

Kindly complete the form below to receive a free sample of this Report

Download PDF ×

We do not share your information with anyone. However, we may send you emails based on your report interest from time to time. You may contact us at any time to opt-out.