Segmentation Quick Reference
| Dimension | Sub-Segments | Dominant Segment | Fastest Growing Segment |
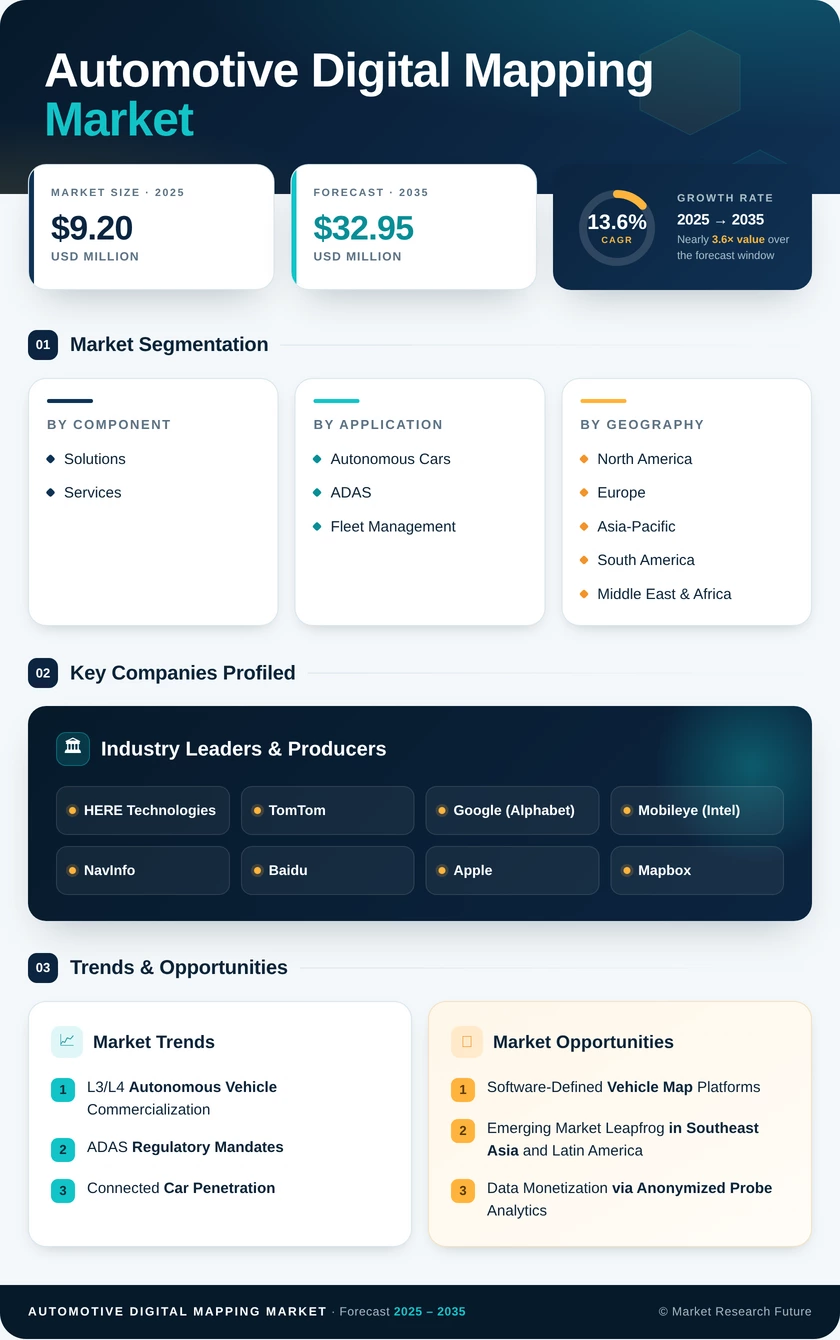
| By Component | Solutions, Services | Solutions (~64% share, 2025) | Services (~15.1% CAGR) |
| By Application | Autonomous Cars, ADAS, Fleet Management | Autonomous Cars (~USD 3.45 B, 2025) | ADAS (~14.8% CAGR) |
| By Geography | North America, Europe, Asia-Pacific, South America, Middle East & Africa | North America (~37% share, 2025) | Asia-Pacific (~15.2% CAGR) |
Market Segmentation Overview
By Component
| Sub-Segment | Key Trend |
| Solutions | Migration from static on-premise databases to cloud-hosted, OTA-updatable spatial platforms integrated into vehicle domain controllers |
| Services | Shift from one-time consulting engagements to subscription-based real-time map refresh and fleet analytics services |
The component dimension reflects the industry's broader transition from capex-heavy map licensing to opex-driven service subscriptions. Solutions retain revenue dominance because OEMs bundle map data, rendering engines, and localization software into unified platform contracts. Services are closing the gap as fleet operators and mobility platforms demand continuously refreshed spatial data rather than periodic map updates.
By Application
| Sub-Segment | Key Trend |
| Autonomous Cars | Rising L3/L4 regulatory approvals expand the corridor-specific mapping addressable market |
| ADAS | Euro NCAP and NHTSA mandates convert map-aware safety features from optional to standard equipment |
| Fleet Management | E-commerce logistics growth and ESG-driven route optimization fuel fleet-mapping adoption |
Application segmentation reveals the dual demand structure of the automotive digital mapping market: regulatory push (ADAS mandates) and technology pull (autonomous vehicle development). Fleet management serves as the steady-state demand base, while autonomous cars and ADAS drive incremental growth through higher per-vehicle data intensity and broader vehicle-class penetration.
By Geography
| Sub-Segment | Key Trend |
| North America | Robotaxi scaling and federal ITS investment anchor the largest regional market |
| Europe | TEN-T corridor mandates and Euro NCAP tightening drive compliance-led mapping procurement |
| Asia-Pacific | Chinese NEV volumes and government-backed V2X pilot programs fuel the fastest regional growth |
| South America | Urban logistics digitization in Brazil and agricultural fleet modernization in Argentina |
| Middle East & Africa | Smart city megaprojects (NEOM, Dubai) and mining fleet telematics create concentrated demand pockets |
Geographic segmentation underscores how policy environments shape demand patterns. Mature markets in North America and Europe are driven by regulatory compliance and OEM R&D clustering, while emerging regions in Asia-Pacific, South America, and MEA exhibit higher growth rates as they build digital transport infrastructure from the ground up.