Automotive Electronics Market (2026 - 2035)

Automotive Electronics Market Research Report By Application (Advanced Driver Assistance Systems, Infotainment and Communication, Powertrain Electronics, Safety Systems, Body Electronics, Others), By Component Type (Electronic Control Units, Sensors, Current-Carrying Devices, Displays and HMI, Others), By Vehicle Type (Passenger Vehicles, Commercial Vehicles), By Propulsion Type (ICE, Hybrid, Electric), By End-Use (OEM, Aftermarket), By Sales Channel (Direct, Distributors, Online) and By Regional (North America, Europe, South America, Asia Pacific, Middle East and Africa) - Forecast to 2035
ID: MRFR/AT/2847-HCR
188 Pages
Triveni Bhoyar, Swapnil Palwe
Last Updated: August 27, 2026
Automotive Electronics Market
Market Size
Forecast Period2026-2035
CAGR (2026-2035)8.3%
2025 Market SizeUSD 276.2 Billion
2035 Market SizeUSD 613.1 Billion
Key Players
Robert Bosch GmbH
DENSO Corporation
Continental AG
ZF Friedrichshafen AG
Aptiv PLC
Hyundai Mobis
Opportunities
  • Silicon Carbide Beyond the Premium Tier
  • Aftermarket Retrofit in Ageing Fleets
  • Emerging-Market Localization

Automotive Electronics Market Summary

The Automotive Electronics Market reached USD 276.2 billion in 2025 and opens the forecast window at USD 299.1 billion in 2026, climbing to USD 613.1 billion by 2035 at an 8.3% CAGR. Two catalysts anchor that trajectory. The European Union's General Safety Regulation, fully applicable to all new vehicle registrations since July 2024, forces a minimum electronic content floor onto every unit sold in the bloc [7]. Alongside it, the U.S. CHIPS and Science Act has committed more than USD 52 billion in fabrication and R&D support, a share of which is already flowing into automotive-grade nodes [13].

Steel is being replaced by silicon as the differentiating input. Consolidated domain and zone controllers operating abstracted software stacks are replacing distributed harness architectures with 80 to 120 discrete controllers. This transition results in a semiconductor value per vehicle increasing from approximately USD 500 in a 2020 internal-combustion model to USD 1,400 in a 2030 electric model [21]. In comparison to any other tier-one category, the Automotive Electronics Market is absorbing that reallocation at a fast pace.

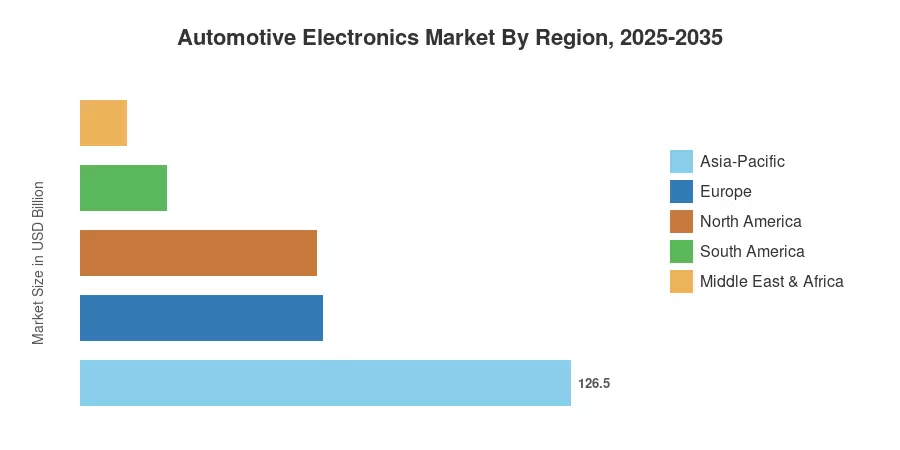
China's electric-vehicle volume and the depth of Korean-Japanese component supply are the primary drivers of Asia-Pacific's 45.8% share of 2025 revenue. Additionally, Asia-Pacific is the fastest-growing region, with a compound annual growth rate (CAGR) of 9.6%. Europe's growth rate is 22.6%, which is maintained by regulatory content mandates rather than unit growth. The Automotive Electronics Market will incentivize suppliers who possess the software layer, rather than merely the board, in the coming decade.


Key Report Takeaways

• By Component Type

  • Electronic Control Units account for 33.4% of 2025 component revenue, still the structural backbone of the Automotive Electronics Market
  • Sensor hardware is expanding at a 10.1% CAGR through 2035 as radar and camera counts per vehicle double.
  • Displays and human-machine interface hardware generated USD 42.0 billion in 2025

• By Application

  • Advanced Driver Assistance Systems hold 24.6% of application revenue, the single largest slice.
  • Powertrain electronics will grow at a 9.8% CAGR, the fastest application line in the Automotive Electronics Market.
  • OEM-fitted content represents USD 224.8 billion of 2025 demand

• By Region

  • Asia-Pacific commands 45.8% of global revenue
  • North America contributes USD 61.0 billion in 2025
  • Middle East & Africa posts an 8.7% CAGR from a small base


Market Size and Forecast (2021–2035)

Estimates blend vehicle production data from national registration authorities, semiconductor shipment statistics, tier-one segment reporting, and bill-of-materials teardowns across 42 representative vehicle platforms. Historical values are reconciled against reported automotive electronics revenue for the twelve largest suppliers, then triangulated top-down against global light-vehicle output. The Automotive Electronics Market forecast assumes no repeat of a 2021-scale allocation shortage.

Automotive Electronics Market Size and Forecast
Our Impact
Enabled $4.3B Revenue Impact for Fortune 500 and Leading Multinationals
Partnering with 2000+ Global Organizations Each Year
30K+ Citations by Top-Tier Firms in the Industry

Driver Impact Analysis

Driver ~% Impact on CAGR Geographic Relevance Impact Timeline
Rising ADAS content per vehicle +1.9 pp Global Medium-term (2–4 yr)
Electrification and battery management demand +1.6 pp Asia-Pacific, Europe Long-term (≥4 yr)
Software-defined vehicle compute consolidation +1.3 pp North America, Europe Long-term (≥4 yr)
Mandatory safety regulation +1.1 pp Europe, North America Short-term (≤2 yr)
Digital cockpit and display proliferation +0.9 pp Asia-Pacific Medium-term (2–4 yr)
Connectivity, telematics and OTA adoption +0.8 pp Global Medium-term (2–4 yr)
Semiconductor localization incentives +0.6 pp Global Long-term (≥4 yr)


Safety Regulation Sets a Content Floor

Regulation now dictates minimum electronic content in a way it never did a decade ago. EU Regulation 2019/2144 requires intelligent speed assistance, driver drowsiness detection, emergency lane-keeping and event data recorders on every new registration, adding an estimated USD 310 to USD 420 of electronics per vehicle [7]. NHTSA's FMVSS 127 rule, finalized in April 2024, mandates automatic emergency braking with pedestrian detection on all U.S. light vehicles by September 2029, a requirement that alone pulls roughly 16 million annual units into higher sensor specification [15]. Compliance is not optional, which makes this the most reliable demand line in the Automotive Electronics Market.

Electrification Reweights the Bill of Materials

Battery-electric platforms carry inverters, on-board chargers, DC-DC converters and battery management systems that do not exist in a combustion car. The International Energy Agency recorded more than 17 million electric vehicle sales in 2024, over one in five cars sold globally [3]. Each of those vehicles carries between USD 700 and USD 1,100 of incremental power semiconductor and control content, with silicon carbide penetration in traction inverters climbing past 25% on premium platforms [17].

Compute Consolidation Rewrites Supplier Economics

Architectural change is compressing controller counts while expanding silicon value. Migrating from federated boxes toward zonal architecture, automotive electronics cuts wiring harness mass by 15% to 20% and shortens assembly time, but concentrates value into a handful of high-performance system-on-chip devices [5]. Tier-one suppliers that cannot supply the middleware layer risk being designed out.

Localization Subsidies Reshape Supply Geography

Public capital is redrawing the fabrication map. The EU Chips Act targets a 20% share of global semiconductor output by 2030 with roughly EUR 43 billion mobilized, while India's PLI scheme for automotive components has approved incentives exceeding INR 259 billion against committed investment [13][19]. Both programs explicitly favor automotive-qualified capacity.


Restraints Impact Analysis

Restraint weightings reflect estimated drag on the compound growth rate under a base-case scenario. They are directional and interact — a supply disruption, for instance, amplifies pricing pressure in the following model year rather than acting independently.

Restraint ~% Impact on CAGR Geographic Relevance Impact Timeline
Semiconductor supply volatility and lead times −0.9 pp Global Short-term (≤2 yr)
Functional safety qualification cost and cycle time −0.7 pp Europe, North America Medium-term (2–4 yr)
OEM cost-down pressure and ASP deflation −0.6 pp Asia-Pacific Short-term (≤2 yr)
Cybersecurity compliance burden −0.5 pp Europe, Japan, South Korea Medium-term (2–4 yr)
Embedded software talent shortage −0.4 pp Global Long-term (≥4 yr)


Supply Fragility Has Not Been Solved

Lead times for mature-node microcontrollers have normalized but remain structurally longer than pre-2020 norms, and legacy 40nm to 90nm automotive capacity attracts limited new investment. Global semiconductor sales reached USD 627 billion in 2024, yet automotive accounted for under 11% of that total, leaving the sector a low-priority customer during allocation events [4]. A single fab interruption still propagates into production halts within eight weeks.

Certification Costs Compress Supplier Margins

Achieving ISO 26262 ASIL-D certification for a new controller typically consumes 18 to 30 months and USD 12 million to USD 25 million in engineering and validation spend before a single unit ships [8]. Smaller suppliers increasingly license pre-certified platforms rather than build, which concentrates the Automotive Electronics Market around a narrower set of qualified vendors.

Cybersecurity Obligations Add Permanent Overhead

UNECE Regulation No. 155 requires a certified cybersecurity management system for vehicle type approval across more than 60 contracting parties, and R156 imposes parallel obligations on software update management [12]. Compliance is recurring rather than one-time, adding an estimated 3% to 5% to lifetime program engineering cost.


Automotive Electronics Market Opportunities

Silicon Carbide Beyond the Premium Tier

Wide-bandgap devices remain concentrated in vehicles above USD 55,000. As 200mm SiC wafer capacity scales and device pricing falls toward parity, mid-market electric platforms become addressable — a shift that could add USD 9 billion to USD 13 billion of annual demand to the Automotive Electronics Market by 2032 [17]. Suppliers with secured substrate supply hold the advantage.

Aftermarket Retrofit in Ageing Fleets

Average light-vehicle age has reached 12.6 years in the United States and 12.5 years across the EU [16][18]. Retrofit telematics, dash-camera safety systems and connected diagnostics address a parc that will not turn over quickly, opening a channel largely independent of new-vehicle cycles.

Emerging-Market Localization

ASEAN and Latin American assembly hubs are attracting electronics content that previously arrived as finished imports. Brazil's MOVER program links tax credits to local technology investment and decarbonization targets, drawing tier-one electronics production toward São Paulo state [20]. Comparable dynamics are emerging in Thailand and Indonesia.

Data Monetization and Feature-on-Demand

Connected vehicles generate telemetry that supports usage-based insurance, predictive maintenance subscriptions and post-sale feature activation. Analysts estimate software and data services could contribute USD 250 billion to USD 400 billion of annual automotive industry revenue by 2030 [21], and capturing it requires exactly the compute and connectivity hardware the Automotive Electronics Market supplies.

Commercial Vehicle Digitalization

Fleet operators respond to measurable payback. Electronic braking, tyre-pressure telematics and driver monitoring cut insurance and fuel costs with documented ROI inside 24 months, making commercial platforms a faster adoption path than consumer vehicles for several sensing technologies.


Automotive Electronics Market Future Outlook

Centralized Compute Becomes Standard

By 2032, most volume platforms will run three to five high-performance compute nodes rather than 90 discrete controllers. That transition reallocates roughly 30% of Automotive Electronics Market value from commodity boxes toward system-on-chip devices, middleware and integration services [5].

Electrification Reaches Cost Parity

The International Energy Agency projects electric vehicles could approach one in three global sales by 2030 under stated policies [3]. Pack-level battery prices below USD 90/kWh remove the last structural cost gap, and every incremental electric unit carries measurably higher control and sensing content.

Autonomy Advances Unevenly

Conditional automation will scale in geofenced commercial applications long before private passenger cars. Robotaxi fleets in Phoenix, Shenzhen and Wuhan already log millions of driverless miles annually, validating sensor stacks that will later cascade into consumer platforms at lower cost points [24].

Sustainability Reporting Enters the Bill of Materials

Corporate Sustainability Reporting Directive obligations now require scope-three disclosure across supplier tiers, and OEMs are pushing embodied-carbon data requirements down to component level [25]. Suppliers able to document material provenance and energy intensity will win awards on criteria beyond price.


Automotive Electronics Market Segmentation

Segmentation within the Automotive Electronics Market follows application, component, vehicle, propulsion, end-use and channel dimensions.

By Application

Segment Metric (2025) Primary Demand Driver
Advanced Driver Assistance Systems 24.6% share Regulatory safety mandates
Powertrain Electronics 9.8% CAGR Electrification and hybrid complexity
Infotainment and Communication USD 54.7 Billion Connectivity and cockpit differentiation
Safety Systems 17.4% share Passive restraint electronics and monitoring
Body Electronics 12.7% share Comfort, lighting and access features
Others 4.2% share Diagnostics and auxiliary modules


Assistance systems lead because regulation removed the choice. Camera, radar and domain-controller content for a compliant Level 2 stack now runs USD 480 to USD 720 per vehicle, and that figure rises as pedestrian and cyclist detection become mandatory [1][15]. Powertrain electronics grow faster from a comparable base, driven by inverter and battery-management content that scales with electric penetration rather than with regulation.

By Component Type

Segment Metric (2025) Primary Demand Driver
Electronic Control Units 33.4% share Architectural backbone across all functions
Sensors 10.1% CAGR ADAS and monitoring proliferation
Current-Carrying Devices USD 51.4 Billion High-voltage distribution in electric platforms
Displays and HMI 15.2% share Cockpit screen size and count growth
Others 8.0% share Passives, connectors and semiconductors


Control units retain the largest share of the Automotive Electronics Market despite consolidation, because value migrates into fewer, more expensive units rather than disappearing. Sensors post the strongest growth: a 2020 mid-segment car carried roughly eight sensing nodes, while a 2030 equivalent will carry more than twenty [1].

By Vehicle Type

Segment Metric (2025) Primary Demand Driver
Passenger Vehicles 76.8% share Volume, feature competition, safety rules
Commercial Vehicles 9.1% CAGR Fleet telematics and safety retrofit economics


The vehicle type segment is dominated by passenger vehicles, holding a 76.8% share driven by volume production, feature competition, and safety regulations. Commercial vehicles represent the fastest-growing segment with a 9.1% compound annual growth rate, propelled by fleet telematics and safety retrofit economics.

By Propulsion Type

Segment Metric (2025) Primary Demand Driver
ICE 54.3% share Installed platform base and emissions control
Electric 13.2% CAGR Power conversion and battery management content
Hybrid 21.6% share Dual-system control complexity


The propulsion type segment is dominated by internal combustion engine vehicles with a 54.3% share anchored by established platform bases and emissions control. Hybrid variants capture a notable 21.6% share, while electric vehicles emerge as the fastest-growing segment exhibiting a 13.2% compound annual growth rate, driven by power conversion and battery management content.

By End-Use

Segment Metric (2025) Primary Demand Driver
OEM USD 224.8 Billion Factory-fit content mandated by regulation
Aftermarket 8.9% CAGR Ageing parc and retrofit safety systems


The end-use segment is led by original equipment manufacturers, accounting for USD 224.8 billion through factory-fit content mandated by regulations. Meanwhile, the aftermarket channel registers as a fast-growing segment with an 8.9% compound annual growth rate, sustained by an ageing vehicle parc and retrofit safety systems.

By Sales Channel

Segment Metric (2025) Primary Demand Driver
Direct 62.7% share Tier-one to OEM program contracts
Distributors 27.1% share Aftermarket and independent workshop supply
Online 11.4% CAGR E-commerce penetration in replacement parts


The sales channel segment is heavily dominated by the direct channel, commanding a 62.7% share driven by tier-one to OEM program contracts, followed by distributors holding 27.1% for aftermarket and workshop supply. Meanwhile, the online channel emerges as the fastest-growing segment with an 11.4% compound annual growth rate, fueled by e-commerce penetration in replacement parts.

Regional Market Share Analysis

Region Metric (2025) Primary Investment Themes
North America USD 61.0 Billion Safety mandates, onshoring, commercial telematics
Europe 22.6% share Regulatory content, premium cockpit, cybersecurity
Asia-Pacific 45.8% share EV volume, component supply depth, cost leadership
South America 8.0% CAGR Localization incentives, aftermarket retrofit
Middle East & Africa USD 11.9 Billion Fleet modernization, assembly diversification
Total USD 276.2 Billion

Geographic concentration in the Automotive Electronics Market tracks vehicle assembly footprint far more closely than consumption. Regional totals below reflect production-weighted revenue.


North America

Country Metric Key Driver
United States 82.4% of region FMVSS 127 automatic emergency braking mandate
Canada 9.1% of region Cross-border assembly integration
Mexico 7.9% CAGR Harness and electronics maquiladora expansion


Policy and production diverge in North America. Electric vehicle incentive rollbacks have softened battery-related content growth, yet safety regulation continues to lift baseline electronics regardless of powertrain. Mexico has become the region's assembly gravity centre, with electronics and harness exports to the United States exceeding USD 40 billion annually [16]. Suppliers are treating Monterrey and Querétaro as the default footprint for new capacity.

Europe

Country Metric Key Driver
Germany 26.8% of region Premium OEM domain controller programs
United Kingdom 14.2% of region ZEV mandate compliance
France USD 7.9 Billion Electrification and supplier consolidation
Italy 9.8% of region Commercial vehicle electronics
Spain 7.4% of region Volume assembly and export base
Nordic Countries 7.4% CAGR High EV penetration, connected services
Russia 5.3% of region Import-substituted local sourcing
Rest of Europe 17.0% of region Central European tier-one manufacturing


Content per vehicle, not unit volume, drives European growth. EU registrations remain below 2019 levels, but General Safety Regulation compliance and Euro 7 emissions monitoring requirements have raised electronics value on every unit [7]. Germany retains a disproportionate share because domain-controller architecture decisions for global platforms are still made in Stuttgart and Wolfsburg.

Asia-Pacific

Country Metric Key Driver
China 44.6% of region NEV volume and vertically integrated OEMs
Japan 17.3% of region Tier-one component export base
South Korea 11.8% of region Semiconductor and display supply chain
India 12.4% CAGR PLI incentives and BS-VI Phase II compliance
ASEAN 9.7% of region Assembly relocation from higher-cost bases
Rest of Asia-Pacific 6.2% of region Aftermarket and import demand


Scale and speed both favor the region. Chinese new-energy vehicle penetration crossed 45% of monthly domestic sales during 2025, and domestic OEMs increasingly design their own controllers rather than buying tier-one boxes [3][22]. That vertical integration compresses supplier margins even as it expands the Automotive Electronics Market in absolute terms. India represents the clearest incremental opportunity, with production-linked incentives explicitly targeting advanced automotive technology [19].

South America

Country Metric Key Driver
Brazil 61.5% of region MOVER program technology credits
Argentina USD 2.6 Billion Import liberalization and fleet renewal
Rest of South America 20.3% of region Aftermarket and used-vehicle electronics


Brazil anchors the region. The MOVER framework ties fiscal benefits to local R&D spending and emissions performance, pushing assemblers toward domestically sourced electronics rather than kit imports [20]. Flex-fuel powertrain control remains a distinctive local requirement that global platforms must accommodate.

Middle East & Africa

Country Metric Key Driver
Saudi Arabia 24.6% of region Vision 2030 automotive localization
South Africa 22.8% of region Export assembly for Europe
United Arab Emirates 9.4% CAGR Fleet telematics and connected mobility pilots
Egypt 11.5% of region Local assembly incentive programs
Rest of MEA 21.8% of region Aftermarket demand in ageing fleets


Ambition outpaces installed base here. Saudi Arabia's Public Investment Fund has backed domestic vehicle manufacturing with a stated target of 300,000 annual units by 2030, which would create the region's first meaningful electronics supply requirement outside South Africa [23]. Near-term revenue remains dominated by aftermarket and fleet retrofit.


Automotive Electronics Market By Region, 2025-2035

Competitive Benchmarking

Concentration sits in the medium band. The estimated Herfindahl-Hirschman Index for the Automotive Electronics Market falls between 620 and 780, with the top five suppliers holding roughly 33% to 40% of global revenue. Fragmentation increases sharply below the top tier, where hundreds of specialist module and semiconductor vendors compete on single-function scope.

Company Est. Revenue Share Range Key Offerings Strategic Positioning
Robert Bosch GmbH ~9–12% Domain controllers, radar, braking electronics Broadest portfolio; heavy software investment
DENSO Corporation ~6–9% Powertrain control, thermal electronics, sensors Toyota-aligned; strong hybrid expertise
Continental AG ~5–8% Cockpit displays, ADAS, connectivity units Restructuring toward software and architecture
ZF Friedrichshafen AG ~4–6% Chassis control, safety electronics, inverters Mechatronics integration strength
Aptiv PLC ~3–5% Signal distribution, compute platforms Architecture-led positioning; harness leadership
Hyundai Mobis ~3–5% Cockpit modules, ADAS, EV power electronics Captive volume with external expansion
Valeo SA ~3–4% Sensors, lighting electronics, thermal control Sensing and low-speed automation focus
Magna International ~2–4% Electrified powertrain, ADAS modules Contract manufacturing plus systems
Infineon Technologies ~2–4% Microcontrollers, power semiconductors, SiC Leading automotive semiconductor supplier
NXP Semiconductors ~2–3% Processors, radar chipsets, secure connectivity Compute and networking silicon
Renesas Electronics ~2–3% Automotive MCUs and SoCs Deep Japanese OEM relationships
Panasonic Automotive ~1–3% Infotainment, cockpit systems Cockpit and audio specialization


Recent News & Developments

  • NHTSA (April 2024): Finalized FMVSS 127 requiring automatic emergency braking with pedestrian detection on all U.S. light vehicles by September 2029, locking in sensor demand through the decade [15]
  • Infineon (June 2024): Began production at its Dresden Smart Power Fab, a EUR 5 billion facility targeting automotive power and analog devices [17]
  • Bosch (September 2024): Announced a EUR 250 million expansion of silicon carbide capacity at Roseville, California, aimed at traction inverter supply [26]
  • Aptiv (January 2025): Confirmed plans to separate its electrical distribution systems business, sharpening focus on vehicle compute architecture [27]
  • Renesas and Wolfspeed (March 2024): Expanded their multi-year silicon carbide wafer supply agreement to secure automotive-grade substrate volume [28]
  • European Commission (July 2024): General Safety Regulation became mandatory for all new vehicle registrations across the EU, not merely new type approvals [7]
  • Hyundai Mobis (November 2024): Opened an electrification components plant in Ulsan dedicated to power control units and battery systems [29]
  • UNECE (January 2025): Additional contracting parties brought R155 cybersecurity management system requirements into national type approval frameworks [12]


Automotive Electronics Market Report Scope

Parameter Detail
Market Scope Electronic hardware, control units, sensors, displays and power electronics integrated into light and commercial vehicles, across OEM and aftermarket channels
Study Period 2021–2035 (Historical 2021–2024; Base Year 2025; Forecast 2026–2035)
CAGR 8.3% (2026–2035)
Market Size Checkpoints USD 276.2 Billion (2025); USD 299.1 Billion (2026); USD 411.4 Billion (2030); USD 613.1 Billion (2035)
Fastest Growing Segments Powertrain Electronics (application); Sensors (component); Electric (propulsion)
Companies Profiled 12 major suppliers including Bosch, DENSO, Continental, ZF, Aptiv, Hyundai Mobis, Valeo, Magna, Infineon, NXP, Renesas, Panasonic Automotive
Valuation Currency USD, constant 2025 terms

FAQs

How should procurement teams evaluate supplier lock-in when sourcing for the Automotive Electronics Market?
Assess whether middleware and toolchains are proprietary or AUTOSAR-compliant before signing. Proprietary stacks raise switching costs by an estimated 40% at platform refresh. Insist on source-code escrow terms [5].
Is silicon carbide always better than silicon IGBT for traction inverters?
No. Silicon carbide wins above 400V and in high-utilization duty cycles, but IGBTs remain cheaper for urban vehicles under 150 kW. Model total energy savings against the roughly 3x device cost premium [17].
What integration risks most often delay Automotive Electronics Market programs?
Timing conflicts between safety-certified and non-certified software domains on shared compute. Validation cycles extend six to nine months when partitioning is decided late. Freeze the hypervisor architecture before hardware tape-out [8].
Do cybersecurity regulations apply to aftermarket electronics?
R155 governs vehicle type approval, so factory-fit systems bear direct obligation. Aftermarket devices touching the CAN bus increasingly face OEM warranty restrictions instead. Expect that gap to narrow by 2028 [12].
Which Automotive Electronics Market segments justify capital investment for a new entrant?
Sensor calibration services and functional-safety software tooling offer better returns than hardware manufacturing. Both scale without fab capital. Incumbent hardware suppliers show limited appetite for either [21].
How does chip qualification differ from consumer electronics sourcing?
AEC-Q100 grade parts require temperature qualification to 150°C and 15-year availability commitments. Consumer-grade substitution voids OEM warranty coverage. Plan an 18-month qualification runway minimum [8].
Are Chinese OEM in-house designs a competitive threat to Western suppliers?
Yes, particularly in cockpit and body domains where certification barriers are lower. Safety-critical braking and steering electronics remain harder to insource. Western suppliers should defend the ASIL-D perimeter [22].      
Author
Author
Author Profile
Triveni Bhoyar LinkedIn
Senior Research Analyst
Triveni Bhoyar has over 5 years of experience in the market research industry, specializing in the Automotive and Aerospace & Defense sectors. She has contributed to 200+ reports, including numerous custom projects for leading global companies, delivering solutions to complex business challenges. Renowned for her ability to generate valuable insights, Triveni excels in addressing unique market dynamics with precision and depth. Her expertise spans market sizing, competitive intelligence, and trend analysis, enabling clients to craft data-driven growth strategies. With strong analytical rigor and a client-centric approach, she plays a pivotal role in driving impactful, strategic decision-making.
Co-Author
Co-Author Profile
Swapnil Palwe LinkedIn
Team Lead - Research
With a technical background as Bachelor's in Mechanical Engineering, with MBA in Operations Management , Swapnil has 6+ years of experience in market research, consulting and analytics with the tasks of data mining, analysis, and project execution. He is the POC for our clients, for their consulting projects running under the Automotive/A&D domain. Swapnil has worked on major projects in verticals such as Aerospace & Defense, Automotive and many other domain projects. He has worked on projects for fortune 500 companies' syndicate and consulting projects along with several government projects.

Research Approach


Secondary Research

The secondary research process involved comprehensive analysis of regulatory databases, industry standards repositories, technical publications, and authoritative automotive organizations. Key sources included the US National Highway Traffic Safety Administration (NHTSA), Environmental Protection Agency (EPA) fuel economy and emission databases, European Commission Directorate-General for Mobility and Transport, United Nations Economic Commission for Europe (UNECE) Vehicle Regulations (WP.29), SAE International (Society of Automotive Engineers), International Organization for Standardization (ISO 26262 Functional Safety Standards), European Automobile Manufacturers Association (ACEA), European Association of Automotive Suppliers (CLEPA), China Association of Automobile Manufacturers (CAAM), Japan Automobile Manufacturers Association (JAMA), International Organization of Motor Vehicle Manufacturers (OICA), International Energy Agency (IEA) Global EV Outlook, IEEE Xplore Digital Library, and regulatory filings from the California Air Resources Board (CARB).

These sources were employed to compile data on vehicle production statistics, safety regulation compliance, electrification adoption patterns, technology deployment rates, and competitive landscape analysis for infotainment systems, ADAS components, powertrain electronics, and vehicle connectivity modules.


Primary Research

Qualitative and quantitative insights were obtained by interviewing supply-side and demand-side stakeholders during the primary research process. The supply-side sources comprised CEOs, CTOs, VPs of Automotive Business Units, leaders of semiconductor divisions, and directors of advanced driver-assistance systems (ADAS) from automotive electronics manufacturers, Tier 1 suppliers, and semiconductor foundries. Chief procurement officers from original equipment manufacturers (OEMs), directors of electrical/electronic architecture, vehicle systems engineers from passenger and commercial vehicle divisions, fleet technology managers, and aftermarket electronics distributors constituted demand-side sources. The primary research validated market segmentation across component categories, confirmed semiconductor fabrication capacity timelines, and collected insights on platform adoption patterns, electrification roadmaps, and supply chain restructuring dynamics.

Primary Respondent Breakdown:

By Designation: C-level Primaries (32%), Director Level (33%), Others (35%)

By Region: North America (33%), Europe (30%), Asia-Pacific (26%), Rest of World (11%)


Market Size Estimation

Revenue mapping and vehicle technology adoption analysis were employed to determine the global market valuation. The methodology comprised the following:

Identification of over 60 significant semiconductor and electronics manufacturers in North America, Europe, Asia-Pacific, and Latin America

Product mapping encompasses microcontrollers (MCUs), integrated circuits, power electronics, display technologies, and sensors (LiDAR, radar, and camera modules).

Examination of annual revenues that are specific to automotive-grade electronics portfolios, as reported and modeled

Manufacturers that account for 75-80% of the global market share in 2024 are included in the coverage.

Segment-specific valuations for ADAS, infotainment, and powertrain control systems are derived through extrapolation using bottom-up (vehicle production volumes × electronic content value by vehicle class) and top-down (semiconductor manufacturer revenue validation) approaches.

Download Free Sample

Kindly complete the form below to receive a free sample of this Report

* Please use a valid business email

Download PDF ×

We do not share your information with anyone. However, we may send you emails based on your report interest from time to time. You may contact us at any time to opt-out.
















