Segmentation Quick Reference
| Dimension | Sub-Segments | Dominant Segment | Fastest Growing Segment |
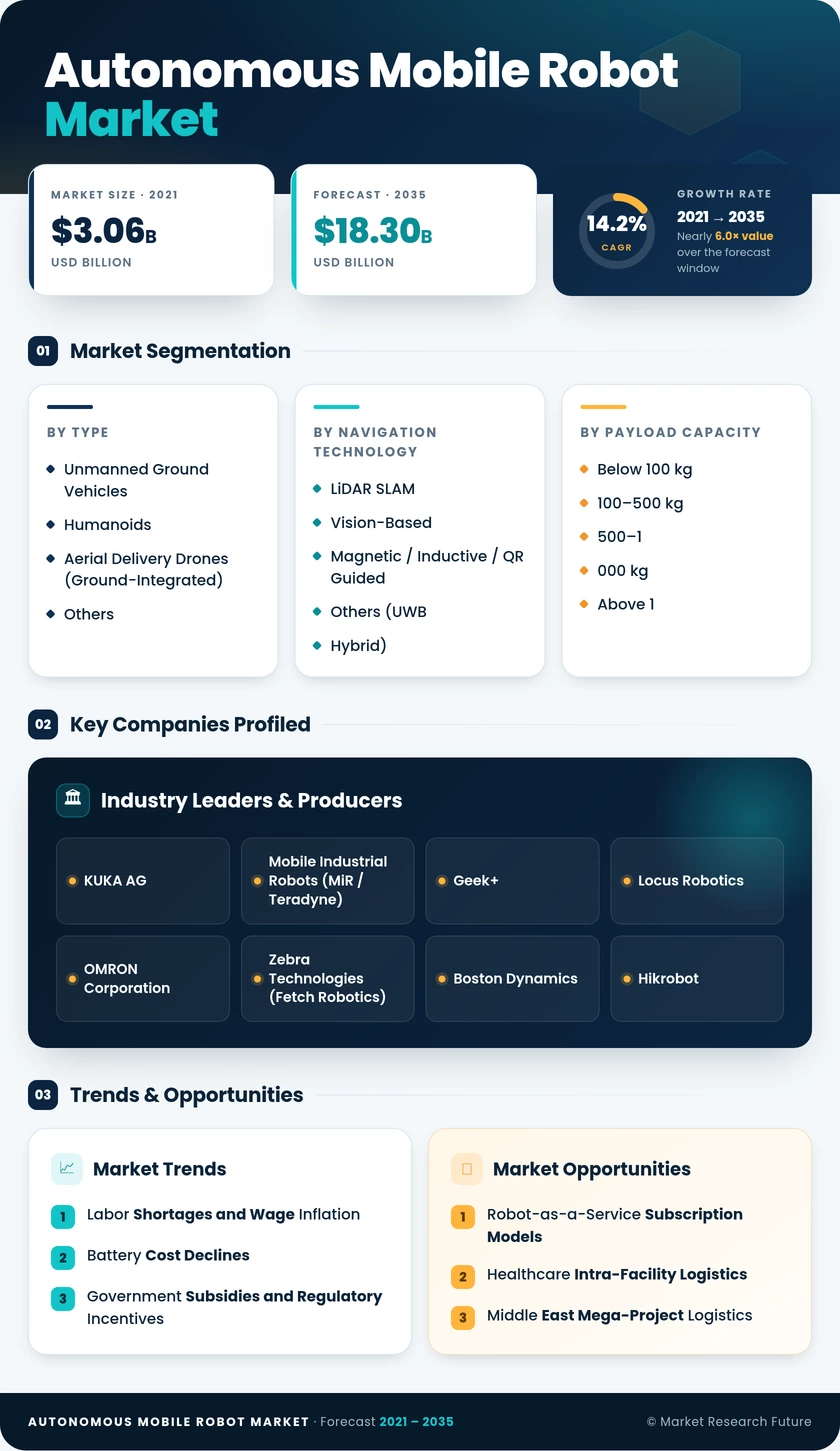
| By Type | Unmanned Ground Vehicles; Humanoids; Aerial Delivery Drones (Ground-Integrated); Others | Unmanned Ground Vehicles | Humanoids |
| By Navigation Technology | LiDAR SLAM; Vision-Based; Magnetic / Inductive / QR Guided; Others (UWB, Hybrid) | LiDAR SLAM | Vision-Based |
| By Payload Capacity | Below 100 kg; 100–500 kg; 500–1,000 kg; Above 1,000 kg | 100–500 kg | Above 1,000 kg |
| By End-User Industry | Warehouse & Logistics; Manufacturing; Automotive; Healthcare; Retail & Hospitality; Others | Warehouse & Logistics | Healthcare |
Market Segmentation Overview
By Type
| Sub-Segment | Key Trend |
| Unmanned Ground Vehicles | Continued dominance driven by goods-to-person picking and pallet transport standardization |
| Humanoids | Commercial pilot programs expanding from automotive assembly into hospitality and retail |
| Aerial Delivery Drones (Ground-Integrated) | Integration with ground-based AMR fleets for seamless campus and intra-facility delivery |
| Others (Inspection, Security) | Growing adoption in perimeter surveillance and infrastructure-inspection applications |
Unmanned ground vehicles remain the backbone of deployments, while humanoid platforms are transitioning from laboratory demonstrations to revenue-generating commercial pilots, particularly in automotive and logistics environments where dexterous manipulation complements wheeled transport.
By Navigation Technology
| Sub-Segment | Key Trend |
| LiDAR SLAM | Sensor costs declining 15–20% annually, broadening accessibility for mid-market buyers |
| Vision-Based | Edge-AI chipsets enabling real-time stereo-vision navigation at lower hardware cost |
| Magnetic / Inductive / QR Guided | Legacy installed base in brownfield facilities sustaining steady replacement demand |
| Others (UWB, Hybrid) | Ultra-wideband positioning gaining traction in high-precision manufacturing environments |
LiDAR SLAM continues to lead on accuracy, but vision-based systems are closing the performance gap as neural-network inference accelerates on next-generation embedded processors.
By Payload Capacity
| Sub-Segment | Key Trend |
| Below 100 kg | Small-parcel sortation and e-commerce micro-fulfillment hubs |
| 100–500 kg | Standard pallet and tote transport across warehouse and manufacturing floors |
| 500–1,000 kg | Heavy-parts intralogistics in automotive and aerospace production |
| Above 1,000 kg | Outdoor construction logistics and mega-project material handling |
The 100–500 kg class aligns with the most common unit-load dimensions in global logistics, while heavy-payload segments above 1,000 kg are expanding rapidly to serve construction and outdoor industrial applications.
By End-User Industry
| Sub-Segment | Key Trend |
| Warehouse & Logistics | Same-day delivery mandates driving fleet-scale AMR deployments across 3PL networks |
| Manufacturing | Intralogistics automation replacing manual tugger-train and forklift operations |
| Automotive | Flexible assembly-line material supply and just-in-sequence delivery |
| Healthcare | Pharmacy dispensing, specimen transport, and linen-management automation |
| Retail & Hospitality | In-store inventory scanning and hotel room-service delivery pilots |
| Others (Autonomous Mobile Robot Market, Defense) | Precision agriculture scouting and perimeter-security patrol applications |
Warehouse and logistics remains the largest vertical, but healthcare is emerging as the fastest-growing end-user segment as hospitals seek measurable reductions in non-clinical labor time.