• Cat-intel
  • MedIntelliX
  • Resources
  • About Us
  • Hero Background
    English
    Chinese
    French
    Japanese
    Korean
    German
    Spanish

    Bioactive Ingredients Market Analysis

    ID: MRFR/F-B & N/3928-HCR
    90 Pages
    Snehal Singh
    October 2025

    Bioactive Ingredients Market Research Report Information by Ingredient Type (Probiotic, Prebiotic & Amino Acid, Omega 3 Fatty Acid, Phytoextract, Carotenoids and others), by Source (Plant, Animal and Microbial), by Application (Food & Beverages, Pharmaceuticals & Nutraceuticals, Personal Care, Animal Feed and others) and Region (North America, Europe, Asia-Pacific and the Rest of th...

    Share:
    Download PDF ×

    We do not share your information with anyone. However, we may send you emails based on your report interest from time to time. You may contact us at any time to opt-out.

    Bioactive Ingredients Market Infographic
    $ 4,950.0
    $ 5,950.0
    $ 7,250.0

    Market Analysis

    In-depth Analysis of Bioactive Ingredients Market Industry Landscape

    The market dynamics of bioactive ingredients reflect a complex interplay of factors that collectively shape its landscape. Bioactive ingredients, often derived from natural sources, have garnered significant attention across various industries due to their potential health benefits and versatile applications. One key driver of the market is the increasing consumer awareness and demand for healthier and functional products. As individuals become more conscious of their well-being, there is a growing preference for products enriched with bioactive ingredients, which are believed to have positive effects on health and contribute to disease prevention. The food and beverage industry plays a pivotal role in influencing the dynamics of the bioactive ingredients market. With consumers seeking nutritious and functional food options, manufacturers are incorporating bioactive ingredients into a diverse range of products, including beverages, snacks, and supplements. This trend is further fueled by the desire for natural and clean-label products, as bioactive ingredients are perceived as wholesome and free from synthetic additives. As a result, the market experiences a surge in demand from both the food industry and health-conscious consumers. The pharmaceutical and nutraceutical sectors also significantly contribute to the market dynamics of bioactive ingredients. The potential health benefits associated with these ingredients, such as antioxidant properties, anti-inflammatory effects, and immune system support, make them attractive for inclusion in pharmaceutical formulations and dietary supplements. The ongoing research and development efforts in these sectors further drive innovation and expansion within the bioactive ingredients market. The cosmetics and personal care industry adds another dimension to the market dynamics, with bioactive ingredients finding applications in skincare, haircare, and other beauty products. Consumers increasingly seek products that not only enhance their appearance but also offer additional benefits to skin health and well-being. As a result, cosmetic companies are incorporating bioactive ingredients known for their skin-rejuvenating and anti-aging properties, influencing the market dynamics and creating new opportunities for growth. The agricultural sector contributes to the market dynamics through the cultivation of crops rich in bioactive compounds. Plant extracts, herbs, and botanicals serve as sources for bioactive ingredients, and the demand for these natural compounds has led to increased cultivation and sustainable sourcing practices. Agricultural practices, therefore, play a role in shaping the availability and pricing of bioactive ingredients in the market. Technological advancements and innovations in extraction and processing techniques also impact the dynamics of the bioactive ingredients market. Efficient methods for extracting and preserving the bioactive compounds from natural sources contribute to the overall market growth. Additionally, advancements in formulation technologies enable the development of bioactive ingredient-rich products with enhanced stability and bioavailability, expanding the application possibilities across various industries. Market dynamics are not without challenges. Regulatory considerations and standards for health claims associated with bioactive ingredients influence market dynamics, requiring companies to navigate compliance hurdles. Furthermore, the market is characterized by intense competition, with both established players and new entrants vying for market share. Differentiation through innovation, quality, and sustainability practices becomes crucial for companies aiming to thrive in the competitive landscape.

    Market Summary

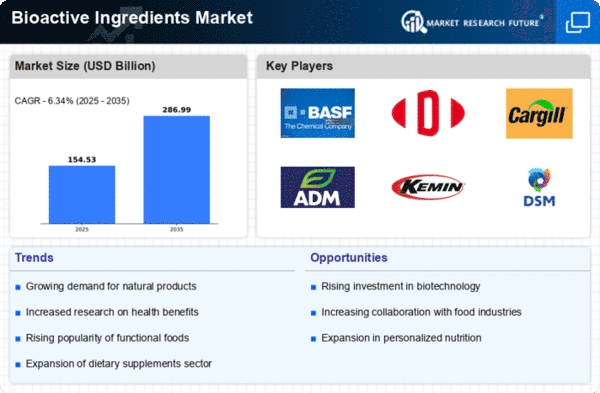
    As per Market Research Future Analysis, the Global Bioactive Ingredients Market is projected to grow at a CAGR of 7.3%, reaching a market value of USD 51.73 billion. The increasing use of bioactive compounds in pharmaceuticals and nutraceuticals to address chronic conditions is a significant driver of this growth. Additionally, the rising demand for natural and organic ingredients, along with the trend towards veganism, is expected to further propel market expansion. The market is segmented by ingredient type, application, source, and region, with Asia-Pacific anticipated to dominate due to heightened consumer awareness and a shift towards healthier products. Europe is expected to register the highest growth rate, driven by increased healthcare expenditure and a preference for natural ingredients.

    Key Market Trends & Highlights

    Key trends influencing the bioactive ingredients market include technological advancements and changing consumer preferences.

    • Market growth driven by the rising use of bioactive compounds in chronic disease treatment.
    • Asia-Pacific to dominate the market due to increasing health consciousness among consumers.
    • Europe expected to witness the highest growth rate due to rising healthcare expenditure and lifestyle diseases.
    • Technological advancements like microencapsulation enhancing product quality and productivity.

    Market Size & Forecast

    Market Size USD 51.73 Billion
    CAGR 7.3%
    Dominant Region Asia-Pacific
    Highest Growth Rate Europe

    Major Players

    Cargill Inc. (US), Archer Daniels Midland Company (US), Koninklijke DSM N.V. (Netherlands), AJINOMOTO CO. INC (Japan), Ingredion Incorporated (US), FMC Corporation (US), Arla Foods amba (Denmark), E. I. du Pont de Nemours and Company (US), BASF SE (Germany), Roquette Frères (France), Mazza Innovation Ltd (Canada), Sabinsa Corporation (US), Nuritas (Ireland), Vytrus Biotech (Spain), Kuehnle AgroSystems (US)

    Market Trends

    The increasing consumer demand for natural and functional food products is driving innovation in the bioactive ingredients sector, suggesting a transformative shift towards health-oriented formulations.

    U.S. Department of Agriculture (USDA)

    Bioactive Ingredients Market Market Drivers

    Rising Health Consciousness

    The increasing awareness of health and wellness among consumers is a primary driver of the Global Bioactive Ingredients Market Industry. As individuals become more informed about the benefits of natural ingredients, there is a growing demand for products that promote health and prevent diseases. This trend is reflected in the projected market value of 51.7 USD Billion in 2024, as consumers seek bioactive ingredients that enhance their overall well-being. The shift towards preventive healthcare is likely to propel the market further, with consumers actively seeking supplements and functional foods that incorporate bioactive compounds.

    Market Segment Insights

    Regional Insights

    Key Companies in the Bioactive Ingredients Market market include

    Industry Developments

    Mar 2022 Demetrix, a biotechnology business that makes bioactive chemicals, announced its commercial manufacturing campaign for cannabigerol in 2022. (CBG). Initial global clients in the personal care and nutrition industries have agreed to buy over 70% of our total output this year, generating multi-million-dollar revenue in 2022. This is the first of several successful commercial productions runs Demetrix will accomplish to service a growing external customer base this year.

    Mar 2022 Prodalim Resources Ltd will demonstrate prototypes of their Capsoil FoodTech platform, which converts bioactive oil molecules into water-soluble powders, such as fat-soluble vitamins, nutritious oils, and lipid-based minerals. Oil-based substances may be transformed into an ultra-fine, water-soluble,self-emulsifying powder using the Capsoil FoodTech platform, making them easier to incorporate into a wide range of foods, drinks, and expanded forms of nutritional supplements.

    Global Bioactive Ingredients Market, by Ingredient type

    Global Bioactive Ingredients Market, by Application

      • Food & Beverages
      • Pharmaceuticals & Nutraceuticals
      • Personal Care
      • Animal Feed
      • Others

    Global Bioactive Ingredients Market, by Source

      • Plant
      • Animal
      • Microbial

    Global Bioactive Ingredients Market, by Region

      • North America
        • US
        • Canada
        • Mexico
      • Europe
        • Germany
        • France
        • Italy
        • Spain
        • UK
        • Rest of Europe
      • Asia-Pacific
        • Japan
        • China
        • India
        • Australia and New Zealand
        • Rest of Asia-Pacific
      • Rest of the World (RoW)
        • South America
        • Middle East
        • Africa

    Intended Audience

      • Bioactive ingredients processor
      • Commercial research and development institutions
      • Raw material suppliers and distributors
      • Food and drug processors
      • Traders, exporters, and importers

    Future Outlook

    Bioactive Ingredients Market Future Outlook

    The Global Bioactive Ingredients Market is projected to grow at a 7.3% CAGR from 2024 to 2035, driven by rising health awareness, demand for natural ingredients, and advancements in extraction technologies.

    New opportunities lie in:

    • Develop innovative bioactive formulations targeting aging populations.
    • Leverage e-commerce platforms for direct-to-consumer sales of bioactive products.
    • Invest in sustainable sourcing practices to enhance brand reputation and consumer trust.

    By 2035, the market is expected to achieve substantial growth, reflecting evolving consumer preferences and technological advancements.

    Market Segmentation

    Report Scope

    {}

    Market Highlights

    Author

    Snehal Singh
    Assistant Manager - Research

    She holds an experience of about 6+ years in market research and business consulting, working under the spectrum of information communication technology, telecommunications and semiconductor domains. aarti conceptualizes and implements a scalable business strategy and provides strategic leadership to the clients. her expertise lies in market estimation, competitive intelligence, pipeline analysis, customer assessment, etc.

    Leave a Comment

    Latest Comments

    John Doe
    john@example.com

    This is a great article! Really helped me understand the topic better.

    Posted on July 23, 2025, 10:15 AM
    Jane Smith
    jane@domain.com

    Thanks for sharing this. I’ve bookmarked it for later reference.

    Posted on July 22, 2025, 7:45 PM

    FAQs

    What is the projected valuation of the global bioactive ingredients market?

    Bioactive ingredients market valuation can touch USD 43 billion by 2024.

    What is the expected growth rate of the global bioactive ingredients market?

    Bioactive ingredients market is expected to exhibit a CAGR of 7.1% from 2019 to 2024.

    What is the major driver of the global bioactive ingredients market?

    Bioactive ingredients market is driven by its need by pharmaceutical and biopharmaceutical sectors.

    What is the major impediment faced players of the global bioactive ingredients market?

    Bioactive ingredients market growth can be impeded by the complicated extraction and production process.

    Name key players of the global bioactive ingredients market.

    FMC Corporation, BASF SE, Kuehnle AgroSystems, Sabinsa Corporation, Ingredion Incorporated, Mazza Innovation Ltd, Archer Daniels Midland Company, Vytrus Biotech, Koninklijke DSM N.V., Nuritas, AJINOMOTO CO. INC, E. I. du Pont de Nemours and Company, Cargill Inc., Arla Foods amba, and Roquette Frères are major players of the global bioactive ingredients market.

    1. |-
    2. Table of Contents
    3. 1    Executive Summary     
    4. 2    Scope of the Report     
    5. 2.1    Market Definition     
    6. 2.2    Scope of the Study     2.2.1    Research Objectives     2.2.2    Assumptions & Limitations     2.3    Markets Structure     3    Market Research Methodology     3.1    Research Function     3.2    Secondary Research     3.3    Primary Research     3.4    Forecast Model     4    Market Landscape     4.1    Supply Chain Analysis  4.1.1    Raw Material Suppliers      4.1.2    Manufacturers/Producers      4.1.3    Distributors/Retailers/Wholesalers/E-Commerce 4.1.4    End Users      4.2        Porter’s Five Forces Analysis     4.2.1    Threat of New Entrants     4.2.2    Bargaining Power of Buyers     4.2.3    Bargaining Power of Suppliers     4.2.4    Threat of Substitutes     4.2.5    Rivalry 5    Market Dynamics of the Global Bioactive Ingredients Market     5.1    Introduction     5.2    Drivers     5.3    Restraints      5.4    Opportunities 5.5    Challenges      6.    Global Bioactive Ingredients Market, by Ingredient Type 6.1    Introduction 6.2    Probiotics 6.2.1   Market Estimates & Forecast, 2020–2027 6.2.2   Market Estimates & Forecast, by Region, 2020–2027 6.3    Prebiotics & Amino Acids 6.3.1   Market Estimates & Forecast, 2020–2027 6.3.2   Market Estimates & Forecast, by Region, 2020–2027 6.4    Omega3 Fatty Acids 6.4.1   Market Estimates & Forecast, 2020–2027 6.4.2   Market Estimates & Forecast, by Region, 2020–2027 6.5    Phytoextracts 6.5.1   Market Estimates & Forecast, 2020–2027 6.5.2   Market Estimates & Forecast, by Region, 2020–2027 6.6    Carotenoids 6.6.1   Market Estimates & Forecast, 2020–2027 6.6.2   Market Estimates & Forecast, by Region, 2020–2027 6.7    Others 6.7.1   Market Estimates & Forecast, 2020–2027 6.7.2   Market Estimates & Forecast, by Region, 2020–2027 7.    Global Bioactive Ingredients Market, by Application 7.1    Introduction 7.2    Food & Beverages  7.2.1   Market Estimates & Forecast, 2020–2027 7.2.2   Market Estimates & Forecast, by Region, 2020–2027 7.3    Pharmaceuticals & Nutraceuticals 7.3.1   Market Estimates & Forecast, 2020–2027 7.3.2   Market Estimates & Forecast, by Region, 2020–2027 7.4    Personal Care 7.4.1   Market Estimates & Forecast, 2020–2027 7.4.2   Market Estimates & Forecast, by Region, 2020–2027 7.5    Animal Feed 7.5.1   Market Estimates & Forecast, 2020–2027 7.5.2   Market Estimates & Forecast, by Region, 2020–2027 7.6    Others 7.6.1   Market Estimates & Forecast, 2020–2027 7.6.2   Market Estimates & Forecast, by Region, 2020–2027 8.    Global Bioactive Ingredients Market, by Source 8.1    Introduction 8.2    Plant                             8.2.1     Market Estimates & Forecast, 2020–2027 8.2.2     Market Estimates & Forecast, by Region, 2020–2027 8.3    Animal              8.3.1     Market Estimates & Forecast, 2020–2027 8.3.2     Market Estimates & Forecast, by Region, 2020–2027 8.3    Microbial              8.3.1     Market Estimates & Forecast, 2020–2027 8.3.2     Market Estimates & Forecast, by Region, 2020–2027 9.    Global Bioactive Ingredients Market, by Region 9.1    Introduction 9.2    North America                           9.2.1   Market Estimates & Forecast, 2020–2027                           9.2.2   Market Estimates & Forecast, by Ingredient Type, 2020–2027         9.2.3   Market Estimates & Forecast, by Application, 2020–2027                           9.2.4   Market Estimates & Forecast, by Source, 2020–2027                           9.2.5    US                                        9.2.5.1   Market Estimates & Forecast, 2020–2027                                        9.2.5.2   Market Estimates & Forecast, by Ingredient Type, 2020–2027             9.2.5.3   Market Estimates & Forecast, by Application, 2020–2027                                        9.2.5.4   Market Estimates & Forecast, by Source, 2020–2027                           9.2.6    Canada                                        9.2.6.1   Market Estimates & Forecast, 2020–2027                                        9.2.6.2   Market Estimates & Forecast, by Ingredient Type, 2020–2027             9.2.6.3     Market Estimates & Forecast, by Application, 2020–2027                                        9.2.6.4   Market Estimates & Forecast, by Source, 2020–2027               9.2.7    Mexico                                        9.2.7.1   Market Estimates & Forecast, 2020–2027                                        9.2.7.2   Market Estimates & Forecast, by Ingredient Type, 2020–2027             9.2.7.3   Market Estimates & Forecast, by Application, 2020–2027                                        9.2.7.4   Market Estimates & Forecast, by Source, 2020–2027 9.3    Europe                           9.3.1   Market Estimates & Forecast, 2020–2027                           9.3.2   Market Estimates & Forecast, by Ingredient Type, 2020–2027         9.2.3   Market Estimates & Forecast, by Application, 2020–2027                           9.3.4   Market Estimates & Forecast, by Source, 2020–2027                           9.3.5    Germany                                        9.3.5.1   Market Estimates & Forecast, 2020–2027                                        9.3.5.2   Market Estimates & Forecast, by Ingredient Type, 2020–2027             9.2.5.3   Market Estimates & Forecast, by Application, 2020–2027                                        9.3.5.4   Market Estimates & Forecast, by Source, 2020–2027                           9.3.6.     France                                        9.3.6.1   Market Estimates & Forecast, 2020–2027                                        9.3.6.2   Market Estimates & Forecast, by Ingredient Type, 2020–2027             9.3.6.3   Market Estimates & Forecast, by Application, 2020–2027                                        9.3.6.4   Market Estimates & Forecast, by Source, 2020–2027                           9.3.7   Italy                                        9.3.7.1   Market Estimates & Forecast, 2020–2027                                        9.3.7.2   Market Estimates & Forecast, by Ingredient Type, 2020–2027             9.3.7.3    Market Estimates & Forecast, by Application, 2020–2027                                        9.3.7.4    Market Estimates & Forecast, by Source, 2020–2027                           9.3.8    Spain                                        9.3.8.1   Market Estimates & Forecast, 2020–2027                                        9.3.8.2   Market Estimates & Forecast, by Ingredient Type, 2020–2027             9.3.8.3   Market Estimates & Forecast, by Application, 2020–2027                                        9.3.8.4   Market Estimates & Forecast, by Source, 2020–2027            9.3.9    UK                                        9.3.9.1   Market Estimates & Forecast, 2020–2027                                        9.3.9.2   Market Estimates & Forecast, by Ingredient Type, 2020–2027             9.3.9.3     Market Estimates & Forecast, by Application, 2020–2027                                        9.3.9.4   Market Estimates & Forecast, by Source, 2020–2027                           9.3.10   Rest of     Europe                                        9.3.10.1   Market Estimates & Forecast, 2020–2027                                        9.3.10.2   Market Estimates & Forecast, by Ingredient Type, 2020–2027             9.3.10.3   Market Estimates & Forecast, by Application, 2020–2027                                        9.3.10.4   Market Estimates & Forecast, by Source, 2020–2027 9.4      Asia-Pacific                             9.4.1    Market Estimates & Forecast, 2020–2027                             9.4.2    Market Estimates & Forecast, by Ingredient Type, 2020–2027         9.4.3   Market Estimates & Forecast, by Application, 2020–2027                          9.4.4    Market Estimates & Forecast, by Source, 2020–2027                          9.4.5    China                                        9.4.5.1   Market Estimates & Forecast, 2020–2027                                        9.4.5.2   Market Estimates & Forecast, by Ingredient Type, 2020–2027             9.4.5.3   Market Estimates & Forecast, by Application, 2020–2027                                        9.4.5.4   Market Estimates & Forecast, by Source, 2020–2027                          9.4.6    India                                        9.4.6.1   Market Estimates & Forecast, 2020–2027                                        9.4.6.2   Market Estimates & Forecast, by Ingredient Type, 2020–2027             9.4.6.3   Market Estimates & Forecast, by Application, 2020–2027                                        9.4.6.4   Market Estimates & Forecast, by Source, 2020–2027                          9.4.7    Japan                                        9.4.7.1   Market Estimates & Forecast, 2020–2027                                        9.4.7.2   Market Estimates & Forecast, by Ingredient Type, 2020–2027             9.4.7.3   Market Estimates & Forecast, by Application, 2020–2027                                        9.4.7.3   Market Estimates & Forecast, by Source, 2020–2027                          9.4.8    Australia & New Zealand                                        9.4.8.1   Market Estimates & Forecast, 2020–2027                                        9.4.8.2   Market Estimates & Forecast, by Ingredient Type, 2020–2027             9.4.8.4   Market Estimates & Forecast, by Application, 2020–2027                                        9.4.8.3   Market Estimates & Forecast, by Source, 2020–2027                          9.4.9    Rest of Asia-Pacific                                        9.4.9.1   Market Estimates & Forecast, 2020–2027                                        9.4.9.2   Market Estimates & Forecast, by Ingredient Type, 2020–2027             9.4.9.3   Market Estimates & Forecast, by Application, 2020–2027                                        9.4.9.4   Market Estimates & Forecast, by Source, 2020–2027 9.5    Rest of the World (RoW)                           9.5.1     Market Estimates & Forecast, 2020–2027                          9.5.2     Market Estimates & Forecast, by Ingredient Type, 2020–2027                 9.5.3     Market Estimates & Forecast, by Application, 2020–2027                          9.5.4     Market Estimates & Forecast, by Source, 2020–2027                          9.5.5     South America                                       9.5.5.1   Market Estimates & Forecast, 2020–2027                                       9.5.5.2   Market Estimates & Forecast, by Ingredient Type, 2020–2027             9.5.5.3   Market Estimates & Forecast, by Application, 2020–2027                                       9.5.5.4   Market Estimates & Forecast, by Source, 2020–2027                          9.5.6     Middle East                                       9.5.6.1   Market Estimates & Forecast, 2020–2027                                       9.5.6.2   Market Estimates & Forecast, by Ingredient Type, 2020–2027                     9.5.6.3   Market Estimates & Forecast, by Application, 2020–2027                                       9.5.6.4   Market Estimates & Forecast, by Source, 2020–2027                             9.5.7    Africa                                      9.5.7.1   Market Estimates & Forecast, 2020–2027                                      9.5.7.2   Market Estimates & Forecast, by Ingredient Type, 2020–2027                    9.5.7.3   Market Estimates & Forecast, by Application, 2020–2027                                      9.5.7.4   Market Estimates & Forecast, by Source, 2020–2027 10.    Company Landscape     10.1    Introduction     10.2    Market Strategy 10.3      Key Development Analysis  (Expansions/Mergers and Acquisitions/Joint Ventures/New Product Developments/Agreements/ Investments)  11.    Company Profiles                  11.1    Cargill Inc.              11.1.1     Company Overview 11.1.2     Financial Updates     11.1.3     Product/Business Segment Overview  11.1.4     Strategy  11.1.5     Key Developments 11.1.6     SWOT Analysis 11.2    BASF SE 11.2.1     Company Overview 11.2.2     Financial Updates     11.2.3     Product/Business Segment Overview  11.2.4     Strategy  11.2.5     Key Developments 11.2.6     SWOT Analysis     11.3    Archer Daniels Midland Company              11.3.1     Company Overview 11.3.2     Financial Updates     11.3.3     Product/Business Segment Overview  11.3.4     Strategy  11.3.5     Key Developments 11.3.6     SWOT Analysis 11.4     Koninklijke DSM N.V. 11.4.1     Company Overview 11.4.2     Financial Updates     11.4.3     Product/Business Segment Overview  11.4.4     Strategy  11.4.5     Key Developments 11.4.6     SWOT Analysis 11.5    Ajinomoto Co. Inc 11.5.1     Company Overview 11.5.2     Financial Updates     11.5.3     Product/Business Segment Overview  11.5.4     Strategy  11.5.5     Key Developments 11.5.6     SWOT Analysis        11.6    Ingredion Incorporated 11.6.1     Company Overview 11.6.2     Financial Updates     11.6.3     Product/Business Segment Overview  11.6.4     Strategy  11.6.5     Key Developments 11.6.6     SWOT Analysis 11.7    FMC Corporation              11.7.1     Company Overview 11.7.2     Financial Updates     11.7.3     Product/Business Segment Overview  11.7.4     Strategy  11.7.5     Key Developments 11.7.6     SWOT Analysis 11.8    Arla Foods amba              11.8.1     Company Overview 11.8.2     Financial Updates     11.8.3     Product/Business Segment Overview  11.8.4     Strategy  11.8.5     Key Developments 11.8.6     SWOT Analysis 11.9    E. I. du Pont de Nemours and Company              11.9.1     Company Overview 11.9.2     Financial Updates     11.9.3     Product/Business Segment Overview  11.9.4     Strategy  11.9.5     Key Developments 11.9.6     SWOT Analysis 11.10    Roquette Frères              11.10.1     Company Overview 11.10.2     Financial Updates     11.10.3     Product/Business Segment Overview  11.10.4     Strategy  11.10.5     Key Developments 11.10.6     SWOT Analysis 11.11    Sabinsa Corporation              11.11.1     Company Overview 11.11.2     Financial Updates     11.11.3     Product/Business Segment Overview  11.11.4     Strategy  11.11.5     Key Developments 11.11.6     SWOT Analysis 11.12    Mazza Innovation Ltd              11.12.1     Company Overview 11.12.2     Financial Updates     11.12.3     Product/Business Segment Overview  11.12.4     Strategy  11.12.5     Key Developments 11.12.6     SWOT Analysis 11.13    Nuritas              11.13.1     Company Overview 11.13.2     Financial Updates     11.13.3     Product/Business Segment Overview  11.13.4     Strategy  11.13.5     Key Developments 11.13.6     SWOT Analysis 11.14    Kuehnle AgroSystems              11.14.1     Company Overview 11.14.2     Financial Updates     11.14.3     Product/Business Segment Overview  11.14.4     Strategy  11.14.5     Key Developments 11.14.6     SWOT Analysis 11.15    Vytrus Biotech              11.15.1     Company Overview 11.15.2     Financial Updates     11.15.3     Product/Business Segment Overview  11.15.4     Strategy  11.15.5     Key Developments 11.15.6     SWOT Analysis
    7.  Conclusion  
    8. List of Tables and Figures
      1. TABLE 1          Global Bioactive Ingredients Market, by Region, 2020–2027 (USD Million)  TABLE 2          Global Bioactive Ingredients Market, by Ingredient Type, 2020–2027 (USD Million)  TABLE 3          Global Bioactive Ingredients Market, by Application, 2020–2027 (USD Million)  TABLE 4          Global Bioactive Ingredients Market, by Source, 2020–2027 (USD Million)  TABLE 5          North America: Bioactive Ingredients Market, by Country, 2020–2027 (USD Million)  TABLE 6          North America: Bioactive Ingredients Market, by Ingredient Type, 2020–2027 (USD Million)  TABLE 7          North America: Bioactive Ingredients Market, by Application, 2020–2027 (USD Million)  TABLE 8          North America: Bioactive Ingredients Market, by Source, 2020–2027 (USD Million)  TABLE 9          US: Bioactive Ingredients Market, by Ingredient Type, 2020–2027 (USD Million)  TABLE 10        US: Bioactive Ingredients Market, by Application, 2020–2027 (USD Million)  TABLE 11        US: Bioactive Ingredients Market, by Source, 2020–2027 (USD Million)  TABLE 12        Canada: Bioactive Ingredients Market, by Ingredient Type, 2020–2027 (USD Million)  TABLE 13        Canada: Bioactive Ingredients Market, by Application, 2020–2027 (USD Million)  TABLE 14        Canada: Bioactive Ingredients Market, by Source, 2020–2027 (USD Million)  TABLE 15        Mexico: Bioactive Ingredients Market, by Ingredient Type, 2020–2027 (USD Million)  TABLE 16        Mexico: Bioactive Ingredients Market, by Application, 2020–2027 (USD Million)  TABLE 17        Mexico: Bioactive Ingredients Market, by Source, 2020–2027 (USD Million)  TABLE 18        Europe: Bioactive Ingredients Market, by Country, 2020–2027 (USD Million)  TABLE 19        Europe: Bioactive Ingredients Market, by Ingredient Type, 2020–2027 (USD Million)  TABLE 20        Europe: Bioactive Ingredients Market, by Application, 2020–2027 (USD Million)  TABLE 21        Europe: Bioactive Ingredients Market, by Source, 2020–2027 (USD Million)  TABLE 22        Germany: Bioactive Ingredients Market, by Ingredient Type, 2020–2027 (USD Million)  TABLE 23        Germany: Bioactive Ingredients Market, by Application, 2020–2027 (USD Million)  TABLE 24        Germany: Bioactive Ingredients Market, by Source, 2020–2027 (USD Million)  TABLE 25        France: Bioactive Ingredients Market, by Ingredient Type, 2020–2027 (USD Million)  TABLE 26        France: Bioactive Ingredients Market, by Application, 2020–2027 (USD Million)  TABLE 27        France: Bioactive Ingredients Market, by Source, 2020–2027 (USD Million)  TABLE 28        Italy: Bioactive Ingredients Market, by Ingredient Type, 2020–2027 (USD Million)  TABLE 29        Italy: Bioactive Ingredients Market, by Application, 2020–2027 (USD Million)  TABLE 30        Italy: Bioactive Ingredients Market, by Source, 2020–2027 (USD Million)  TABLE 31        Spain: Bioactive Ingredients Market, by Ingredient Type, 2020–2027 (USD Million)  TABLE 32        Spain: Bioactive Ingredients Market, by Application, 2020–2027 (USD Million)  TABLE 33        Spain: Bioactive Ingredients Market, by Source, 2020–2027 (USD Million)  TABLE 34        UK: Bioactive Ingredients Market, by Ingredient Type, 2020–2027 (USD Million)  TABLE 35        UK: Bioactive Ingredients Market, by Application, 2020–2027 (USD Million)  TABLE 36        UK: Bioactive Ingredients Market, by Source, 2020–2027 (USD Million)  TABLE 37        Rest of Europe: Bioactive Ingredients Market, by Ingredient Type, 2020–2027 (USD Million)  TABLE 38        Rest of Europe: Bioactive Ingredients Market, by Application, 2020–2027 (USD Million)  TABLE 39        Rest of Europe: Bioactive Ingredients Market, by Source, 2020–2027 (USD Million)  TABLE 40        Asia-Pacific: Bioactive Ingredients Market, by Country, 2020–2027 (USD Million)  TABLE 41        Asia-Pacific: Bioactive Ingredients Market, by Ingredient Type, 2020–2027 (USD Million)  TABLE 42        Asia-Pacific: Bioactive Ingredients Market, by Application, 2020–2027 (USD Million)  TABLE 43        Asia-Pacific: Bioactive Ingredients Market, by Source, 2020–2027 (USD Million)  TABLE 44        China: Bioactive Ingredients Market, by Ingredient Type, 2020–2027 (USD Million)  TABLE 45        China: Bioactive Ingredients Market, by Application, 2020–2027 (USD Million)  TABLE 46        China: Bioactive Ingredients Market, by Source, 2020–2027 (USD Million)  TABLE 47        India: Bioactive Ingredients Market, by Ingredient Type, 2020–2027 (USD Million)  TABLE 48        India: Bioactive Ingredients Market, by Application, 2020–2027 (USD Million)  TABLE 49        India: Bioactive Ingredients Market, by Source, 2020–2027 (USD Million)  TABLE 50        Japan: Bioactive Ingredients Market, by Ingredient Type, 2020–2027 (USD Million)  TABLE 51        Japan: Bioactive Ingredients Market, by Application, 2020–2027 (USD Million)  TABLE 52        Japan: Bioactive Ingredients Market, by Source, 2020–2027 (USD Million)  TABLE 53        Rest of Asia-Pacific: Bioactive Ingredients Market, by Ingredient Type, 2020–2027 (USD Million)  TABLE 54        Rest of Asia-Pacific: Bioactive Ingredients Market, by Application, 2020–2027 (USD Million)  TABLE 55        Rest of Asia-Pacific:  Bioactive Ingredients Market, by Source, 2020–2027 (USD Million)  TABLE 56        Rest of the World (RoW): Bioactive Ingredients Market, by Country, 2020–2027 (USD Million)  TABLE 57         Rest of the World (RoW): Bioactive Ingredients Market, by Ingredient Type, 2020–2027 (USD Million)  TABLE 58        Rest of the World (RoW): Bioactive Ingredients Market, by Application, 2020–2027 (USD Million)  TABLE 59        Rest of the World (RoW): Bioactive Ingredients Market, by Source, 2020–2027 (USD Million)  TABLE 60        South America: Bioactive Ingredients Market, by Ingredient Type, 2020–2027 (USD Million)  TABLE 61        South America: Bioactive Ingredients Market, by Application, 2020–2027 (USD Million)  TABLE 62        South America: Bioactive Ingredients Market, by Source, 2020–2027 (USD Million)  TABLE 63        Middle East: Bioactive Ingredients Market, by Ingredient Type, 2020–2027 (USD Million)  TABLE 64        Middle East: Bioactive Ingredients Market, by Application, 2020–2027 (USD Million)  TABLE 65        Middle East: Bioactive Ingredients Market, by Source, 2020–2027 (USD Million)  TABLE 66        Africa: Bioactive Ingredients Market, by Ingredient Type, 2020–2027 (USD Million)  TABLE 67        Africa: Bioactive Ingredients Market, by Application, 2020–2027 (USD Million)  TABLE 68        Africa: Bioactive Ingredients Market, by Source, 2020–2027 (USD Million) 
      2. FIGURE 1    Global Bioactive Ingredients Market Segmentation FIGURE 2    Forecast Research Methodology FIGURE 3    Five Forces Analysis of Global Bioactive Ingredients Market FIGURE 4    Value Chain of Global Bioactive Ingredients Market FIGURE 5    Share of Global Bioactive Ingredients Market in 2020, by Country (%) FIGURE 6    Global Bioactive Ingredients Market, 2020–2027 FIGURE 7    Global Bioactive Ingredients Market Size by Ingredient Type, 2020 FIGURE 8    Share of Global Bioactive Ingredients Market, by Ingredient Type, 2020–2027 FIGURE 9    Global Bioactive Ingredients Market Size by Application, 2020 FIGURE 10    Share of Global Bioactive Ingredients Market, by Application, 2020–2027 FIGURE 11    Global Bioactive Ingredients Market Size, by Source, 2020 FIGURE 12    Share of Global Bioactive Ingredients Market, by Source, 2020–2027

    Bioactive ingredients Market Segmentation

    Market Segmentation Overview

    • Detailed segmentation data will be available in the full report
    • Comprehensive analysis by multiple parameters
    • Regional and country-level breakdowns
    • Market size forecasts by segment
    Infographic

    Free Sample Request

    Kindly complete the form below to receive a free sample of this Report

    Get Free Sample

    Customer Strories

    “I am very pleased with how market segments have been defined in a relevant way for my purposes (such as "Portable Freezers & refrigerators" and "last-mile"). In general the report is well structured. Thanks very much for your efforts.”

    Victoria Milne

    Founder
    Case Study
    Chemicals and Materials