Biocomposite Market Segmentation
Biocomposite Market By Application (USD Billion, 2025-2035)
- Biocomposite Market
- Automotive
- Consumer Goods
- Electronics
- Healthcare
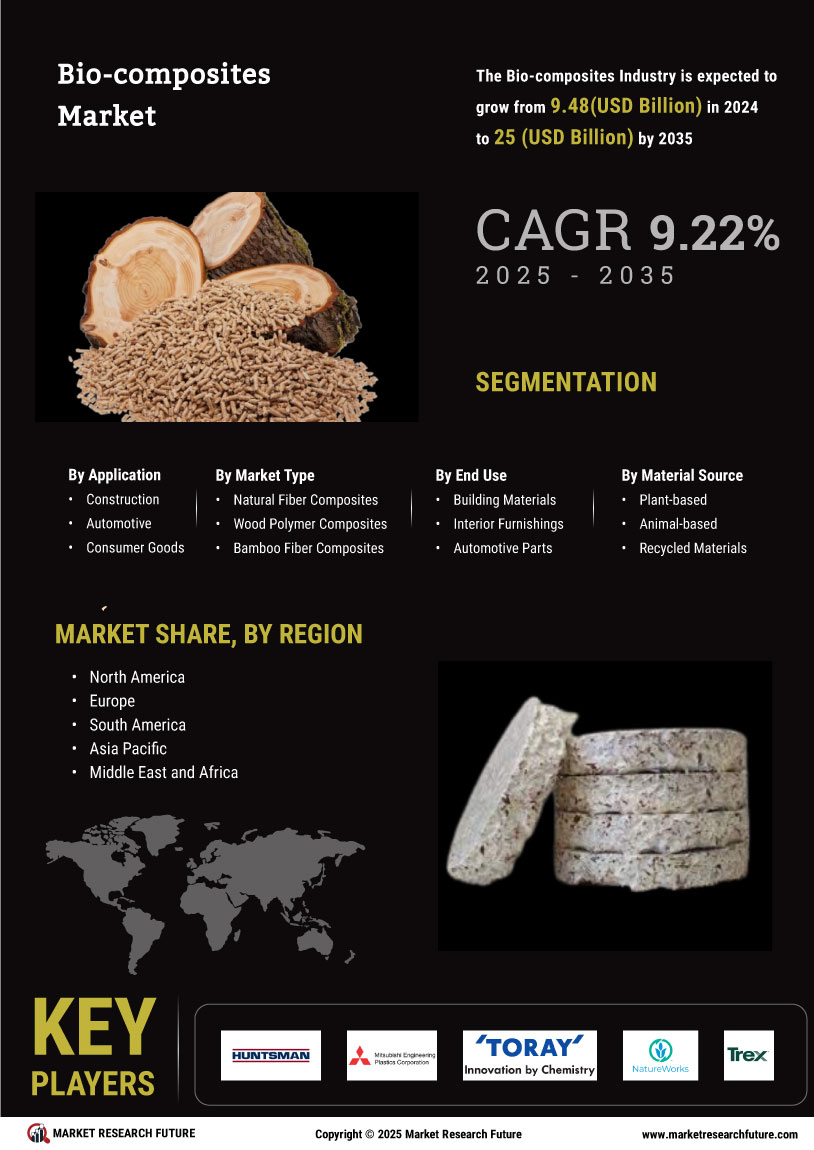
Biocomposite Market By Type (USD Billion, 2025-2035)
- Natural Fiber Composites
- Wood Polymer Composites
- Bamboo Fiber Composites
- Hemp Fiber Composites
Biocomposite Market By End Use (USD Billion, 2025-2035)
- Building Materials
- Interior Furnishings
- Automotive Parts
- Packaging Materials
Biocomposite Market By Material Source (USD Billion, 2025-2035)
- Plant-based
- Animal-based
- Recycled Materials