Biorational Pesticides Market (2026 - 2035)

Biorational Pesticides Market Size, Share, Industry Trend & Analysis Research Report Information By Ingredient (Microbial, Biochemical), By Product Type (Bioinsecticide, Biofungicide, Bionematicide, Bioherbicide), By Crop Type (Cereals & Grains, Fruits & Vegetables, Oilseeds & Pulses, Turf & Ornamentals), By Mode of Application (Foliar Spray, Seed Treatment, Soil Treatment), By Formulation (Liquid, Dry) - Global Forecast till 2035

Forecast Period
2026-2035
CAGR
11.8%
2025 Market Size
USD 8.30 Billion
2035 Market Size
USD 25.35 Billion
Agriculture ● Updated July 28, 2026 Report ID: MRFR/Agri/6097-HCR | Pages: 90 | Author: Snehal Singh

Biorational Pesticides Market Summary

The global Biorational Pesticides Market is valued at USD 8.30 Billion in 2025 and is projected to reach USD 25.35 Billion by 2035, expanding at a compound annual growth rate of 11.8% during the 2026–2035 forecast window. This trajectory is anchored in two converging forces: the European Union's Farm to Fork strategy, which mandates a 50% cut in synthetic pesticide deployment by 2030 [1], and a sustained surge in venture capital flowing into RNA interference and microbiome-based crop protection platforms [2]. Together, these catalysts are reshaping how growers worldwide manage pest pressure.

Legacy synthetic chemistries—organophosphates, neonicotinoids and broad-spectrum pyrethroids—are facing increasing regulatory obstacles and consumer backlash. Biorational alternatives are progressing from niche organic plots to row-crop plans in the mainstream, founded on microbial fermentation, biochemical signaling molecules and living beneficial organisms. By 2024, the USDA’s National Organic Program had certified over 5.6 million acres in the United States alone, and an estimated USD 1.2 billion in private-equity capital was invested in the biological crop protection space between 2022 and 2024 [3]. Breakthroughs in synthetic biology have shortened the discovery-to-commercialization timescale from a decade to as few as four years, making the Biorational Pesticides Market more appealing to both agrochemical incumbents and entrepreneurs.


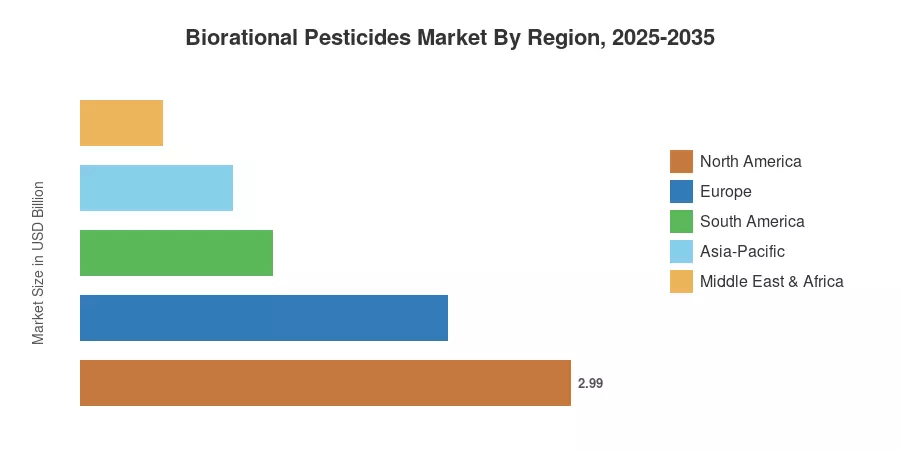
North America is the largest Biorational Pesticides Market. It is expected to generate about 36% of the revenue by 2025 due to easy registration procedures by the EPA and modern infrastructure for integrated pest control [4]. Growth in South America is the fastest, driven by Brazil’s growing soybean biocontrol programs and good regulatory pathways. With over 27%, Europe is in second place, with the Green Deal functioning as a structural demand accelerator. The Biorational Pesticides Market is entering its most dynamic decade yet with the adoption of biological product recommendations integrated into spray-decision algorithms by precision agriculture platforms.


Key Report Takeaways

• By Ingredient

  • The microbial ingredient segment commanded roughly 67% of the Biorational Pesticides Market in 2024, reflecting grower confidence in Bacillus- and Trichoderma-based formulations.
  • Biochemical platforms are forecast to register a 15.4% CAGR through 2035, propelled by peptide-discovery advances and synthetic biology cost reductions.

• By Product Type

  • Bioinsecticides accounted for approximately 44% of the Biorational Pesticides Market revenue in 2024.
  • Bionematicides are projected to achieve the highest segment growth at a 17.6% CAGR between 2026 and 2035.

• By Geography

  • North America maintained its position as the largest regional contributor to the Biorational Pesticides Market in 2025, supported by robust regulatory infrastructure.
  • South America is forecast to grow at the fastest pace through 2035, anchored in large-scale tropical agriculture adoption.


Market Size and Forecast (2021–2035)

Market Research Future (MRFR) has developed a sizing model for the Biorational Pesticides Market that combines bottom-up revenue tracking by active ingredient with top-down macroeconomic and acreage calibration. Historical figures (2021-2024) are based on corporate filings, customs trade data and regulatory registration volumes. The forecasts (2026-2035) are derived from a calibrated growth model, benchmarked to independent agrochemical industry benchmarks.
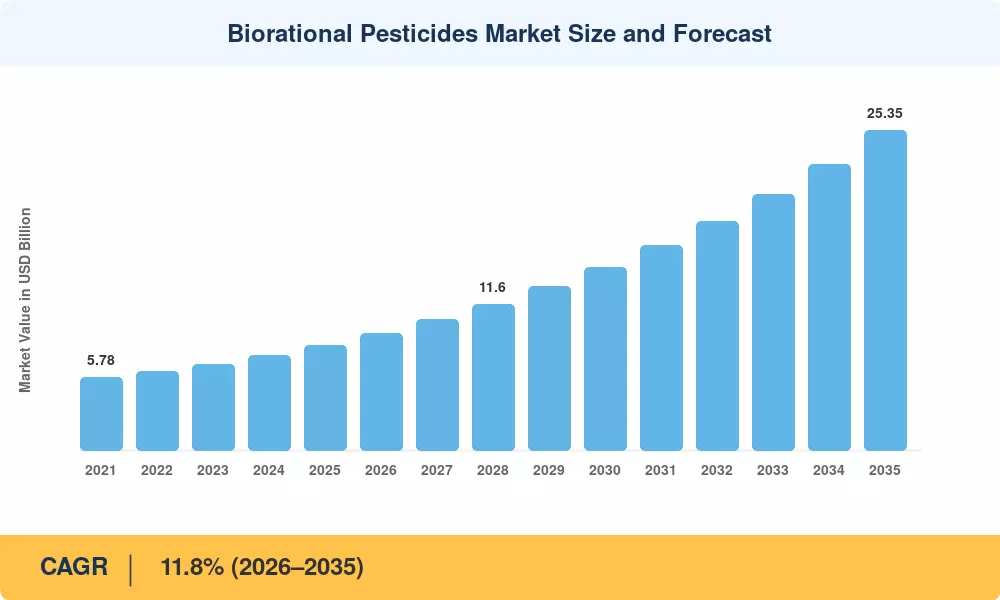
Biorational Pesticides Market Size and Forecast
Our Impact
Enabled $4.3B Revenue Impact for Fortune 500 and Leading Multinationals
Partnering with 2000+ Global Organizations Each Year
30K+ Citations by Top-Tier Firms in the Industry

Driver Impact Analysis

Driver ~% Impact on CAGR Geographic Relevance Impact Timeline
Regulatory tightening on synthetic chemistries ~22% Global Medium-term (2–4 yr)
Organic farming acreage expansion ~18% North America, Europe Long-term (≥4 yr)
Venture capital into bio-innovation pipelines ~16% North America Short-term (≤2 yr)
IPM mandate adoption by governments ~14% Asia-Pacific, South America Medium-term (2–4 yr)
Consumer demand for residue-free produce ~12% Europe, North America Long-term (≥4 yr)
Digital agriculture decision-tool integration ~10% Global Medium-term (2–4 yr)
Government subsidies for sustainable inputs ~8% Asia-Pacific Short-term (≤2 yr)


Regulatory Tightening on Synthetic Chemistries

The European Commission's Farm to Fork strategy commits EU member states to cutting chemical pesticide use by 50% before 2030 — a mandate that directly elevates demand within the Biorational Pesticides Market [1]. The European Food Safety Authority's updated peer reviews have already withdrawn or restricted 74 active synthetic substances since 2020, creating registration vacuums that biological products are filling [11]. This regulatory ratchet is not unique to Europe: India's Central Insecticides Board banned 27 synthetic pesticides in 2023, and Brazil's MAPA accelerated biological product registrations by 38% year-on-year in 2024 [7].

Organic Farming Acreage Expansion

Global certified organic farmland crossed 80 million hectares in 2024, up from 72 million hectares two years prior, according to IFOAM Organics International [3]. Because organic certification prohibits most synthetic pesticide inputs, every incremental hectare represents a captive addressable acre for the Biorational Pesticides Market. The USDA's Organic Transition Initiative allocated USD 300 Million in grants between 2023 and 2025 to assist conventional growers in switching to organic-compliant pest management [12].

Venture Capital Into Bio-Innovation Pipelines

Private and institutional investors deployed approximately USD 1.2 billion into biological crop protection ventures between 2022 and 2024 [2]. Deals like Vestaron's USD 112 Million Series E for peptide-based bioinsecticides and Pivot Bio's USD 430 Million raise for nitrogen-fixing microbes signal confidence in the commercial viability of these platforms. Shorter development timelines — four to five years versus ten for synthetic molecules — improve internal rates of return and attract growth-stage capital to the Biorational Pesticides Market [2].

Digital Agriculture Decision-Tool Integration

Precision agriculture platforms from companies such as Climate Corporation and Farmers Edge are embedding biological product recommendations into variable-rate prescription maps. Field-level sensors, satellite imagery, and predictive pest-pressure models now enable growers to time biological applications with greater accuracy, closing the efficacy gap that historically favored synthetics. This integration is expanding the addressable Biorational Pesticides Market beyond early-adopter organic growers into mainstream conventional operations.


Restraints Impact Analysis

The restraints below represent headwinds that moderate growth within the Biorational Pesticides Market. Impact percentages are directional estimates and are not directly subtracted from the CAGR.

Restraint ~% Drag on CAGR Geographic Relevance Impact Timeline
Higher per-acre cost vs. synthetics ~–20% Global Long-term (≥4 yr)
Shorter shelf life and cold-chain needs ~–18% South America, Africa Medium-term (2–4 yr)
Variable field efficacy under stress ~–15% Asia-Pacific Medium-term (2–4 yr)
Limited grower awareness in developing regions ~–12% Middle East & Africa Long-term (≥4 yr)
Fragmented registration across jurisdictions ~–10% Global Short-term (≤2 yr)


Higher Per-Acre Cost Versus Synthetics

Biological crop protection products typically cost 15–40% more per treated acre than generic synthetic alternatives, a premium that strains adoption among smallholder farmers and price-sensitive commodity growers [13]. Until production-scale fermentation and formulation advances close this cost gap, the Biorational Pesticides Market will face resistance in price-elastic geographies. Government subsidy programs partially offset this barrier, but coverage remains uneven.

Shorter Shelf Life and Cold-Chain Constraints

Living microbial formulations degrade without controlled temperature storage, limiting distribution in regions with weak cold-chain infrastructure [14]. In sub-Saharan Africa and parts of Southeast Asia, product viability losses of 20–30% during transport reduce grower confidence and compress distributor margins, creating an adoption bottleneck for the Biorational Pesticides Market.


Biorational Pesticides Market Opportunities

RNA Interference Crop Protection Platforms

Double-stranded RNA sprays that silence pest genes without leaving chemical residues represent a next-generation frontier for the Biorational Pesticides Market. GreenLight Biosciences and Bayer's BioDirect platforms have advanced multiple RNAi actives into late-stage field trials, with first commercial registrations expected between 2027 and 2029 [2].

Emerging Market Expansion in Africa and Southeast Asia

Africa's agricultural pest losses exceed USD 4 billion annually, yet biological crop protection penetration remains below 3% of total pesticide spend [16]. Governments in Kenya, Nigeria, and Vietnam are launching IPM extension programs that create structured market entry pathways for biorational products.

Drone-Delivered Biological Applications

Autonomous spray drones reduce application costs by 30–50% compared with tractor-mounted equipment and enable precise microbial inoculant delivery in small-plot and terraced farming systems. This convergence of agricultural automation and biocontrol creates a high-growth intersection within the Biorational Pesticides Market.

Post-Harvest Biocontrol and Food Safety

Biocontrol agents for post-harvest decay — particularly yeast-based antagonists targeting Botrytis and Penicillium — address a USD 1.5 billion spoilage loss problem in fresh fruit supply chains [18]. Regulatory preferences for zero-residue post-harvest treatments open an incremental revenue channel.

Data-Driven Biological Product Recommendation Engines

Agtech companies are building subscription platforms that combine soil microbiome diagnostics with prescriptive biological product stacking. These data-monetization models — sold as annual advisory subscriptions — generate recurring revenue streams and deepen grower engagement with the Biorational Pesticides Market.


Biorational Pesticides Market Future Outlook

AI-Guided Pest Diagnostics and Prescription Spraying

Artificial intelligence models trained on multispectral drone imagery and in-field sensor networks will enable species-level pest identification within hours, allowing growers to deploy targeted biological treatments before populations reach economic thresholds. By 2030, an estimated 40% of high-value crop acreage in North America and Europe will rely on AI-driven spray prescriptions, expanding the serviceable market for the Biorational Pesticides Market [19].

Microbiome Engineering and Synthetic Biology

Advances in CRISPR-based microbial strain optimization are expected to halve fermentation costs for Bacillus- and Beauveria-based products by 2032, directly addressing the cost premium restraint [2]. Engineered consortia that combine bioinsecticidal, biofungicidal, and biostimulant functions in a single application could reshape the Biorational Pesticides Market by reducing the number of spray passes per season.

Circular Bioeconomy and Waste-Derived Feedstocks

Fermentation substrates sourced from agri-food waste — rice bran, sugar cane bagasse, and distillery stillage — can reduce biological product manufacturing costs by 20–35% [20]. This circular supply chain model aligns with ESG reporting frameworks that institutional investors increasingly require, strengthening the sustainability narrative around the Biorational Pesticides Market.

Climate Adaptation and Shifting Pest Geographies

Rising average temperatures are expanding the geographic range of tropical pests into temperate zones, creating new addressable acres for the Biorational Pesticides Market. The FAO projects that climate change will increase global crop pest losses by 10–25% by 2040, driving demand for adaptive biological solutions that perform under heat and moisture stress [21].


Biorational Pesticides Market Segmentation

By Ingredient

Segment Key Metric Primary Demand Driver
Microbial 67% market share (2024) Proven Bacillus and Trichoderma efficacy
Biochemical 15.4% CAGR (2026–2035) Synthetic biology cost reductions


Microbial products remain the backbone of the Biorational Pesticides Market, with Bacillus thuringiensis (Bt) and Beauveria bassiana-based formulations accounting for the majority of registered active ingredients. Fermentation-scale manufacturing, robust field data packages, and broad-spectrum pest activity sustain microbial dominance. Biochemical platforms — including plant-derived semiochemicals and peptide bioinsecticides — are the fastest-growing ingredient class. Vestaron's peptide actives and Provivi's pheromone-based mating disruption products exemplify the innovation driving biochemical adoption rates within this segment of the Biorational Pesticides Market.

By Product Type

Segment Key Metric Primary Demand Driver
Bioinsecticide 44% market share (2024) Lepidopteran and coleopteran control
Biofungicide USD 2.16 Billion (2025) Soil-borne disease management
Bionematicide 17.6% CAGR (2026–2035) Tropical nematode resistance issues
Bioherbicide USD 0.42 Billion (2025) Herbicide-resistant weed management


Bioinsecticides anchor the Biorational Pesticides Market by product type, serving row-crop and horticultural applications where Bt and spinosad-based products compete directly with synthetic pyrethroids. Bionematicides represent the fastest-expanding product segment, driven by endemic root-knot nematode pressure in Brazilian soybean and Indian sugarcane systems where chemical nematicides face resistance and regulatory withdrawal.

By Crop Type

Segment Key Metric Primary Demand Driver
Fruits & Vegetables 36% market share (2024) Export MRL compliance
Cereals & Grains USD 1.82 Billion (2025) Seed treatment adoption
Oilseeds & Pulses 17.4% CAGR (2026–2035) Soybean biocontrol in Latin America
Turf & Ornamentals USD 0.54 Billion (2025) Municipal pesticide bans


Fruits and vegetables lead crop-type demand for the Biorational Pesticides Market because fresh-produce supply chains face the strictest residue limits and the shortest pre-harvest intervals. High-value berry, grape, and leafy-green operations in California, Spain, and Chile have among the highest biological product adoption rates globally. Oilseeds and pulses represent the fastest-growing crop segment, driven almost entirely by Brazilian soybean growers who are stacking biological nematicides with biofungicide seed treatments.

By Mode of Application

Segment Key Metric Primary Demand Driver
Foliar Spray 55% market share (2024) Ease of integration with existing equipment
Seed Treatment 14.8% CAGR (2026–2035) Preventive biological protection at planting
Soil Treatment USD 0.78 Billion (2025) Nematode and soil-borne pathogen control


By Formulation

Segment Key Metric Primary Demand Driver
Liquid 62% market share (2024) Tank-mix compatibility
Dry 13.8% CAGR (2026–2035) Extended shelf life and transport stability


Regional Market Share Analysis

Region Key Metric (2025) Primary Investment Themes
North America 36% market share EPA biopesticide fast-track, organic transition subsidies
Europe USD 2.24 Billion Farm to Fork mandates, MRL harmonization
Asia-Pacific 11.2% CAGR (2026–2035) Government IPM programs, smallholder biologicals
South America 14.1% CAGR (2026–2035) Soybean biocontrol, tropical nematode management
Middle East & Africa USD 0.50 Billion Extension service build-out, arid-climate formulations
Total USD 8.30 Billion

The Biorational Pesticides Market exhibits distinct regional adoption curves, influenced by regulatory maturity, organic acreage density, and grower purchasing power. The summary table below presents one key metric per region.


North America

Country Key Metric Key Driver
US 72% of regional share EPA biopesticide category growth
Canada CAGR 10.9% Pest Management Regulatory Agency fast-track
Mexico USD 0.18 Billion Tropical fruit export compliance


The US drives the North American Biorational Pesticides Market, with California, Florida, and the Pacific Northwest representing the highest-density adoption corridors. The EPA's Biopesticides and Pollution Prevention Division processed a record 58 new active-ingredient registrations in 2024, reducing average approval timelines to under 18 months [4]. Canadian growers benefit from mutual recognition agreements that allow US-registered products to fast-track through PMRA review. At the same time, Mexico's horticultural export sector — particularly avocado and berry production — requires biological solutions to meet EU and Japanese maximum residue limits.

Europe

Country Key Metric Key Driver
Germany 19% of regional share National Action Plan on sustainable plant protection
UK CAGR 11.5% Post-Brexit regulatory autonomy
France USD 0.38 Billion Ecophyto II+ program
Italy 14% of regional share Organic vineyard and olive acreage
Spain CAGR 12.1% Greenhouse vegetable biologicals
Nordic Countries USD 0.12 Billion Seed treatment innovation
Russia 7% of regional share Import substitution for crop protection inputs
Rest of Europe CAGR 10.4% EU harmonized registration framework


Europe's Biorational Pesticides Market benefits from the strongest regulatory tailwind of any region. France's Ecophyto II+ program has committed EUR 200 Million to reducing synthetic pesticide dependency by 50%, while Germany's National Action Plan channels federal funds toward on-farm biological product demonstrations [1][11]. The UK's post-Brexit regulatory flexibility has accelerated novel biopesticide approvals, making it a testing ground for products pending EU-wide registration.

Asia-Pacific

Country Key Metric Key Driver
China 34% of regional share Zero-Growth Pesticide Action Plan
India CAGR 13.2% National Mission on Sustainable Agriculture
Japan USD 0.21 Billion Premium residue-free produce market
South Korea 12% of regional share Smart farming subsidies
ASEAN CAGR 12.8% Rice paddy biocontrol expansion
Rest of Asia-Pacific USD 0.08 Billion Emerging IPM adoption


China's Zero-Growth Pesticide Action Plan, which caps synthetic pesticide use at 2015 levels, has channeled state procurement budgets toward biological alternatives [10]. India's Biorational Pesticides Market is expanding rapidly as the Central Insecticides Board tightens restrictions on organophosphates and state-level subsidies reduce farmer out-of-pocket costs for registered biocontrol agents. Japan's premium consumer market pays significant price premiums for residue-free produce, sustaining demand for high-efficacy biological inputs.

South America

Country Key Metric Key Driver
Brazil 68% of regional share MAPA biological registration surge
Argentina CAGR 13.5% Soybean and corn biocontrol programs
Rest of South America USD 0.07 Billion Coffee and specialty crop applications


Brazil is the engine of the South American Biorational Pesticides Market. MAPA approved 147 new biological crop protection products in 2024 alone — a 38% increase over 2023 — driven by soybean growers seeking alternatives for nematode and caterpillar management in tropical no-till systems [7]. Argentina's Biorational Pesticides Market is expanding as export-facing grain producers adopt biological tank-mix partners to meet European residue requirements.

Middle East & Africa

Country Key Metric Key Driver
Saudi Arabia 22% of regional share Vision 2030 agricultural modernization
UAE CAGR 11.6% Controlled-environment agriculture growth
South Africa USD 0.09 Billion Citrus and deciduous fruit exports
Egypt 18% of regional share Nile Delta vegetable production
Rest of MEA CAGR 10.1% Smallholder IPM programs


The Middle East & Africa Biorational Pesticides Market is nascent but accelerating. Saudi Arabia's Vision 2030 includes agricultural self-sufficiency targets that favor climate-adapted biological inputs for greenhouse production. In South Africa, citrus and table grape exporters increasingly adopt biocontrol to comply with stringent EU phytosanitary and residue standards [16].


Biorational Pesticides Market By Region, 2025-2035

Competitive Benchmarking

The Biorational Pesticides Market is low in concentration, with the top five firms holding an estimated 30–38% of global revenue. The Herfindahl-Hirschman Index is below 800, signifying a fragmented competitive structure. This fragmentation encourages M&A activity – established players purchase niche biological innovators to cover pipeline gaps and merge proprietary microbial strains with digital recommendation engines [22].

Company Est. Revenue Share Range Key Offerings for Biorational Pesticides Market Strategic Positioning
Bayer CropScience ~7–11% Serenade (Bacillus), Flipper, BioAct Integrated crop science platform
BASF SE ~6–9% Serifel, Velondis, Xilon Biological pipeline expansion via R&D
Corteva Agriscience ~5–8% Inatreq, biological seed treatments Digital + biologicals bundling
Syngenta Group ~5–8% Taegro, Maxim, Qualimins Post-ChemChina biological integration
UPL Limited ~4–7% ZEBA, biological portfolio via Arysta Emerging-market distribution network
Valent BioSciences ~4–6% DiPel, Grandevo, Venerate Pure-play biorational specialist
Certis Biologicals ~3–5% Javelin, Deliver, Double Nickel US specialty crop focus
Koppert Biological Systems ~2–4% Trianum, Entrust, beneficial insects Greenhouse biocontrol leadership
FMC Corporation ~2–4% Presence, biological pipeline Synthetic-to-bio transition
Marrone Bio Innovations ~2–3% Grandevo, Regalia, Haven Innovation-driven IPM solutions


Recent News & Developments


  • Corteva Agriscience (October 2024): Announced a strategic partnership with a precision agriculture AI firm to integrate biological product recommendations into satellite-guided spray prescriptions.


  • Syngenta Group (March 2025): Launched NETURE, a biological insecticide that helps farmers manage insects affecting the productivity of soybean and corn crops. The bioproduct provides effective and residual control of corn leafhopper and other sap-sucking pests, including stink bugs, whiteflies, and sugarcane leafhopper.


Biorational Pesticides Market Report Scope

Parameter Detail
Market Scope Global Biorational Pesticides Market — biological crop protection products including microbial and biochemical active ingredients
Study Period 2021–2035
CAGR (Forecast Window) 11.8% (2026–2035)
Market Size — Base Year (2025) USD 8.30 Billion
Market Size — Forecast End (2035) USD 25.35 Billion
Fastest Growing Segment Bionematicides (by product type); Biochemical (by ingredient)
Companies Profiled 10 (Bayer, BASF, Corteva, Syngenta, UPL, Valent BioSciences, Certis, Koppert, FMC, Marrone Bio)
Valuation Currency USD Billion


FAQs

How do biorational pesticides perform in resistance management programs compared with synthetic rotations?
Biorational products work through multiple modes of action — parasitism, antibiosis, and competition — making single-gene resistance development extremely unlikely [15]. Growers integrate them into resistance management rotations to extend the commercial life of synthetic chemistries.
What shelf-life benchmarks should procurement teams verify before purchasing microbial formulations?
Liquid microbial formulations typically guarantee 12–18 months of viability at 4–25 °C, while dry granular formats can exceed 24 months under ambient conditions [14]. Always confirm colony-forming-unit counts on the certificate of analysis.
Which regulatory pathway offers the fastest route to market for a new biorational active ingredient?
The US EPA's biopesticide category averages 15–18 months from submission to registration, roughly half the timeline for conventional chemistries [4]. The EU's zonal evaluation pathway also expedites biologicals but varies by rapporteur member state.
How does tank-mix compatibility testing differ for biological versus chemical crop protection products?
Biological formulations require viability assays — not just physical compatibility — because pH extremes, UV stabilizers, and adjuvant surfactants can kill living microbial cells [13]. Standardized jar-test protocols now include post-mix CFU viability counts.
What financing models are emerging to offset the higher upfront cost of biorational programs?
Performance-based contracts, where suppliers share yield-loss risk, and input-financing bundles through agtech lenders are reducing grower cash-flow barriers [2]. Some distributors also offer seasonal credit lines tied to biological product purchases.
Can biorational products be effectively applied through drip irrigation systems?
Select microbial and biochemical formulations are labeled for chemigation through drip and micro-sprinkler systems, provided filtration mesh sizes accommodate particle loads [18]. Compatibility with fertigation schedules requires pre-application water pH adjustment.
How are carbon credit programs influencing adoption of the Biorational Pesticides Market products?
Voluntary carbon markets increasingly recognize reduced synthetic input use as a qualifying practice, generating 0.3–0.8 carbon credits per hectare annually [20]. This supplementary revenue stream improves the economic case for biological adoption.    
Author
Author
Author Profile
Snehal Singh LinkedIn
Manager - Research
High acumen in analyzing complex macro & micro markets with more than 6 years of work experience in the field of market research. By implementing her analytical skills in forecasting and estimation into market research reports, she has expertise in Packaging, Construction, and Equipment domains. She handles a team size of 20-25 resources and ensures smooth running of the projects, associated marketing activities, and client servicing.
Share::
Request Free Sample

Research Approach


Secondary Research

The secondary research process involved comprehensive analysis of regulatory filings, agricultural databases, peer-reviewed agronomy journals, and authoritative food safety organizations. Key sources included the US Environmental Protection Agency (EPA) Biopesticide Registration Directory, USDA National Agricultural Statistics Service (NASS), European Food Safety Authority (EFSA), European Commission Directorate-General for Health and Food Safety (DG SANTE), FAO Statistics Division (FAOSTAT), OECD Agricultural Pesticide Statistics, Health Canada Pest Management Regulatory Agency (PMRA), USDA Animal and Plant Health Inspection Service (APHIS), Insecticide Resistance Action Committee (IRAC), International Biocontrol Manufacturers Association (IBMA), Biopesticide Industry Alliance (BPIA), CropLife International, Brazilian Ministry of Agriculture (MAPA), Indian Directorate of Plant Protection, Quarantine & Storage, and Australian Pesticides and Veterinary Medicines Authority (APVMA). These sources were utilized to collect crop protection usage statistics, biopesticide registration data, field efficacy studies, integrated pest management (IPM) adoption trends, import-export trade flows, and regulatory landscape analysis for microbial pesticides, botanical extracts, semiochemicals, and mineral-based crop protection products.


Primary Research

During the primary research process, both supply-side and demand-side stakeholders were interviewed to gather qualitative and quantitative data. Supply-side sources consisted of CEOs, VPs of Research & Development, regulatory affairs managers, and portfolio heads from manufacturers of biorational pesticides, formulators of biological crop protection, and microbial fermentation facilities. Commercial growers and farm operations managers (for row crops, specialty crops, and greenhouse/horticulture), chief agronomists from agricultural cooperatives, procurement directors from crop input distributors, and sustainability officers from food processors and retail agricultural networks were all demand-side sources. Primary research confirmed market segmentation, confirmed the timelines for the biological active ingredient pipeline, and gathered information on the barriers to farmer adoption, the integration of application technology, the price elasticity of biological active ingredients compared to conventional synthetics, and the dynamics of distribution channels.

Primary Respondent Breakdown:

By Designation: C-level Primaries (32%), Director Level (33%), Others (35%)

By Region: North America (32%), Europe (30%), Asia-Pacific (26%), Rest of World (12%)


Market Size Estimation

Global market valuation was derived through revenue mapping and agricultural application area analysis. The methodology included:

Identification of 60+ key manufacturers across North America, Europe, Latin America, Asia-Pacific, and select African markets

Product mapping across microbial pesticides (bacteria-based, fungi-based, virus-based), botanical extracts (neem, pyrethrin, essential oils), semiochemicals (pheromones, mating disruptors), and mineral/inert materials (kaolin, diatomaceous earth, horticultural oils)

Analysis of reported and modeled annual revenues specific to biorational and biological crop protection portfolios, including straight biological products and biocontrol-synthetic combinations

Coverage of manufacturers representing 65-70% of global market share in 2024

Extrapolation using bottom-up (treated hectare/acreage × application intensity × ASP by crop type and region) and top-down (manufacturer revenue validation, trade data triangulation) approaches to derive segment-specific valuations by product origin, formulation type, target pest category, and application method

2/2

Share::
Request Free Sample
Download Free Sample

Kindly complete the form below to receive a free sample of this Report

Share::
Request Free Sample
Download PDF ×

We do not share your information with anyone. However, we may send you emails based on your report interest from time to time. You may contact us at any time to opt-out.
















