Biosensors Market (2026 - 2035)

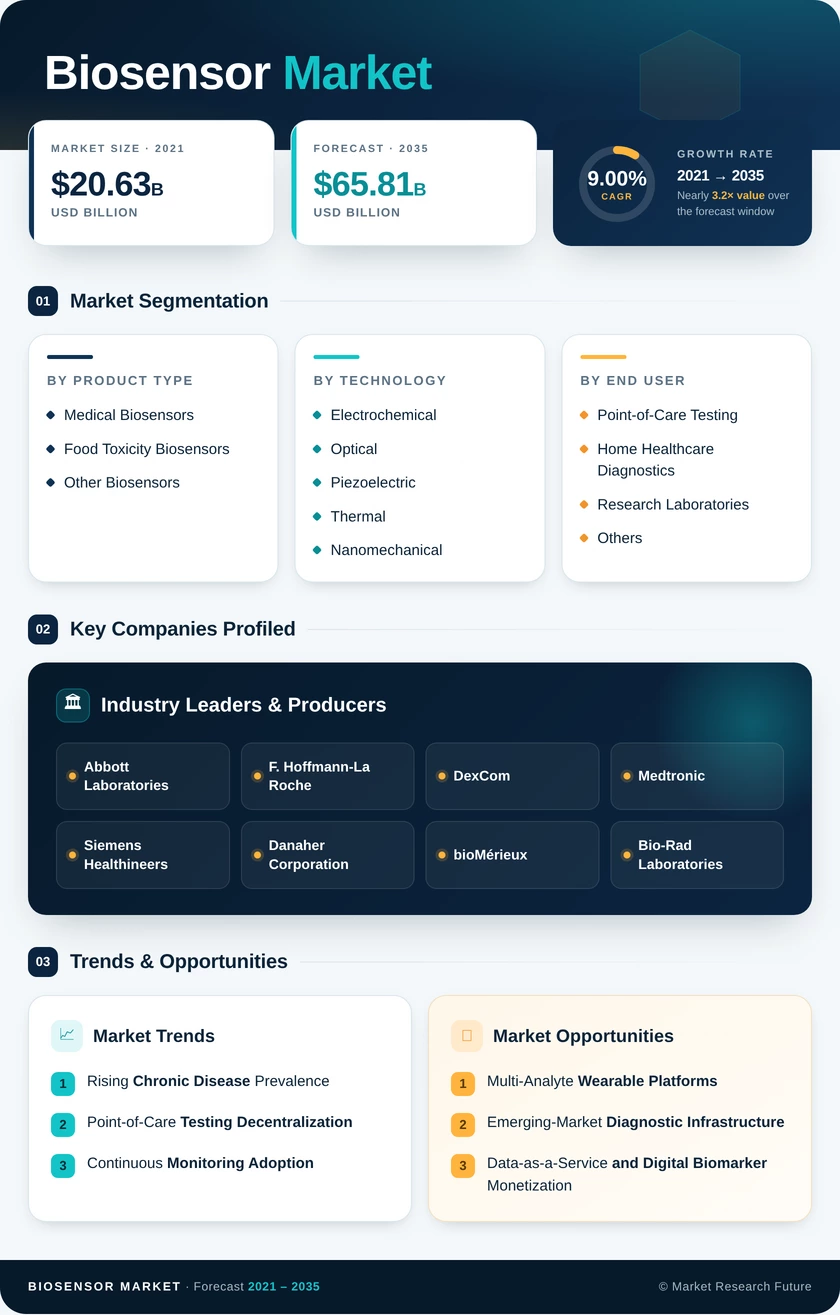
Biosensors Market Research Report By Application (Healthcare, Food Safety, Environmental Monitoring, Industrial Process, Agriculture), By Technology (Electrochemical, Optical, Piezoelectric, Thermal, Microwave), By Type (Wearable Biosensors, Implantable Biosensors, Invasive Biosensors, Non-Invasive Biosensors), By End Use (Point of Care Testing, Laboratory Testing, Research and Development) and By Regional (North America, Europe, South America, Asia Pacific, Middle East and Africa) - Industry Forecast to 2035.

Forecast Period
2026-2035
CAGR
9.00%
2025 Market Size
USD 27.80 Billion (2025)
2035 Market Size
USD 65.81 Billion (2035)
Healthcare ● Updated July 2026 Report ID: MRFR/HC/0720-CR | Pages: 200 | Author: Nidhi Mandole, Rahul Gotadki
  1. 1 Market Overview |
    1. 1.1 Study Assumptions & Market Definition |
    2. 1.2 Scope of the Study |
    3. 1.3 Research Methodology
  2. 2 Market Summary & Key Takeaways
  3. 3 Market Dynamics |
    1. 3.1 Market Drivers Analysis | |
      1. 3.1.1 Rising Chronic Disease Prevalence | |
      2. 3.1.2 Point-of-Care Testing Decentralization | |
      3. 3.1.3 Continuous Monitoring Adoption | |
      4. 3.1.4 AI-Enabled Diagnostic Integration | |
      5. 3.1.5 Regulatory Pathway Acceleration | |
      6. 3.1.6 Emerging-Market Health Infrastructure | |
      7. 3.1.7 Consumer Wearable Convergence |
    2. 3.2 Market Restraints Analysis | |
      1. 3.2.1 Multi-Jurisdictional Regulatory Complexity | |
      2. 3.2.2 High Validation and Clinical Trial Costs | |
      3. 3.2.3 Reimbursement Uncertainty | |
      4. 3.2.4 Raw Material Supply Chain Constraints | |
      5. 3.2.5 Data Privacy and Cybersecurity Concerns |
    3. 3.3 Market Opportunity Analysis | |
      1. 3.3.1 Multi-Analyte Wearable Platforms | |
      2. 3.3.2 Emerging-Market Diagnostic Infrastructure | |
      3. 3.3.3 Data-as-a-Service and Digital Biomarker Monetization | |
      4. 3.3.4 Food Safety and Environmental Monitoring | |
      5. 3.3.5 Companion Diagnostics and Precision Medicine |
    4. 3.4 Industry Value Chain Analysis |
    5. 3.5 Porter's Five Forces Analysis
  4. 4 Global Biosensor Market Size & Forecast (2021–2035) |
    1. 4.1 Historical Market Size (2021–2025) |
    2. 4.2 Current & Forecast Market Size (2026–2035) |
    3. 4.3 Market Size by Revenue (USD Billion) |
    4. 4.4 Year-over-Year Growth Analysis
  5. 5 Segmentation Analysis |
    1. 5.1 By Product Type | |
      1. 5.1.1 Medical Biosensors | |
      2. 5.1.2 Food Toxicity Biosensors | |
      3. 5.1.3 Other Biosensors |
    2. 5.2 By Technology | |
      1. 5.2.1 Electrochemical | |
      2. 5.2.2 Optical | |
      3. 5.2.3 Piezoelectric | |
      4. 5.2.4 Thermal | |
      5. 5.2.5 Nanomechanical |
    3. 5.3 By End User | |
      1. 5.3.1 Point-of-Care Testing | |
      2. 5.3.2 Home Healthcare Diagnostics | |
      3. 5.3.3 Research Laboratories | |
      4. 5.3.4 Others
  6. 6 Regional Analysis |
    1. 6.1 North America | |
      1. 6.1.1 United States | |
      2. 6.1.2 Canada | |
      3. 6.1.3 Mexico |
    2. 6.2 Europe | |
      1. 6.2.1 Germany | |
      2. 6.2.2 United Kingdom | |
      3. 6.2.3 France | |
      4. 6.2.4 Italy | |
      5. 6.2.5 Spain | |
      6. 6.2.6 Nordic Countries | |
      7. 6.2.7 Russia | |
      8. 6.2.8 Rest of Europe |
    3. 6.3 Asia-Pacific | |
      1. 6.3.1 China | |
      2. 6.3.2 India | |
      3. 6.3.3 Japan | |
      4. 6.3.4 South Korea | |
      5. 6.3.5 ASEAN | |
      6. 6.3.6 Rest of Asia-Pacific |
    4. 6.4 South America | |
      1. 6.4.1 Brazil | |
      2. 6.4.2 Argentina | |
      3. 6.4.3 Rest of South America |
    5. 6.5 Middle East & Africa | |
      1. 6.5.1 Saudi Arabia | |
      2. 6.5.2 UAE | |
      3. 6.5.3 South Africa | |
      4. 6.5.4 Egypt | |
      5. 6.5.5 Rest of MEA
  7. 7 Competitive Landscape |
    1. 7.1 Market Share Analysis (2025) |
    2. 7.2 Competitive Benchmarking Matrix |
    3. 7.3 Company Profiles | |
      1. 7.3.1 Abbott Laboratories | |
      2. 7.3.2 F. Hoffmann-La Roche | |
      3. 7.3.3 DexCom | |
      4. 7.3.4 Medtronic | |
      5. 7.3.5 Siemens Healthineers | |
      6. 7.3.6 Danaher Corporation | |
      7. 7.3.7 bioMérieux | |
      8. 7.3.8 Bio-Rad Laboratories | |
      9. 7.3.9 Nova Biomedical | |
      10. 7.3.10 Ascensia Diabetes Care
  8. 8 Future Outlook & Strategic Recommendations (2026–2035) |
    1. 8.1 AI-Augmented Sensing and Autonomous Diagnostics |
    2. 8.2 Platform Economics and Recurring Revenue Models |
    3. 8.3 Sustainability and Green Biosensor Manufacturing |
    4. 8.4 Decentralized Clinical Trials and Real-World Evidence
  9. 9 Recent Developments & News
  10. 10 Frequently Asked Questions (FAQs)
  11. 11 Report Scope & Methodology |
    1. 11.1 Study Period & Base Year |
    2. 11.2 Data Sources & Citations |
    3. 11.3 Abbreviations
  12. 12 LIST OF TABLES |
  13. TABLE 1 Global Biosensor Market Size & Forecast, by Revenue (USD Billion), 2021–2035 |
  14. TABLE 2 Global Biosensor Market – Year-over-Year Growth Analysis, 2021–2035 |
  15. TABLE 3 Global Biosensor Market – Driver Impact Analysis |
  16. TABLE 4 Global Biosensor Market – Restraint Impact Analysis |
  17. TABLE 5 Global Biosensor Market Size, by Product Type, 2021–2035 (USD Billion) |
  18. TABLE 6 Global Biosensor Market Size, by Technology, 2021–2035 (USD Billion) |
  19. TABLE 7 Global Biosensor Market Size, by End User, 2021–2035 (USD Billion) |
  20. TABLE 8 Global Biosensor Market Size, by Region, 2021–2035 (USD Billion) |
  21. TABLE 9 North America Biosensor Market Size, by Country, 2021–2035 (USD Billion) |
  22. TABLE 10 Europe Biosensor Market Size, by Country, 2021–2035 (USD Billion) |
  23. TABLE 11 Asia-Pacific Biosensor Market Size, by Country, 2021–2035 (USD Billion) |
  24. TABLE 12 South America Biosensor Market Size, by Country, 2021–2035 (USD Billion) |
  25. TABLE 13 Middle East & Africa Biosensor Market Size, by Country, 2021–2035 (USD Billion) |
  26. TABLE 14 North America Biosensor Market Size, by Product Type, 2021–2035 (USD Billion) |
  27. TABLE 15 North America Biosensor Market Size, by Technology, 2021–2035 (USD Billion) |
  28. TABLE 16 North America Biosensor Market Size, by End User, 2021–2035 (USD Billion) |
  29. TABLE 17 Europe Biosensor Market Size, by Product Type, 2021–2035 (USD Billion) |
  30. TABLE 18 Europe Biosensor Market Size, by Technology, 2021–2035 (USD Billion) |
  31. TABLE 19 Europe Biosensor Market Size, by End User, 2021–2035 (USD Billion) |
  32. TABLE 20 Asia-Pacific Biosensor Market Size, by Product Type, 2021–2035 (USD Billion) |
  33. TABLE 21 Asia-Pacific Biosensor Market Size, by Technology, 2021–2035 (USD Billion) |
  34. TABLE 22 Asia-Pacific Biosensor Market Size, by End User, 2021–2035 (USD Billion) |
  35. TABLE 23 South America Biosensor Market Size, by Product Type, 2021–2035 (USD Billion) |
  36. TABLE 24 South America Biosensor Market Size, by Technology, 2021–2035 (USD Billion) |
  37. TABLE 25 South America Biosensor Market Size, by End User, 2021–2035 (USD Billion) |
  38. TABLE 26 Middle East & Africa Biosensor Market Size, by Product Type, 2021–2035 (USD Billion) |
  39. TABLE 27 Middle East & Africa Biosensor Market Size, by Technology, 2021–2035 (USD Billion) |
  40. TABLE 28 Middle East & Africa Biosensor Market Size, by End User, 2021–2035 (USD Billion) |
  41. TABLE 29 Competitive Benchmarking Matrix – Global Biosensor Market, 2025 |
  42. TABLE 30 Company Profiles – Key Players, Global Biosensor Market |
  43. TABLE 31 Recent Developments & Strategic Announcements, 2023–2025 |
  44. TABLE 32 Report Scope & Methodology Summary
  45. 13 LIST OF FIGURES |
  46. FIGURE 1 Global Biosensor Market Dynamics — Drivers, Restraints, and Opportunities |
  47. FIGURE 2 Biosensor Industry Value Chain Analysis |
  48. FIGURE 3 Porter's Five Forces Analysis — Global Biosensor Market |
  49. FIGURE 4 Global Biosensor Market Size Trend (USD Billion), 2021–2035 |
  50. FIGURE 5 Global Biosensor Market Share, by Product Type (%), 2025 |
  51. FIGURE 6 Global Biosensor Market Share, by Technology (%), 2025 |
  52. FIGURE 7 Global Biosensor Market Share, by End User (%), 2025 |
  53. FIGURE 8 Global Biosensor Market Share, by Region (%), 2025 |
  54. FIGURE 9 North America Biosensor Market Share, by Country (%), 2025 |
  55. FIGURE 10 Europe Biosensor Market Share, by Country (%), 2025 |
  56. FIGURE 11 Asia-Pacific Biosensor Market Share, by Country (%), 2025 |
  57. FIGURE 12 South America Biosensor Market Share, by Country (%), 2025 |
  58. FIGURE 13 Middle East & Africa Biosensor Market Share, by Country (%), 2025 |
  59. FIGURE 14 Competitive Landscape — Global Biosensor Market Revenue Share (%), 2025
Share::
Request Free Sample

Segmentation Quick Reference

DimensionSub-SegmentsDominant SegmentFastest Growing Segment
Product TypeMedical Biosensors, Food Toxicity Biosensors, Other BiosensorsMedical BiosensorsWearable & Embedded Biosensors
TechnologyElectrochemical, Optical, Piezoelectric, Thermal, NanomechanicalElectrochemicalOptical
End UserPoint-of-Care Testing, Home Healthcare Diagnostics, Research Laboratories, OthersPoint-of-Care TestingHome Healthcare Diagnostics
GeographyNorth America, Europe, Asia-Pacific, South America, Middle East & AfricaNorth AmericaAsia-Pacific


Market Segmentation Overview

By Product Type

Sub-SegmentKey Trend
Medical BiosensorsCGM expansion beyond Type 1 diabetes into Type 2 and wellness applications
Food Toxicity BiosensorsStricter pesticide and mycotoxin residue regulations are driving field-deployable testing.
Other BiosensorsEnvironmental heavy-metal and industrial process monitoring adoption


Medical biosensors remain the revenue cornerstone of the global biosensor industry, with continuous glucose monitoring platforms driving the majority of unit shipments. Food toxicity and environmental monitoring applications are expanding as regulatory frameworks worldwide mandate faster, on-site testing capabilities.

By Technology

Sub-SegmentKey Trend
ElectrochemicalMature enzyme-electrode chemistries dominate high-volume glucose and blood gas testing.
OpticalSurface plasmon resonance and fluorescence-based multiplexing gain clinical traction
PiezoelectricQuartz crystal microbalance platforms enable mass-sensitive immunoassay detection.
ThermalCalorimetric sensing supports enzyme activity monitoring in bioprocessing.
NanomechanicalCantilever-based architectures advance toward clinical-grade molecular diagnostics.


Electrochemical technology holds the largest share due to decades of manufacturing optimization and established clinical validation. Optical and nanomechanical platforms represent the innovation frontier, with multiplexing capabilities and label-free detection driving adoption in research and companion diagnostics applications.

By End User

Sub-SegmentKey Trend
Point-of-Care TestingMigration of laboratory workflows to bedside, pharmacy, and community clinic settings
Home Healthcare DiagnosticsConsumer self-management and post-pandemic comfort with at-home testing
Research LaboratoriesGrowing use in drug discovery, biomarker screening and decentralized clinical trials
OthersVeterinary diagnostics and industrial quality control applications


Point-of-care testing leads end-user demand as health systems decentralize diagnostic services to reduce turnaround times and improve patient outcomes. Home healthcare diagnostics is the fastest-expanding channel, supported by aging demographics, chronic disease prevalence, and expanding reimbursement coverage for remote monitoring devices.


Share::
Request Free Sample
Download PDF ×

We do not share your information with anyone. However, we may send you emails based on your report interest from time to time. You may contact us at any time to opt-out.