• Cat-intel
  • MedIntelliX
  • Resources
  • About Us
  • Hero Background
    English
    Chinese
    French
    Japanese
    Korean
    German
    Spanish

    Blood Grouping Reagents Market Trends

    ID: MRFR/HC/9241-CR
    142 Pages
    Rahul Gotadki
    November 2021

    Blood Grouping Reagents Market Research Report Information by Product (Consumables and Instruments), by Technique (PCR-based and Microarray Techniques, Assay-Based Techniques, Massively Parallel Sequencing Techniques, Serology), by Test Type (Blood Group and Phenotypes, Antibody Screening, Crossmatching Tests, Antibody Identification, Coombs’s Test, and Antigen Typing), by End User (Hospitals, ...

    Share:
    Download PDF ×

    We do not share your information with anyone. However, we may send you emails based on your report interest from time to time. You may contact us at any time to opt-out.

    Blood Grouping Reagents Market Infographic
    $ 4,950.0
    $ 5,950.0
    $ 7,250.0

    Market Trends

    Key Emerging Trends in the Blood Grouping Reagents Market

    The surge in chronic disorders has spurred a heightened demand for effective treatments worldwide. Conditions like anemia, hemophilia, lymphoma, diabetes, leukemia, and the ongoing COVID-19 pandemic collectively contribute to a significant health burden. According to the Center for Disease Control (CDC), data from 2019 indicates that six out of ten adults grapple with chronic diseases, while four out of ten contend with multiple chronic ailments. This statistical insight underscores the escalating burden of diseases and the imperative need for their efficient management. Anemia, a prevalent condition globally, has a staggering impact, affecting over 1.62 billion individuals, accounting for nearly 24.8% of the world's population, as highlighted by the World Health Organization (WHO). Particularly concerning is its prevalence among women of reproductive age, primarily due to iron deficiency. Women aged 15-49 are notably susceptible, with WHO reports from 2019 indicating that 29.9% within this demographic endure anemia. Moreover, the data highlights a concerning prevalence among children aged 6-59 months, with 39.8% affected globally. In the African region, the impact is notably severe, affecting a staggering 60.2% of children within the same age group. The burden of anemia extends beyond specific demographics. WHO data points to 539,000 cases of non-pregnant individuals affected by anemia globally. Notably, Southeast Asia stands out, recording the highest number of non-pregnant individuals afflicted by anemia, with figures reaching 234,000 cases. This data underscores the global impact of anemia and its varying prevalence across different demographics and regions. These statistics illuminate the pervasive impact of chronic diseases like anemia and the substantial burden they pose on global health. Understanding the demographic-specific prevalence is crucial in formulating targeted interventions and strategies to mitigate the impact of these conditions. Addressing the multifaceted challenges posed by chronic disorders demands a concerted effort towards effective management and interventions tailored to diverse populations and regions. The global surge in various cancer types, including lung, blood, breast, and liver cancers, reflects an alarming trend. GLOBOCAN 2020 estimates from the International Agency for Research on Cancer (IARC) revealed a staggering toll, with approximately 19.3 million new cancer cases and about 10.0 million cancer-related deaths worldwide in 2020. In the United States alone, the National Cancer Institute reported an estimated 1,735,350 new cancer diagnoses and 609,640 deaths in 2018. The trajectory of cancer cases intersects with the impact of the COVID-19 pandemic, further influencing the growth dynamics of the stem cell market. Looking specifically at blood cancers, the American Cancer Society foresees diagnosing over 186,400 individuals in the US with leukemia, lymphoma, or myeloma by the end of 2021. These specific blood cancer cases are expected to constitute approximately 9.8% of the estimated 1,898,160 new cancer cases projected across the US in 2021. This significant upsurge in blood cancer cases is poised to stimulate the demand for blood grouping reagents on a global scale.

    Market Summary

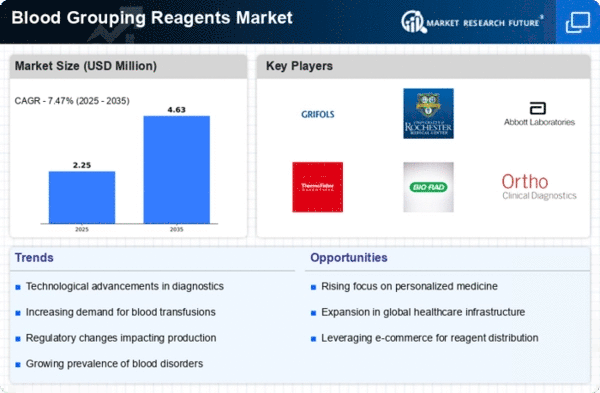
    As per Market Research Future Analysis, the global Blood Grouping Reagents Market is projected to reach USD 0.0020 billion by 2032, growing at a CAGR of 7.6% from 2023 to 2032. The market was valued at USD 1,578.78 million in 2020. Blood grouping reagents are essential for identifying blood types based on antigens present on red blood cells. The market is driven by the rising prevalence of chronic disorders and increased spending on medical research, although concerns regarding the efficiency of test kits pose challenges. The COVID-19 pandemic has further amplified the demand for blood grouping reagents due to the surge in diagnostic testing requirements. The market is segmented by product, technique, test type, end user, and region, with significant growth opportunities in automated blood grouping devices.

    Key Market Trends & Highlights

    Key trends influencing the Blood Grouping Reagents Market include technological advancements and increasing demand for automation.

    • Market size in 2020: USD 1,578.78 million. Projected market size by 2032: USD 0.0020 billion. CAGR during 2023-2032: 7.6%. Anemia affects over 1.62 billion people globally, driving reagent demand.

    Market Size & Forecast

    2020 Market Size USD 1,578.78 million
    2032 Market Size USD 0.0020 billion
    CAGR 7.6%
    Largest Regional Market North America

    Major Players

    <p>Merck KGaA (Germany), Bio-Rad Laboratories, Inc (US), Novacyt Group (France), Beckman Coulter, Inc (US), Grifols SA (Spain), Immucor, Inc (US)</p>

    Market Trends

    <p>The ongoing advancements in blood grouping reagents are likely to enhance diagnostic accuracy and improve patient outcomes in transfusion medicine.</p>

    U.S. Food and Drug Administration (FDA)

    Blood Grouping Reagents Market Market Drivers

    Market Trends and Projections

    Regulatory Support for Blood Safety

    Regulatory bodies worldwide are increasingly emphasizing the importance of blood safety, which significantly impacts the Global Blood Grouping Reagents Market Industry. Stringent regulations regarding blood testing and safety protocols necessitate the use of high-quality reagents for accurate blood typing. Compliance with these regulations ensures that healthcare providers can deliver safe transfusions, thereby enhancing patient outcomes. As regulations evolve, the market is likely to adapt, leading to innovations in reagent development. This regulatory landscape not only supports market growth but also reinforces the commitment to patient safety in transfusion practices.

    Rising Demand for Blood Transfusions

    The Global Blood Grouping Reagents Market Industry experiences a notable increase in demand for blood transfusions, driven by a growing prevalence of chronic diseases and surgical procedures. As healthcare systems worldwide expand their capabilities, the need for accurate blood typing becomes paramount. In 2024, the market is projected to reach 0.11 USD Billion, reflecting the urgency for reliable reagents in transfusion medicine. This trend is expected to continue, with the market adapting to the rising number of transfusions required annually, thereby enhancing the overall efficiency of blood banks and hospitals.

    Increasing Awareness of Blood Donation

    The Global Blood Grouping Reagents Market Industry benefits from heightened awareness regarding the importance of blood donation. Campaigns aimed at educating the public about the need for diverse blood types have led to increased participation in blood donation drives. This surge in donations necessitates the use of effective blood grouping reagents to ensure compatibility and safety. As more individuals engage in donating blood, the demand for reliable reagents is expected to rise, thereby supporting the growth of the market. This trend underscores the critical role of education in fostering a culture of donation.

    Market Challenges and Declining Growth Rates

    Despite the growth potential, the Global Blood Grouping Reagents Market Industry faces challenges that may hinder its expansion. Projections indicate a compound annual growth rate (CAGR) of -29.29% for the period from 2025 to 2035, suggesting a decline in market activity. Factors contributing to this trend may include saturation in certain regions and the emergence of alternative technologies. As the market navigates these challenges, stakeholders must adapt their strategies to maintain relevance and ensure sustainability in a rapidly changing healthcare landscape.

    Technological Advancements in Blood Grouping

    Technological innovations play a crucial role in shaping the Global Blood Grouping Reagents Market Industry. The introduction of automated blood grouping systems and advanced reagents enhances accuracy and reduces turnaround times in blood typing processes. These advancements not only improve patient safety but also streamline laboratory workflows. As healthcare facilities increasingly adopt these technologies, the market is likely to witness a surge in demand for high-quality reagents. This trend indicates a shift towards more sophisticated blood grouping solutions, which could potentially lead to a more efficient healthcare delivery system.

    Market Segment Insights

    Regional Insights

    Key Companies in the Blood Grouping Reagents Market market include

    Industry Developments

    • In July 2020, Merck KGaA invested 18 million euros in new life science laboratory in Switzerland. The laboratory facility is to be built in Buchs (Switzerland) to support the growth of the company in the reference materials.
    • In April 2018, Quotient Limited received FDA approval for U.S. commercialization of seven new blood bank reagents.
    • In December 2017, Beckman Coulter, Inc. expanded its development & manufacturing facility based in Lismeehan, County Clare (Ireland). At this facility, the company develops and manufactures reagents used in clinical chemistry, hematology, and immunochemistry product.

    Future Outlook

    Blood Grouping Reagents Market Future Outlook

    <p>The Blood Grouping Reagents Market is projected to experience a -29.29% CAGR from 2024 to 2035, driven by technological advancements, increasing demand for blood transfusions, and regulatory changes.</p>

    New opportunities lie in:

    • <p>Develop innovative, cost-effective reagents to enhance market penetration. Leverage digital platforms for efficient distribution and customer engagement. Invest in R&amp;D for next-generation blood grouping technologies to gain competitive edge.</p>

    <p>By 2035, the market is expected to stabilize, adapting to evolving healthcare demands and technological advancements.</p>

    Market Segmentation

    Report Overview

    Market Segmentation:

    Report Scope

    Report Attribute/MetricDetails
      Market Size  0.0020 Billion
      CAGR  7.6%
      Base Year  2021
      Forecast Period  2023-2032
      Historical Data  2020
      Forecast Units  Value (USD Billion)
      Report Coverage  Revenue Forecast, Competitive Landscape, Growth Factors, and Trends
      Segments Covered  Products, Technique, Test Type, End User, and Region
      Geographies Covered  North America, Europe, Asia-Pacific, and Rest of the World
      Key Vendors  Merck KGaA (Germany), Bio-Rad Laboratories, Inc (US), Novacyt Group (France), Beckman Coulter, Inc (US), Haemokinesis Pty Ltd (Australia), MTC Med. Produkte GmbH (Germany), DAY medical SA (Switzerland), Rapid Labs Ltd (UK), Ortho Clinical Diagnostics (US), Diagast SAS (France), and others
      Key Market Opportunities  • Emergence of automated medical devices
      Key Market Drivers  • Increasing prevalence of chronic disorders • Increasing spending in medical research

    Market Highlights

    Author

    Rahul Gotadki
    Assistant Manager

    She holds an experience of about 6+ years in market research and business consulting, working under the spectrum of information communication technology, telecommunications and semiconductor domains. aarti conceptualizes and implements a scalable business strategy and provides strategic leadership to the clients. her expertise lies in market estimation, competitive intelligence, pipeline analysis, customer assessment, etc.

    Leave a Comment

    Latest Comments

    John Doe
    john@example.com

    This is a great article! Really helped me understand the topic better.

    Posted on July 23, 2025, 10:15 AM
    Jane Smith
    jane@domain.com

    Thanks for sharing this. I’ve bookmarked it for later reference.

    Posted on July 22, 2025, 7:45 PM

    FAQs

    How Big is the blood grouping reagents market?

    Blood Grouping Reagents Market size is projected to be worth USD 0.0020 billion at CAGR of 7.6% during the forecast period (2023 - 2032), The market was valued at USD 1,578.78 million in 2020.

    Who are the key players in the market of blood grouping reagents?

    Merck KGaA (Germany), Bio-Rad Laboratories, Inc (US), Novacyt Group (France), Beckman Coulter, Inc (US), Haemokinesis Pty Ltd (Australia), MTC Med. Produkte GmbH (Germany), DAY medical SA (Switzerland), Rapid Labs Ltd (UK), Ortho Clinical Diagnostics (US), Diagast SAS (France) are the key players in the market of blood grouping reagents

    Which region is predicted to lead the market of blood grouping reagents?

    North America holds the largest share in the global market of lood grouping reagents

    What is the major market driver of blood grouping reagents?

    Increasing prevalence of chronic disorders and Increasing spending in medical research are the major market driver of blood grouping reagents

    Which factors may limit the market growth of blood grouping reagents?

    Concern pertaining to the efficiency and accuracy of test kits may limit the market growth of blood grouping reagents

    1. Table of Contents
    2. Executive Summary
    3. Market Introduction
      1. Scope of the Study
      2. RESEARCH OBJECTIVE
      3. MARKET STRUCTURE
      4. ASSUMPTIONS & LIMITATIONS
    4. Research Methodology
      1. DATA MINING
      2. SECONDARY RESEARCH
      3. PRIMARY RESEARCH
      4. BREAKDOWN OF PRIMARY RESPONDENTS
      5. FORECASTING TECHNIQUES
      6. Research Methodology FOR MARKET SIZE ESTIMATION
        1. Bottom-up Approach
        2. TOP-DOWN APPROACH
      7. DATA TRIANGULATION
      8. VALIDATION
    5. MARKET DYNAMICS
      1. OVERVIEW
      2. DRIVERS
        1. INCREASING PREVALENCE OF CHRONIC DISORDERS
        2. INCREASING SPENDING IN MEDICAL RESEARCH
      3. RESTRAINT
        1. CONCERNS PERTAINING TO THE EFFICIENCY AND ACCURACY OF TEST KITS
      4. OPPORTUNITY
        1. EMERGENCE OF AUTOMATED BLOOD GROUPING DEVICES
      5. TECHNOLOGICAL DISRUPTION
    6. MARKET FACTOR ANALYSIS
      1. VALUE CHAIN ANALYSIS
        1. R&D AND DESIGNING
        2. MANUFACTURING
        3. DISTRIBUTION & SALES
        4. POST-SALES REVIEW
      2. PORTER'S FIVE FORCES MODEL
        1. BARGAINING POWER OF BUYERS
        2. BARGAINING POWER OF SUPPLIERS
        3. THREAT OF NEW ENTRANTS
        4. THREAT OF SUBSTITUTES
        5. INTENSITY OF RIVALRY
      3. IMPACT OF COVID-19
        1. IMPACT ON DEMAND
        2. IMPACT ON SUPPLY CHAIN
      4. VOLUME OF TESTS FOR DONATED BLOOD, BY REGION, 2020
      5. BLOOD TRANSFUSION VOLUME, BY REGION, 2020
    7. GLOBAL BLOOD GROUPING REAGENTS, BY PRODUCT
      1. OVERVIEW
      2. CONSUMABLES
      3. INSTRUMENTS
        1. FULLY-AUTOMATED INSTRUMENTS
        2. SEMI-AUTOMATED INSTRUMENTS
    8. GLOBAL BLOOD GROUPING REAGENTS, BY TECHNIQUE
      1. OVERVIEW
      2. PCR-BASED AND MICROARRAY TECHNIQUE
      3. ASSAY-BASED TECHNIQUES
      4. MASSIVELY PARALLEL SEQUENCING TECHNIQUES
      5. SEROLOGY
        1. GEL TECHNIQUE
        2. EMT
        3. SPRCA
        4. GLASS SLIDE AND TUBES
        5. CASSETTE/KIT
        6. OTHER SEROLOGY
      6. OTHER TECHNIQUES
    9. GLOBAL BLOOD GROUPING REAGENTS, BY TEST TYPE
      1. OVERVIEW
      2. BLOOD GROUP AND PHENOTYPES
      3. ANTIBODY SCREENING
      4. CROSSMATCHING TESTS
      5. ANTIBODY IDENTIFICATION
      6. COOMBS TEST
      7. ANTIGEN TYPING
    10. GLOBAL BLOOD GROUPING REAGENTS, BY END USER
      1. OVERVIEW
      2. HOSPITALS
      3. BLOOD BANKS
      4. CLINICAL LABORATORIES
    11. GLOBAL BLOOD GROUPING REAGENTS MARKET, BY REGION
      1. OVERVIEW
      2. NORTH AMERICA
        1. US
        2. CANADA
      3. EUROPE
        1. GERMANY
        2. UK
        3. FRANCE
        4. SPAIN
        5. ITALY
        6. REST OF EUROPE
      4. ASIA PACIFIC
        1. CHINA
        2. JAPAN
        3. INDIA
        4. SOUTH KOREA
        5. AUSTRALIA
        6. REST OF ASIA-PACIFIC
      5. REST OF THE WORLD
        1. MIDDLE EAST
        2. AFRICA
        3. LATIN AMERICA
    12. Competitive Landscape
      1. COMPETITIVE OVERVIEW
      2. MAJOR PLAYERS IN THE GLOBAL BLOOD GROUPING REAGENTS MARKET
      3. MAJOR GROWTH STRATEGIES IN THE GLOBAL BLOOD GROUPING REAGENTS MARKET
      4. COMPETITIVE BENCHMARKING
      5. LEADING PLAYERS IN TERMS OF NUMBER OF DEVELOPMENTS IN THE GLOBAL BLOOD GROUPING REAGENTS MARKET
      6. KEY DEVELOPMENTS & GROWTH STRATEGIES
        1. NEW PRODUCT DEVELOPMENTS/LAUNCHES
        2. COLLABORATIONS/EXPANSIONS/PARTNERSHIPS/INVESTMENTS
      7. MAJOR PLAYERS FINANCIAL MATRIX
        1. REVENUE OF MAJOR PLAYERS, 2020
        2. R&D EXPENDITURE
    13. COMPANY PROFILES
      1. MERCK KGAA
        1. COMPANY OVERVIEW
        2. FINANCIAL OVERVIEW
        3. PRODUCTS OFFERED
        4. KEY DEVELOPMENTS
        5. SWOT ANALYSIS
        6. KEY STRATEGIES
      2. BIO-RAD LABORATORIES, INC.
        1. COMPANY OVERVIEW
        2. FINANCIAL OVERVIEW
        3. PRODUCTS OFFERED
        4. KEY DEVELOPMENTS
        5. SWOT ANALYSIS
        6. KEY STRATEGIES
      3. NOVACYT GROUP
        1. COMPANY OVERVIEW
        2. FINANCIAL OVERVIEW
        3. PRODUCTS/SERVICES OFFERED
        4. KEY DEVELOPMENTS
        5. KEY STRATEGIES
      4. BECKMAN COULTER, INC.
        1. COMPANY OVERVIEW
        2. FINANCIAL OVERVIEW
        3. PRODUCTS OFFERED
        4. KEY DEVELOPMENTS
        5. KEY STRATEGIES
      5. HAEMOKINESIS PTY LTD
        1. COMPANY OVERVIEW
        2. FINANCIAL OVERVIEW
        3. PRODUCTS OFFERED
        4. KEY DEVELOPMENTS
        5. KEY STRATEGIES
      6. MTC MED. PRODUKTE GMBH
        1. COMPANY OVERVIEW
        2. FINANCIAL OVERVIEW
        3. PRODUCTS/SERVICES OFFERED
        4. KEY DEVELOPMENTS
        5. KEY STRATEGIES
      7. DAY MEDICAL SA
        1. COMPANY OVERVIEW
        2. FINANCIAL OVERVIEW
        3. PRODUCTS OFFERED
        4. KEY DEVELOPMENTS
        5. KEY STRATEGIES
      8. RAPID LABS LTD
        1. COMPANY OVERVIEW
        2. FINANCIAL OVERVIEW
        3. PRODUCTS OFFERED
        4. KEY DEVELOPMENTS
        5. KEY STRATEGIES
      9. ORTHO CLINICAL DIAGNOSTICS
        1. COMPANY OVERVIEW
        2. FINANCIAL OVERVIEW
        3. PRODUCTS OFFERED
        4. KEY DEVELOPMENTS
        5. SWOT ANALYSIS
        6. KEY STRATEGIES
      10. DIAGAST SAS
        1. COMPANY OVERVIEW
        2. FINANCIAL OVERVIEW
        3. PRODUCTS/SERVICES OFFERED
        4. KEY DEVELOPMENTS
        5. KEY STRATEGIES
      11. GRIFOLS SA
        1. COMPANY OVERVIEW
        2. FINANCIAL OVERVIEW
        3. PRODUCTS/SERVICES OFFERED
        4. KEY DEVELOPMENTS
        5. SWOT ANALYSIS
        6. KEY STRATEGIES
      12. IMMUCOR, INC.
        1. COMPANY OVERVIEW
        2. FINANCIAL OVERVIEW
        3. PRODUCTS/SERVICES OFFERED
        4. KEY DEVELOPMENTS
        5. SWOT ANALYSIS
        6. KEY STRATEGIES
      13. QUOTIENT LTD
        1. COMPANY OVERVIEWS
        2. FINANCIAL OVERVIEW
        3. PRODUCTS/SERVICES OFFERED
        4. KEY DEVELOPMENTS
        5. SWOT ANALYSIS
        6. KEY STRATEGIES
      14. YUVRAJ BIOBIZ INCUBATOR INDIA PVT LTD
        1. COMPANY OVERVIEW
        2. FINANCIAL OVERVIEW
        3. PRODUCTS/SERVICES OFFERED
        4. KEY DEVELOPMENTS
        5. KEY STRATEGIES
      15. TULIP DIAGNOSTICS
        1. COMPANY OVERVIEW
        2. FINANCIAL OVERVIEW
        3. PRODUCTS/SERVICES OFFERED
        4. KEY DEVELOPMENTS
        5. KEY STRATEGIES
      16. AIKANG
        1. COMPANY OVERVIEW
        2. FINANCIAL OVERVIEW
        3. PRODUCTS/SERVICES OFFERED
        4. KEY DEVELOPMENTS
        5. KEY STRATEGIES
      17. INTEC
        1. COMPANY OVERVIEW
        2. FINANCIAL OVERVIEW
        3. PRODUCTS OFFERED
        4. KEY DEVELOPMENTS
        5. KEY STRATEGIES
    14. APPENDIX
      1. REFERENCES
      2. RELATED REPORTS
    15. List of Tables and Figures
      1. LIST OF TABLES
      2. TABLE 1 LIST OF ASSUMPTIONS & LIMITATIONS
      3. TABLE 2 PRIMARY INTERVIEWS AND INFORMATION GATHERING PROCESS
      4. TABLE 3 PREVALENCE OF TRANSFUSION-TRANSMISSIBLE INFECTIONS IN BLOOD DONATIONS (MEDIAN, INTERQUARTILE RANGE (IQR)), BY INCOME GROUPS
      5. TABLE 4 AVERAGE VOLUME OF TESTS, BY REGION (MILLION)
      6. TABLE 5 AVERAGE BLOOD TRANSFUSION VOLUME, BY REGION (MILLION UNITS)
      7. TABLE 6 GLOBAL: BLOOD GROUPING REAGENTS MARKET, BY PRODUCT, 2022–2030 (USD MILLION)
      8. TABLE 7 GLOBAL: BLOOD GROUPING REAGENTS MARKET, FOR CONSUMABLES, BY REGION, 2022–2030 (USD MILLION)
      9. TABLE 8 GLOBAL: BLOOD GROUPING REAGENTS MARKET, FOR INSTRUMENTS, BY REGION, 2022–2030 (USD MILLION)
      10. TABLE 9 GLOBAL: BLOOD GROUPING REAGENTS MARKET, FOR INSTRUMENTS, BY TYPE, 2022–2030 (USD MILLION)
      11. TABLE 10 GLOBAL: BLOOD GROUPING REAGENTS MARKET, FOR FULLY-AUTOMATED, BY REGION, 2022–2030 (USD MILLION)
      12. TABLE 11 GLOBAL: BLOOD GROUPING REAGENTS MARKET, FOR SEMI-AUTOMATED, BY REGION, 2022–2030 (USD MILLION)
      13. TABLE 12 GLOBAL: BLOOD GROUPING REAGENTS MARKET, BY TECHNIQUE, 2022–2030 (USD MILLION)
      14. TABLE 13 GLOBAL: BLOOD GROUPING REAGENTS MARKET, FOR PCR-BASED AND MICROARRAY TECHNIQUE, BY REGION, 2022–2030 (USD MILLION)
      15. TABLE 14 GLOBAL: BLOOD GROUPING REAGENTS MARKET, FOR ASSAY-BASED TECHNIQUES, BY REGION, 2022–2030 (USD MILLION)
      16. TABLE 15 GLOBAL: BLOOD GROUPING REAGENTS MARKET, FOR MASSIVELY PARALLEL SEQUENCING TECHNIQUES, BY REGION, 2022–2030 (USD MILLION)
      17. TABLE 16 GLOBAL: BLOOD GROUPING REAGENTS MARKET, FOR SEROLOGY, BY REGION, 2022–2030 (USD MILLION)
      18. TABLE 17 GLOBAL: BLOOD GROUPING REAGENTS MARKET, FOR SEROLOGY, BY TYPE, 2022–2030 (USD MILLION)
      19. TABLE 18 GLOBAL: BLOOD GROUPING REAGENTS MARKET, FOR GEL TECHNIQUE, BY REGION, 2022–2030 (USD MILLION)
      20. TABLE 19 GLOBAL: BLOOD GROUPING REAGENTS MARKET, FOR EMT, BY REGION, 2022–2030 (USD MILLION)
      21. TABLE 20 GLOBAL: BLOOD GROUPING REAGENTS MARKET, FOR SPRCA, BY REGION, 2022–2030 (USD MILLION)
      22. TABLE 21 GLOBAL: BLOOD GROUPING REAGENTS MARKET, FOR GLASS SLIDE AND TUBES, BY REGION, 2022–2030 (USD MILLION)
      23. TABLE 22 GLOBAL: BLOOD GROUPING REAGENTS MARKET, FOR CASSETTE/KIT, BY REGION, 2022–2030 (USD MILLION)
      24. TABLE 23 GLOBAL: BLOOD GROUPING REAGENTS MARKET, FOR OTHER SEROLOGY, BY REGION, 2022–2030 (USD MILLION)
      25. TABLE 24 GLOBAL: BLOOD GROUPING REAGENTS MARKET, FOR OTHER TECHNIQUES, BY REGION, 2022–2030 (USD MILLION)
      26. TABLE 25 GLOBAL: BLOOD GROUPING REAGENTS MARKET, BY TEST TYPE, 2022–2030 (USD MILLION)
      27. TABLE 26 GLOBAL: BLOOD GROUPING REAGENTS MARKET, FOR BLOOD GROUP AND PHENOTYPE, BY REGION, 2022–2030 (USD MILLION)
      28. TABLE 27 GLOBAL: BLOOD GROUPING REAGENTS MARKET, FOR ANTIBODY SCREENING, BY REGION, 2022–2030 (USD MILLION)
      29. TABLE 28 GLOBAL: BLOOD GROUPING REAGENTS MARKET, FOR CROSS-MATCHING TESTS, BY REGION, 2022–2030 (USD MILLION)
      30. TABLE 29 GLOBAL: BLOOD GROUPING REAGENTS MARKET, FOR ANTIBODY IDENTIFICATION, BY REGION, 2022–2030 (USD MILLION)
      31. TABLE 30 GLOBAL: BLOOD GROUPING REAGENTS MARKET, FOR COOMBS TESTS, BY REGION, 2022–2030 (USD MILLION)
      32. TABLE 31 GLOBAL: BLOOD GROUPING REAGENTS MARKET, FOR ANTIGEN TYPING, BY REGION, 2022–2030 (USD MILLION)
      33. TABLE 32 GLOBAL: BLOOD GROUPING REAGENTS MARKET, BY END USER, 2022–2030 (USD MILLION)
      34. TABLE 33 GLOBAL: BLOOD GROUPING REAGENTS MARKET, FOR HOSPITALS, BY REGION, 2022–2030 (USD MILLION)
      35. TABLE 34 GLOBAL: BLOOD GROUPING REAGENTS MARKET, FOR BLOOD BANKS, BY REGION, 2022–2030 (USD MILLION)
      36. TABLE 35 GLOBAL: BLOOD GROUPING REAGENTS MARKET, FOR CLINICAL LABORATORIES, BY REGION, 2022–2030 (USD MILLION)
      37. TABLE 36 GLOBAL: BLOOD GROUPING REAGENTS MARKET, BY REGION, 2022–2030 (USD MILLION)
      38. TABLE 37 NORTH AMERICA: BLOOD GROUPING REAGENTS MARKET, BY COUNTRY, 2022–2030 (USD MILLION)
      39. TABLE 38 NORTH AMERICA: BLOOD GROUPING REAGENTS MARKET, BY PRODUCT, 2022-2030 (USD MILLION)
      40. TABLE 39 NORTH AMERICA: BLOOD GROUPING REAGENTS MARKET FOR INSTRUMENTS, BY PRODUCT, 2022-2030 (USD MILLION)
      41. TABLE 40 NORTH AMERICA: BLOOD GROUPING REAGENTS MARKET, BY TECHNIQUE, 2022-2030 (USD MILLION)
      42. TABLE 41 NORTH AMERICA: BLOOD GROUPING REAGENTS MARKET FOR SEROLOGY, BY TECHNIQUE, 2022-2030 (USD MILLION)
      43. TABLE 42 NORTH AMERICA: BLOOD GROUPING REAGENTS MARKET, BY TEST TYPE, 2022-2030 (USD MILLION)
      44. TABLE 43 NORTH AMERICA: BLOOD GROUPING REAGENTS MARKET, BY END USER, 2022-2030 (USD MILLION)
      45. TABLE 44 US: BLOOD GROUPING REAGENTS MARKET, BY PRODUCT, 2022-2030 (USD MILLION)
      46. TABLE 45 US: BLOOD GROUPING REAGENTS MARKET FOR INSTRUMENTS, BY PRODUCT, 2022-2030 (USD MILLION)
      47. TABLE 46 US: BLOOD GROUPING REAGENTS MARKET, BY TECHNIQUE, 2022-2030 (USD MILLION)
      48. TABLE 47 US: BLOOD GROUPING REAGENTS MARKET FOR SEROLOGY, BY TECHNIQUE, 2022-2030 (USD MILLION)
      49. TABLE 48 US: BLOOD GROUPING REAGENTS MARKET, BY TEST TYPE, 2022-2030 (USD MILLION)
      50. TABLE 49 US: BLOOD GROUPING REAGENTS MARKET, BY END USER, 2022-2030 (USD MILLION)
      51. TABLE 50 CANADA: BLOOD GROUPING REAGENTS MARKET, BY PRODUCT, 2022-2030 (USD MILLION)
      52. TABLE 51 CANADA: BLOOD GROUPING REAGENTS MARKET FOR INSTRUMENTS, BY PRODUCT, 2022-2030 (USD MILLION)
      53. TABLE 52 CANADA: BLOOD GROUPING REAGENTS MARKET, BY TECHNIQUE, 2022-2030 (USD MILLION)
      54. TABLE 53 CANADA: BLOOD GROUPING REAGENTS MARKET FOR SEROLOGY, BY TECHNIQUE, 2022-2030 (USD MILLION)
      55. TABLE 54 CANADA: BLOOD GROUPING REAGENTS MARKET, BY TEST TYPE, 2022-2030 (USD MILLION)
      56. TABLE 55 CANADA: BLOOD GROUPING REAGENTS MARKET, BY END USER, 2022-2030 (USD MILLION)
      57. TABLE 56 EUROPE: BLOOD GROUPING REAGENTS MARKET, BY COUNTRY, 2022–2030 (USD MILLION)
      58. TABLE 57 EUROPE: BLOOD GROUPING REAGENTS MARKET, BY PRODUCT, 2022-2030 (USD MILLION)
      59. TABLE 58 EUROPE: BLOOD GROUPING REAGENTS MARKET FOR INSTRUMENTS, BY PRODUCT, 2022-2030 (USD MILLION)
      60. TABLE 59 EUROPE: BLOOD GROUPING REAGENTS MARKET, BY TECHNIQUE, 2022-2030 (USD MILLION)
      61. TABLE 60 EUROPE: BLOOD GROUPING REAGENTS MARKET FOR SEROLOGY, BY TECHNIQUE, 2022-2030 (USD MILLION)
      62. TABLE 61 EUROPE: BLOOD GROUPING REAGENTS MARKET, BY TEST TYPE, 2022-2030 (USD MILLION)
      63. TABLE 62 EUROPE: BLOOD GROUPING REAGENTS MARKET, BY END USER, 2022-2030 (USD MILLION)
      64. TABLE 63 GERMANY: BLOOD GROUPING REAGENTS MARKET, BY PRODUCT, 2022-2030 (USD MILLION)
      65. TABLE 64 GERMANY: BLOOD GROUPING REAGENTS MARKET FOR INSTRUMENTS, BY PRODUCT, 2022-2030 (USD MILLION)
      66. TABLE 65 GERMANY: BLOOD GROUPING REAGENTS MARKET, BY TECHNIQUE, 2022-2030 (USD MILLION)
      67. TABLE 66 GERMANY: BLOOD GROUPING REAGENTS MARKET FOR SEROLOGY, BY TECHNIQUE, 2022-2030 (USD MILLION)
      68. TABLE 67 GERMANY: BLOOD GROUPING REAGENTS MARKET, BY TEST TYPE, 2022-2030 (USD MILLION)
      69. TABLE 68 GERMANY: BLOOD GROUPING REAGENTS MARKET, BY END USER, 2022-2030 (USD MILLION)
      70. TABLE 69 UK: BLOOD GROUPING REAGENTS MARKET, BY PRODUCT, 2022-2030 (USD MILLION)
      71. TABLE 70 UK: BLOOD GROUPING REAGENTS MARKET FOR INSTRUMENTS, BY PRODUCT, 2022-2030 (USD MILLION)
      72. TABLE 71 UK: BLOOD GROUPING REAGENTS MARKET, BY TECHNIQUE, 2022-2030 (USD MILLION)
      73. TABLE 72 UK: BLOOD GROUPING REAGENTS MARKET FOR SEROLOGY, BY TECHNIQUE, 2022-2030 (USD MILLION)
      74. TABLE 73 UK: BLOOD GROUPING REAGENTS MARKET, BY TEST TYPE, 2022-2030 (USD MILLION)
      75. TABLE 74 UK: BLOOD GROUPING REAGENTS MARKET, BY END USER, 2022-2030 (USD MILLION)
      76. TABLE 75 FRANCE: BLOOD GROUPING REAGENTS MARKET, BY PRODUCT, 2022-2030 (USD MILLION)
      77. TABLE 76 FRANCE: BLOOD GROUPING REAGENTS MARKET FOR INSTRUMENTS, BY PRODUCT, 2022-2030 (USD MILLION)
      78. TABLE 77 FRANCE: BLOOD GROUPING REAGENTS MARKET, BY TECHNIQUE, 2022-2030 (USD MILLION)
      79. TABLE 78 FRANCE: BLOOD GROUPING REAGENTS MARKET FOR SEROLOGY, BY TECHNIQUE, 2022-2030 (USD MILLION)
      80. TABLE 79 FRANCE: BLOOD GROUPING REAGENTS MARKET, BY TEST TYPE, 2022-2030 (USD MILLION)
      81. TABLE 80 FRANCE: BLOOD GROUPING REAGENTS MARKET, BY END USER, 2022-2030 (USD MILLION)
      82. TABLE 81 SPAIN: BLOOD GROUPING REAGENTS MARKET, BY PRODUCT, 2022-2030 (USD MILLION)
      83. TABLE 82 SPAIN: BLOOD GROUPING REAGENTS MARKET FOR INSTRUMENTS, BY PRODUCT, 2022-2030 (USD MILLION)
      84. TABLE 83 SPAIN: BLOOD GROUPING REAGENTS MARKET, BY TECHNIQUE, 2022-2030 (USD MILLION)
      85. TABLE 84 SPAIN: BLOOD GROUPING REAGENTS MARKET FOR SEROLOGY, BY TECHNIQUE, 2022-2030 (USD MILLION)
      86. TABLE 85 SPAIN: BLOOD GROUPING REAGENTS MARKET, BY TEST TYPE, 2022-2030 (USD MILLION)
      87. TABLE 86 SPAIN: BLOOD GROUPING REAGENTS MARKET, BY END USER, 2022-2030 (USD MILLION)
      88. TABLE 87 ITALY: BLOOD GROUPING REAGENTS MARKET, BY PRODUCT, 2022-2030 (USD MILLION)
      89. TABLE 88 ITALY: BLOOD GROUPING REAGENTS MARKET FOR INSTRUMENTS, BY PRODUCT, 2022-2030 (USD MILLION)
      90. TABLE 89 ITALY: BLOOD GROUPING REAGENTS MARKET, BY TECHNIQUE, 2022-2030 (USD MILLION)
      91. TABLE 90 ITALY: BLOOD GROUPING REAGENTS MARKET FOR SEROLOGY, BY TECHNIQUE, 2022-2030 (USD MILLION)
      92. TABLE 91 ITALY: BLOOD GROUPING REAGENTS MARKET, BY TEST TYPE, 2022-2030 (USD MILLION)
      93. TABLE 92 ITALY: BLOOD GROUPING REAGENTS MARKET, BY END USER, 2022-2030 (USD MILLION)
      94. TABLE 93 REST OF EUROPE: BLOOD GROUPING REAGENTS MARKET, BY PRODUCT, 2022-2030 (USD MILLION)
      95. TABLE 94 REST OF EUROPE: BLOOD GROUPING REAGENTS MARKET FOR INSTRUMENTS, BY PRODUCT, 2022-2030 (USD MILLION)
      96. TABLE 95 REST OF EUROPE: BLOOD GROUPING REAGENTS MARKET, BY TECHNIQUE, 2022-2030 (USD MILLION)
      97. TABLE 96 REST OF EUROPE: BLOOD GROUPING REAGENTS MARKET FOR SEROLOGY, BY TECHNIQUE, 2022-2030 (USD MILLION)
      98. TABLE 97 REST OF EUROPE: BLOOD GROUPING REAGENTS MARKET, BY TEST TYPE, 2022-2030 (USD MILLION)
      99. TABLE 98 REST OF EUROPE: BLOOD GROUPING REAGENTS MARKET, BY END USER, 2022-2030 (USD MILLION)
      100. TABLE 99 ASIA PACIFIC: BLOOD GROUPING REAGENTS MARKET, BY COUNTRY, 2022–2030 (USD MILLION)
      101. TABLE 100 ASIA PACIFIC: BLOOD GROUPING REAGENTS MARKET, BY PRODUCT, 2022-2030 (USD MILLION)
      102. TABLE 101 ASIA PACIFIC: BLOOD GROUPING REAGENTS MARKET FOR INSTRUMENTS, BY PRODUCT, 2022-2030 (USD MILLION)
      103. TABLE 102 ASIA PACIFIC: BLOOD GROUPING REAGENTS MARKET, BY TECHNIQUE, 2022-2030 (USD MILLION)
      104. TABLE 103 ASIA PACIFIC: BLOOD GROUPING REAGENTS MARKET FOR SEROLOGY, BY TECHNIQUE, 2022-2030 (USD MILLION)
      105. TABLE 104 ASIA PACIFIC: BLOOD GROUPING REAGENTS MARKET, BY TEST TYPE, 2022-2030 (USD MILLION)
      106. TABLE 105 ASIA PACIFIC: BLOOD GROUPING REAGENTS MARKET, BY END USER, 2022-2030 (USD MILLION)
      107. TABLE 106 CHINA: BLOOD GROUPING REAGENTS MARKET, BY PRODUCT, 2022-2030 (USD MILLION)
      108. TABLE 107 CHINA: BLOOD GROUPING REAGENTS MARKET FOR INSTRUMENTS, BY PRODUCT, 2022-2030 (USD MILLION)
      109. TABLE 108 CHINA: BLOOD GROUPING REAGENTS MARKET, BY TECHNIQUE, 2022-2030 (USD MILLION)
      110. TABLE 109 CHINA: BLOOD GROUPING REAGENTS MARKET FOR SEROLOGY, BY TECHNIQUE, 2022-2030 (USD MILLION)
      111. TABLE 110 CHINA: BLOOD GROUPING REAGENTS MARKET, BY TEST TYPE, 2022-2030 (USD MILLION)
      112. TABLE 111 CHINA: BLOOD GROUPING REAGENTS MARKET, BY END USER, 2022-2030 (USD MILLION)
      113. TABLE 112 JAPAN: BLOOD GROUPING REAGENTS MARKET, BY PRODUCT, 2022-2030 (USD MILLION)
      114. TABLE 113 JAPAN: BLOOD GROUPING REAGENTS MARKET FOR INSTRUMENTS, BY PRODUCT, 2022-2030 (USD MILLION)
      115. TABLE 114 JAPAN: BLOOD GROUPING REAGENTS MARKET, BY TECHNIQUE, 2022-2030 (USD MILLION)
      116. TABLE 115 JAPAN: BLOOD GROUPING REAGENTS MARKET FOR SEROLOGY, BY TECHNIQUE, 2022-2030 (USD MILLION)
      117. TABLE 116 JAPAN: BLOOD GROUPING REAGENTS MARKET, BY TEST TYPE, 2022-2030 (USD MILLION)
      118. TABLE 117 JAPAN: BLOOD GROUPING REAGENTS MARKET, BY END USER, 2022-2030 (USD MILLION)
      119. TABLE 118 INDIA: BLOOD GROUPING REAGENTS MARKET, BY PRODUCT, 2022-2030 (USD MILLION)
      120. TABLE 119 INDIA: BLOOD GROUPING REAGENTS MARKET FOR INSTRUMENTS, BY PRODUCT, 2022-2030 (USD MILLION)
      121. TABLE 120 INDIA: BLOOD GROUPING REAGENTS MARKET, BY TECHNIQUE, 2022-2030 (USD MILLION)
      122. TABLE 121 INDIA: BLOOD GROUPING REAGENTS MARKET FOR SEROLOGY, BY TECHNIQUE, 2022-2030 (USD MILLION)
      123. TABLE 122 INDIA: BLOOD GROUPING REAGENTS MARKET, BY TEST TYPE, 2022-2030 (USD MILLION)
      124. TABLE 123 INDIA: BLOOD GROUPING REAGENTS MARKET, BY END USER, 2022-2030 (USD MILLION)
      125. TABLE 124 SOUTH KOREA: BLOOD GROUPING REAGENTS MARKET, BY PRODUCT, 2022-2030 (USD MILLION)
      126. TABLE 125 SOUTH KOREA: BLOOD GROUPING REAGENTS MARKET FOR INSTRUMENTS, BY PRODUCT, 2022-2030 (USD MILLION)
      127. TABLE 126 SOUTH KOREA: BLOOD GROUPING REAGENTS MARKET, BY TECHNIQUE, 2022-2030 (USD MILLION)
      128. TABLE 127 SOUTH KOREA: BLOOD GROUPING REAGENTS MARKET FOR SEROLOGY, BY TECHNIQUE, 2022-2030 (USD MILLION)
      129. TABLE 128 SOUTH KOREA: BLOOD GROUPING REAGENTS MARKET, BY TEST TYPE, 2022-2030 (USD MILLION)
      130. TABLE 129 SOUTH KOREA: BLOOD GROUPING REAGENTS MARKET, BY END USER, 2022-2030 (USD MILLION)
      131. TABLE 130 AUSTRALIA: BLOOD GROUPING REAGENTS MARKET, BY PRODUCT, 2022-2030 (USD MILLION)
      132. TABLE 131 AUSTRALIA: BLOOD GROUPING REAGENTS MARKET FOR INSTRUMENTS, BY PRODUCT, 2022-2030 (USD MILLION)
      133. TABLE 132 AUSTRALIA: BLOOD GROUPING REAGENTS MARKET, BY TECHNIQUE, 2022-2030 (USD MILLION)
      134. TABLE 133 AUSTRALIA: BLOOD GROUPING REAGENTS MARKET FOR SEROLOGY, BY TECHNIQUE, 2022-2030 (USD MILLION)
      135. TABLE 134 AUSTRALIA: BLOOD GROUPING REAGENTS MARKET, BY TEST TYPE, 2022-2030 (USD MILLION)
      136. TABLE 135 AUSTRALIA: BLOOD GROUPING REAGENTS MARKET, BY END USER, 2022-2030 (USD MILLION)
      137. TABLE 136 REST OF ASIA-PACIFIC: BLOOD GROUPING REAGENTS MARKET, BY PRODUCT, 2022-2030 (USD MILLION)
      138. TABLE 137 REST OF ASIA-PACIFIC: BLOOD GROUPING REAGENTS MARKET FOR INSTRUMENTS, BY PRODUCT, 2022-2030 (USD MILLION)
      139. TABLE 138 REST OF ASIA-PACIFIC: BLOOD GROUPING REAGENTS MARKET, BY TECHNIQUE, 2022-2030 (USD MILLION)
      140. TABLE 139 REST OF ASIA-PACIFIC: BLOOD GROUPING REAGENTS MARKET FOR SEROLOGY, BY TECHNIQUE, 2022-2030 (USD MILLION)
      141. TABLE 140 REST OF ASIA-PACIFIC: BLOOD GROUPING REAGENTS MARKET, BY TEST TYPE, 2022-2030 (USD MILLION)
      142. TABLE 141 REST OF ASIA-PACIFIC: BLOOD GROUPING REAGENTS MARKET, BY END USER, 2022-2030 (USD MILLION)
      143. TABLE 142 REST OF THE WORLD: BLOOD GROUPING REAGENTS MARKET, BY REGION, 2022–2030 (USD MILLION)
      144. TABLE 143 REST OF THE WORLD: BLOOD GROUPING REAGENTS MARKET, BY PRODUCT, 2022-2030 (USD MILLION)
      145. TABLE 144 REST OF THE WORLD: BLOOD GROUPING REAGENTS MARKET FOR INSTRUMENTS, BY PRODUCT, 2022-2030 (USD MILLION)
      146. TABLE 145 REST OF THE WORLD: BLOOD GROUPING REAGENTS MARKET, BY TECHNIQUE, 2022-2030 (USD MILLION)
      147. TABLE 146 REST OF THE WORLD: BLOOD GROUPING REAGENTS MARKET FOR SEROLOGY, BY TECHNIQUE, 2022-2030 (USD MILLION)
      148. TABLE 147 REST OF THE WORLD: BLOOD GROUPING REAGENTS MARKET, BY TEST TYPE, 2022-2030 (USD MILLION)
      149. TABLE 148 REST OF THE WORLD: BLOOD GROUPING REAGENTS MARKET, BY END USER, 2022-2030 (USD MILLION)
      150. TABLE 149 MIDDLE EAST: BLOOD GROUPING REAGENTS MARKET, BY PRODUCT, 2022-2030 (USD MILLION)
      151. TABLE 150 MIDDLE EAST: BLOOD GROUPING REAGENTS MARKET FOR INSTRUMENTS, BY PRODUCT, 2022-2030 (USD MILLION)
      152. TABLE 151 MIDDLE EAST: BLOOD GROUPING REAGENTS MARKET, BY TECHNIQUE, 2022-2030 (USD MILLION)
      153. TABLE 152 MIDDLE EAST: BLOOD GROUPING REAGENTS MARKET FOR SEROLOGY, BY TECHNIQUE, 2022-2030 (USD MILLION)
      154. TABLE 153 MIDDLE EAST: BLOOD GROUPING REAGENTS MARKET, BY TEST TYPE, 2022-2030 (USD MILLION)
      155. TABLE 154 MIDDLE EAST: BLOOD GROUPING REAGENTS MARKET, BY END USER, 2022-2030 (USD MILLION)
      156. TABLE 155 AFRICA: BLOOD GROUPING REAGENTS MARKET, BY PRODUCT, 2022-2030 (USD MILLION)
      157. TABLE 156 AFRICA: BLOOD GROUPING REAGENTS MARKET FOR INSTRUMENTS, BY PRODUCT, 2022-2030 (USD MILLION)
      158. TABLE 157 AFRICA: BLOOD GROUPING REAGENTS MARKET, BY TECHNIQUE, 2022-2030 (USD MILLION)
      159. TABLE 158 AFRICA: BLOOD GROUPING REAGENTS MARKET FOR SEROLOGY, BY TECHNIQUE, 2022-2030 (USD MILLION)
      160. TABLE 159 AFRICA: BLOOD GROUPING REAGENTS MARKET, BY TEST TYPE, 2022-2030 (USD MILLION)
      161. TABLE 160 AFRICA: BLOOD GROUPING REAGENTS MARKET, BY END USER, 2022-2030 (USD MILLION)
      162. TABLE 161 LATIN AMERICA: BLOOD GROUPING REAGENTS MARKET, BY PRODUCT, 2022-2030 (USD MILLION)
      163. TABLE 162 LATIN AMERICA: BLOOD GROUPING REAGENTS MARKET FOR INSTRUMENTS, BY PRODUCT, 2022-2030 (USD MILLION)
      164. TABLE 163 LATIN AMERICA: BLOOD GROUPING REAGENTS MARKET, BY TECHNIQUE, 2022-2030 (USD MILLION)
      165. TABLE 164 LATIN AMERICA: BLOOD GROUPING REAGENTS MARKET FOR SEROLOGY, BY TECHNIQUE, 2022-2030 (USD MILLION)
      166. TABLE 165 LATIN AMERICA: BLOOD GROUPING REAGENTS MARKET, BY TEST TYPE, 2022-2030 (USD MILLION)
      167. TABLE 166 LATIN AMERICA: BLOOD GROUPING REAGENTS MARKET, BY END USER, 2022-2030 (USD MILLION)
      168. TABLE 167 MAJOR PLAYERS IN THE GLOBAL BLOOD GROUPING REAGENTS MARKET
      169. TABLE 168 THE MOST ACTIVE PLAYERS IN THE GLOBAL BLOOD GROUPING REAGENTS MARKET
      170. TABLE 169 NEW PRODUCT DEVELOPMENTS/LAUNCHES
      171. TABLE 170 COLLABORATIONS/EXPANSIONS/PARTNERSHIPS/INVESTMENTS
      172. TABLE 171 MERCK KGAA: PRODUCTS OFFERED
      173. TABLE 172 MERCK KGAA: KEY DEVELOPMENTS
      174. TABLE 173 BIO-RAD LABORATORIES, INC.: PRODUCTS OFFERED
      175. TABLE 174 NOVACYT GROUP: PRODUCTS/SERVICES OFFERED
      176. TABLE 175 BECKMAN COULTER, INC.: PRODUCTS OFFERED
      177. TABLE 176 BECKMAN COULTER, INC.: KEY DEVELOPMENTS
      178. TABLE 177 HAEMOKINESIS PTY LTD: PRODUCTS OFFERED
      179. TABLE 178 MTC MED. PRODUKTE GMBH: PRODUCTS/TECHNOLOGIES OFFERED
      180. TABLE 179 DAY MEDICAL SA: PRODUCTS/TECHNOLOGIES OFFERED
      181. TABLE 180 RAPID LABS LTD: PRODUCTS OFFERED
      182. TABLE 181 ORTHO CLINICAL DIAGNOSTICS: PRODUCTS OFFERED
      183. TABLE 182 DIAGAST SAS: PRODUCTS/SERVICES OFFERED
      184. TABLE 183 GRIFOLS SA: PRODUCTS/SERVICES OFFERED
      185. TABLE 184 IMMUCOR, INC.: PRODUCTS/SERVICES OFFERED
      186. TABLE 185 QUOTIENT LTD: PRODUCTS/SERVICES OFFERED
      187. TABLE 186 QUOTIENT LTD: KEY DEVELOPMENTS
      188. TABLE 187 YUVRAJ BIOBIZ INCUBATOR INDIA PVT LTD: PRODUCTS/SERVICES OFFERED
      189. TABLE 188 TULIP DIAGNOSTICS: PRODUCTS/SERVICES OFFERED
      190. TABLE 189 AIKANG: PRODUCTS/SERVICES OFFERED
      191. TABLE 190 INTEC: PRODUCTS OFFERED   LIST OF FIGURES
      192. FIGURE 1 MARKET SYNOPSIS
      193. FIGURE 2 MARKET STRUCTURE: GLOBAL BLOOD GROUPING REAGENTS MARKET
      194. FIGURE 3 BOTTOM-UP AND TOP-DOWN APPROACHES
      195. FIGURE 4 MARKET DYNAMICS: GLOBAL BLOOD GROUPING REAGENTS MARKET
      196. FIGURE 5 DRIVERS: IMPACT ANALYSIS
      197. FIGURE 6 RESTRAINT: IMPACT ANALYSIS
      198. FIGURE 7 VALUE CHAIN: GLOBAL BLOOD GROUPING REAGENTS MARKET
      199. FIGURE 8 Porter's Five Forces Analysis: GLOBAL BLOOD GROUPING REAGENTS MARKET
      200. FIGURE 9 GLOBAL BLOOD GROUPING REAGENTS MARKET, BY PRODUCT, 2020 & 2030 (USD MILLION)
      201. FIGURE 10 GLOBAL: BLOOD GROUPING REAGENTS MARKET, BY TECHNIQUE, 2020 & 2030 (USD MILLION)
      202. FIGURE 11 GLOBAL: BLOOD GROUPING REAGENTS MARKET, BY TEST TYPE, 2020 & 2030 (USD MILLION)
      203. FIGURE 12 GLOBAL: BLOOD GROUPING REAGENTS MARKET, BY END USER, 2020 & 2030 (USD MILLION)
      204. FIGURE 13 GLOBAL: BLOOD GROUPING REAGENTS MARKET, BY REGION 2020 & 2030 (USD MILLION)
      205. FIGURE 14 NORTH AMERICA: BLOOD GROUPING REAGENTS MARKET SHARE (%), BY COUNTRY 2020 (%)
      206. FIGURE 15 EUROPE: BLOOD GROUPING REAGENTS MARKET SHARE (%), BY COUNTRY, 2020
      207. FIGURE 16 ASIA PACIFIC: BLOOD GROUPING REAGENTS MARKET SHARE (%), BY COUNTRY, 2020
      208. FIGURE 17 REST OF THE WORLD: BLOOD GROUPING REAGENTS MARKET SHARE (%), BY REGION, 2020
      209. FIGURE 18 THE MAJOR STRATEGY ADOPTED BY KEY PLAYERS IN THE GLOBAL BLOOD GROUPING REAGENTS MARKET
      210. FIGURE 19 BENCHMARKING OF MAJOR COMPETITORS
      211. FIGURE 20 REVENUE OF MAJOR PLAYERS, 2020
      212. FIGURE 21 MAJOR PLAYERS R&D EXPENDITURE 2020
      213. FIGURE 22 MERCK KGAA: FINANCIAL OVERVIEW SNAPSHOT
      214. FIGURE 23 MERCK KGAA: SWOT ANALYSIS
      215. FIGURE 24 BIO-RAD LABORATORIES, INC.: FINANCIAL OVERVIEW SNAPSHOT
      216. FIGURE 25 BIO-RAD LABORATORIES, INC.: SWOT ANALYSIS
      217. FIGURE 26 NOVACYT GROUP: FINANCIAL OVERVIEW SNAPSHOT
      218. FIGURE 27 ORTHO CLINICAL DIAGNOSTICS: FINANCIAL OVERVIEW SNAPSHOT
      219. FIGURE 28 ORTHO CLINICAL DIAGNOSTICS: SWOT ANALYSIS
      220. FIGURE 29 GRIFOLS SA: FINANCIAL OVERVIEW SNAPSHOT
      221. FIGURE 30 GRIFOLS SA: SWOT ANALYSIS
      222. FIGURE 31 IMMUCOR, INC.: SWOT ANALYSIS
      223. FIGURE 32 QUOTIENT LTD: FINANCIAL OVERVIEW SNAPSHOT
      224. FIGURE 33 QUOTIENT LTD: SWOT ANALYSIS

    Blood Grouping Reagents Market Segmentation

    Market Segmentation Overview

    • Detailed segmentation data will be available in the full report
    • Comprehensive analysis by multiple parameters
    • Regional and country-level breakdowns
    • Market size forecasts by segment
    Infographic

    Free Sample Request

    Kindly complete the form below to receive a free sample of this Report

    Get Free Sample

    Customer Strories

    “I am very pleased with how market segments have been defined in a relevant way for my purposes (such as "Portable Freezers & refrigerators" and "last-mile"). In general the report is well structured. Thanks very much for your efforts.”

    Victoria Milne

    Founder
    Case Study
    Chemicals and Materials