Building Information Modelling Market (2026 - 2035)

Building Information Modelling Market Size, Share and Research Report By Component (Solutions and Services), By Testing Type (Functional and Non-Functional), By Deployment Mode (On-Premises and Cloud), By Organization Size (Large Enterprises and SMEs), By End-User Industry (IT & Telecommunications, BFSI, Healthcare, Retail & E-Commerce, and Others), By Interface (Web, Mobile, and Others), And By Region (North America, Europe, Asia-Pacific, And Rest Of The World) – Industry Forecast Till 2035
ID: MRFR/ICT/1512-CR
110 Pages
Apoorva Priyadarshi, Shubham Munde
Last Updated: August 24, 2026
Building Information Modelling Market
Market Size
Forecast Period2026-2035
CAGR (2026-2035)13.0%
2025 Market SizeUSD 9.24 Billion
2035 Market SizeUSD 31.54 Billion
Key Players
Autodesk
Trimble
Bentley Systems
Nemetschek Group
Dassault Systèmes
Hexagon AB
Opportunities
  • Operations-Phase Monetisation
  • Emerging-Market Leapfrog
  • Regulatory Compliance Automation

Building Information Modelling Market Summary

The Building Information Modelling Market reached USD 9.24 Billion in 2025 and enters the forecast window at USD 10.50 Billion in 2026, climbing to USD 31.54 Billion by 2035 at a 13.0% CAGR. Two catalysts explain the slope. Public procurement rules across the EU, the UK and Singapore now treat structured digital delivery as a condition of tender eligibility rather than a differentiator, and ISO 19650 has given owners a common contractual vocabulary for demanding it [1][3][4].

Legacy 2D CAD estates and file-server document control are being retired in favour of cloud common data environments that carry geometry, cost, schedule and asset metadata in one lineage. Owners are paying for that shift because the waste is measurable — construction labour productivity has trailed the wider economy for decades, and rework routinely consumes a tenth of project value [17][18]. Vendors have responded by folding 4D sequencing, 5D cost and embodied-carbon analytics into base subscriptions.

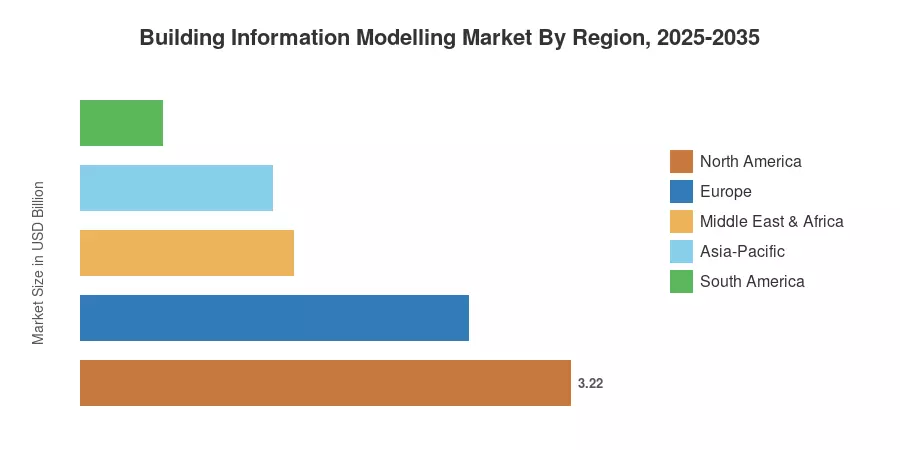
North America still anchors demand with a 34.8% revenue share, built on federal facility standards and a mature architecture-engineering services base [6]. Asia-Pacific compounds fastest at 13.6%, powered by China's MOHURD digital construction push and India's infrastructure pipeline [8][9]. Europe holds second position on the strength of mandate depth rather than raw construction volume. Over the next decade, the Building Information Modelling Market shifts from drawing production toward lifecycle asset intelligence.


Key Report Takeaways

• By Solution and By Deployment Mode


  • Software commands 62.6% of Building Information Modelling Market revenue in 2025, reflecting entrenched authoring-tool licensing
  • Cloud deployment posts the fastest growth in the Building Information Modelling Market at a 16.9% CAGR through 2035
  • Services revenue reached USD 3.46 Billion in 2025 as implementation and training demand widened

• By Application and By Project Lifestyle Stage

  • Commercial buildings hold 38.4% of application revenue, led by office retrofit and mixed-use development
  • Infrastructure applications expand at a 15.4% CAGR, the quickest among all application categories
  • Post-construction lifecycle usage grows at 15.5% CAGR as owners monetise handover data

• By Region

  • North America leads with 34.8% global revenue share in 2025
  • Asia-Pacific advances at a 13.6% CAGR to 2035, the fastest of the five regions
  • Europe generated USD 2.55 Billion in 2025 on the back of mandate-driven adoption


Market Size and Forecast (2021–2035)

Figures below blend vendor subscription disclosures, national construction output statistics, tender-level digital delivery requirements and a bottom-up build of licensed seats by discipline. Historical years are reconciled against audited filings from the four largest publicly traded vendors; forecast years apply seat-growth and price-realisation assumptions separately. The Building Information Modelling Market is expressed in end-user revenue, net of channel margin.
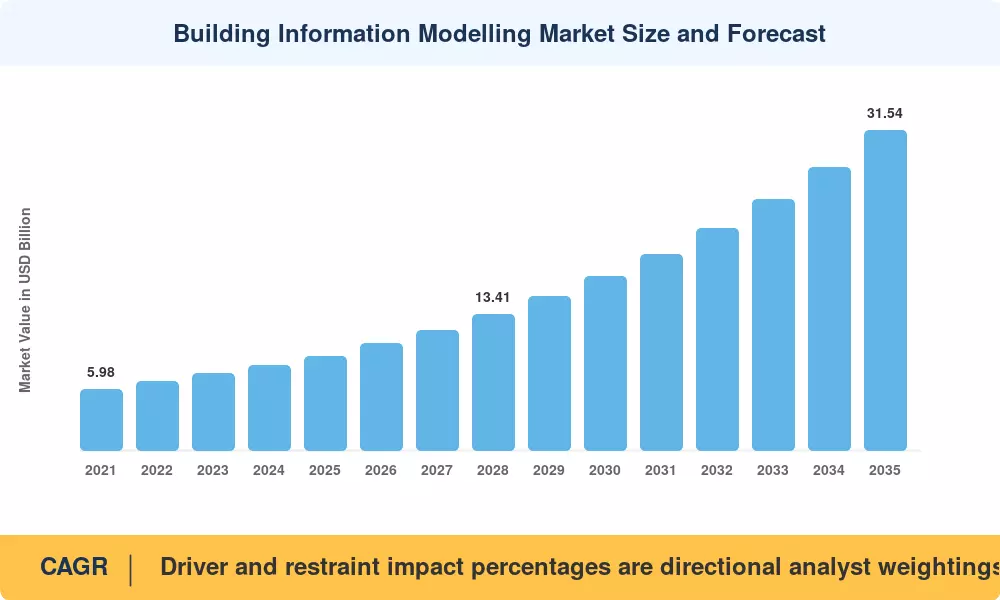
Building Information Modelling Market Size and Forecast
Our Impact
Enabled $4.3B Revenue Impact for Fortune 500 and Leading Multinationals
Partnering with 2000+ Global Organizations Each Year
30K+ Citations by Top-Tier Firms in the Industry

Driver Impact Analysis

Driver ~% Impact on CAGR Geographic Relevance Impact Timeline
Public procurement digital delivery mandates ~24% Europe, UK, Singapore, Gulf Short-term (≤2 yr)
Cloud/SaaS lowering entry cost for SMEs ~19% Global Short-term (≤2 yr)
Infrastructure capital programmes ~17% Asia-Pacific, North America Medium-term (2–4 yr)
Embodied carbon and ESG reporting rules ~13% Europe, North America Medium-term (2–4 yr)
AI-assisted design and automated compliance checking ~11% North America, Europe Long-term (≥4 yr)
Digital twin handover requirements from owners ~9% Gulf, Nordics, Singapore Long-term (≥4 yr)
Skilled-labour scarcity driving prefabrication ~7% Japan, Germany, US Long-term (≥4 yr)


Procurement Mandates Convert Adoption Into Obligation

Mandates changed the buying question from whether to model to how quickly. The UK Government Construction Strategy set a Level 2 requirement across centrally procured projects and reported roughly GBP 840 million in annual construction cost savings attributed to the wider efficiency programme [1]. EU Directive 2014/24/EU Article 22(4) then gave every member state explicit authority to require electronic modelling tools in public works tenders [4]. That single clause pulled thousands of mid-sized European practices into the Building Information Modelling Market within a single procurement cycle, because bid disqualification is a sharper incentive than any productivity case.

Cloud Economics Open the Mid-Market

Perpetual licences priced authoring seats beyond most firms under fifty staff. Subscription and named-user cloud models cut first-year outlay materially, and vendors now report the majority of revenue as recurring — Autodesk's fiscal disclosures show subscription revenue exceeding 90% of total, a structural shift completed only in recent years [11]. Smaller practices consume coordination and issue-tracking as a service rather than as infrastructure, which is why contractors increasingly justify spend through clash detection with BIM coordination workflows that pay back on a single avoided site conflict.

Infrastructure Capital Is the Volume Engine

Global infrastructure investment need runs to roughly USD 94 trillion through 2040, with a sizeable annual gap against current spending [20]. Transport and utility owners are the most demanding buyers because their assets outlive several software generations, so they specify open exchange formats and asset information requirements at tender. Japan's MLIT extended BIM/CIM requirements across national public works, and India's central public works agencies have progressively embedded modelling deliverables into large project specifications [9][8].


Restraints Impact Analysis

Restraint ~% Drag on CAGR Geographic Relevance Impact Timeline
Skills shortage and coordinator scarcity ~26% Global Short-term (≤2 yr)
Interoperability and data loss across formats ~22% Global Medium-term (2–4 yr)
Fragmented small-contractor base ~19% South America, Africa, South Asia Long-term (≥4 yr)
Upfront implementation and process change cost ~18% Emerging economies Short-term (≤2 yr)
Unclear model liability and IP ownership ~15% North America, Europe Medium-term (2–4 yr)


The Coordinator Bottleneck

Software is a better sale than the people who can run it. Research into the industry workforce often shows construction businesses struggling to fill skilled roles. The modeling coordinator post is one of the hardest to fill since it requires understanding of construction sequencing and proficiency with software [18]. In response, firms outsource coordination, increasing services income but constraining the depth of modelling’s embedding into internal processes.


Interoperability Still Leaks Value

The open exchange has been improved but not addressed. Regular IFC round trips between writing systems lose parametric relationships and property sets, requiring manual recreation at the very handover points where owners expect the most value [10]. buildingSMART’s certification program has tightened conformity, but mixed-vendor project teams still budget for rework hours for model federation. And that friction is a recurring reason why owners defer lifetime aspirations.


Building Information Modelling Market Opportunities

Operations-Phase Monetisation

Handover models are the least used asset in the Building Information Modeling Market. Owners that enter structured asset data into computerized maintenance systems will not have to pay for the survey fees that are generally associated with occupancy. Post-construction expansion of 15.5% is where BIM for facility management and operations comes in.


Emerging-Market Leapfrog

Fast-urbanising economies in Southeast Asia, the Gulf and Africa are requesting digital delivery on marquee programs without ever industrializing 2D operations. Vietnam, Indonesia and Saudi Arabia provide greenfield adoption where there is no legacy displacement cost for cloud-native tools [22].


Regulatory Compliance Automation

Automated code checking converts building regulations into machine-readable rulesets. Singapore's regulatory submission gateway proved the model at national scale, and replicating it in larger jurisdictions creates a defensible software category adjacent to authoring [2].

Data Products and Benchmarking Services

Aggregated, anonymised project data — cost per square metre, carbon per element, productivity by trade — is a saleable product. Vendors sitting on multi-year model repositories can monetise benchmarking subscriptions, a business line largely absent from the Building Information Modelling Market today.

Retrofit and Reality Capture Convergence

Europe's renovation wave targets existing stock, where no model exists. Pairing laser scanning and photogrammetry with automated scan-to-model conversion addresses a building population several times larger than annual new-build starts [5][21].


Building Information Modelling Market Future Outlook

Generative and AI-Assisted Design

Automated option generation compresses the concept phase from weeks to days. By the early 2030s, expect AI-assisted layout, code-compliance pre-checking and quantity extraction to be default features rather than premium add-ons, shifting differentiation in the Building Information Modelling Market from geometry engines toward training-data quality and rule libraries [12].

Platform Economics and Consolidation

Vendors are converting from tool suppliers to platform landlords. Once cost, schedule, field capture and design sit on one data layer, switching costs rise sharply, and net revenue retention becomes the governing metric — which is precisely why acquisition activity has concentrated on field and cost-management assets rather than authoring [13][15].

Carbon Accounting Becomes a Model Attribute

Embodied carbon is migrating from spreadsheet to model property. The buildings sector accounts for roughly 30% of global final energy consumption, and reporting regimes increasingly demand element-level material data that only a structured model can supply at scale [21].

Owner-Operated Digital Twins

Facility owners will progressively contract for an operating asset model, not a set of drawings. That reframing extends vendor revenue across a thirty-year asset life and gradually rebalances the Building Information Modelling Market away from design-phase concentration.


Building Information Modelling Market Segmentation

Segmentation in the Building Information Modelling Market follows five commercial dimensions, each with a distinct buying centre and renewal cycle.

By Solution

Segment Metric Primary Demand Driver
Software 62.6% share Authoring and coordination seat licensing
Services 14.5% CAGR Implementation, training, outsourced coordination

Software dominance is a licensing artefact more than a value statement. Services grow faster because every mandate creates a capability gap that consultancies fill before internal teams mature, and that gap widens each time a jurisdiction raises its delivery threshold.

By Deployment Mode

Segment Metric Primary Demand Driver
On-Premises 66.1% share Data residency, large-firm IT policy
Cloud 16.9% CAGR Multi-party collaboration, low entry cost

On-premises still holds the installed base within the Building Information Modelling Market, particularly among defence-adjacent and government engineering practices with residency constraints. Cloud wins every new mid-market decision, because federated coordination across disciplines is impractical on file servers.

By Project Lifecycle Stage

Segment Metric Primary Demand Driver
Pre-Construction 42.2% share Design authoring, coordination, estimation
Construction USD 3.59 Billion (2025) Field execution, sequencing, progress capture
Post-Construction 15.5% CAGR Asset handover, maintenance, retrofit

Pre-construction remains the dominant project lifecycle stage within the Building Information Modelling Market, fueled by intensive design authoring, multi-disciplinary clash coordination, and precise preliminary estimation requirements. Post-construction stands out as the fastest-growing project lifecycle stage, propelled by the transition toward comprehensive asset handover, lifecycle maintenance management, and reality-capture retrofit projects.

By Application

Segment Metric Primary Demand Driver
Commercial Buildings 38.4% share Office retrofit, mixed-use, data centres
Infrastructure 15.4% CAGR Transport and utility capital programmes
Residential Buildings USD 1.97 Billion (2025) Multi-family and modular housing
Industrial Facilities 14.1% CAGR Manufacturing reshoring
Institutional and Others 6.5% share Healthcare and education estates

Commercial buildings lead the Building Information Modelling Market on services density — coordinating mechanical, electrical and plumbing systems in a high-rise creates far more model value than a warehouse shell. Infrastructure compounds faster because owners are permanent, budgets are programme-scale, and asset registers outlive contractors.

By End User

Segment Metric Primary Demand Driver
Architects and Designers 27.5% share Design authoring seats
Contractors 14.6% CAGR Constructability, cost certainty, field control
Engineers 24.8% share Structural and MEP analysis integration
Owners and Facility Managers 13.9% CAGR Lifecycle asset data requirements
Others 6.7% share Surveyors, fabricators, consultants


Architects and designers remain the dominant end-user segment within the Building Information Modelling Market, fueled by continuous demand for core design authoring seats and conceptual modeling workflows. Contractors stand out as the fastest-growing end-user segment, propelled by the urgent industry need for improved constructability, cost certainty, and advanced field control coordination.


Regional Market Share Analysis

Region Metric Primary Investment Themes
North America 34.8% share Federal facility standards, owner-led digital twins
Europe USD 2.55 Billion Mandate depth, renovation wave, carbon reporting
Asia-Pacific 13.6% CAGR Infrastructure pipeline, national digital construction policy
South America 5.8% share Concession-model transport, mining facilities
Middle East & Africa 15.1% CAGR Giga-projects, national building code digitisation
Total USD 9.24 Billion (2025)

Regional distribution in the Building Information Modelling Market reflects mandate maturity more than construction spend. Regions with modest output but strict procurement rules outperform larger markets with voluntary adoption.


North America

Country Metric Key Driver
US 84.1% of regional share GSA facility standards, data centre construction [7]
Canada USD 0.34 Billion Provincial infrastructure renewal
Mexico 14.8% CAGR Nearshoring industrial build-out


Federal practice set the tone for the Building Information Modelling Market here. The US General Services Administration has required modelling on major capital projects for well over a decade, and the National Institute of Building Sciences maintains the standard that most owner specifications reference [7][14]. Data centre and semiconductor fabrication programmes now supply outsized demand because their MEP density makes coordination non-optional.

Europe

Country Metric Key Driver
Germany 21.4% of regional share Federal transport BIM roadmap
UK USD 0.52 Billion Government Construction Strategy legacy [1]
France 13.2% CAGR Public housing digitisation
Italy 11.6% of regional share Codice Appalti threshold schedule
Spain 12.4% CAGR CBIM public tender requirements
Nordic Countries USD 0.29 Billion Early open-standard adoption
Russia 5.1% of regional share State-mandated design documentation
Rest of Europe 12.1% CAGR Cohesion-funded infrastructure


Europe's advantage is contractual clarity. Italy phased mandatory digital delivery down through descending contract-value thresholds, giving vendors a predictable multi-year demand ramp. At the same time, the recast Energy Performance of Buildings Directive attaches renovation and reporting obligations to the existing stock [5].

Asia-Pacific

Country Metric Key Driver
China 38.7% of regional share MOHURD intelligent construction policy [8]
India 16.2% CAGR National infrastructure pipeline, CPWD specifications [9]
Japan USD 0.31 Billion MLIT BIM/CIM public works requirement
South Korea 11.4% of regional share Public procurement service mandate
ASEAN 15.8% CAGR Singapore regulatory gateway precedent [2]
Rest of Asia-Pacific USD 0.18 Billion Resource-sector capital projects


Asia-Pacific carries the fastest trajectory in the Building Information Modelling Market because policy and capital arrived together. Singapore's Building and Construction Authority pioneered electronic regulatory submission and later tied productivity funding to digital delivery, creating a template that ASEAN regulators have partially copied [2].

South America

Country Metric Key Driver
Brazil 61.3% of regional share Estratégia BIM BR federal decree
Argentina 14.9% CAGR Energy infrastructure investment
Rest of South America USD 0.08 Billion Chilean and Peruvian mining facilities


Brazil's federal BIM strategy set staged adoption targets for public works and remains the region's principal demand instrument. Adoption outside government-linked projects stays shallow, since the contractor base is fragmented and price-led [17].

Middle East & Africa

Country Metric Key Driver
Saudi Arabia 34.6% of regional share Vision 2030 giga-project delivery [22]
UAE USD 0.11 Billion Dubai Municipality submission requirements
South Africa 13.7% CAGR Public works asset management reform
Egypt 12.9% CAGR New administrative capital programme
Rest of MEA 5.9% of regional share Donor-funded infrastructure


Gulf giga-projects behave like laboratories. Programme scale justifies bespoke common data environments and full digital twin commissioning, and Saudi authorities have moved to embed modelling requirements within national building code administration [22].


Building Information Modelling Market By Region, 2025-2035

Competitive Benchmarking

Concentration in the Building Information Modelling Market is moderate. Estimated HHI sits near 1,150, with the top five vendors holding roughly 55–60% of revenue and a long tail of regional authoring, estimating and coordination specialists below. Competition is fought on ecosystem breadth rather than modelling accuracy, since core geometry capability has largely commoditised.

Company Est. Revenue Share Range Key Offerings for Building Information Modelling Market Strategic Positioning
Autodesk ~21–25% Revit, Construction Cloud, Forma, Civil 3D Broadest design-to-build ecosystem [11]
Trimble ~10–13% Tekla, Quadri, Connect, field survey hardware Structures and field-to-model integration [13]
Bentley Systems ~8–11% MicroStation, OpenBuildings, iTwin, ProjectWise Infrastructure and digital twin depth [15]
Nemetschek Group ~7–10% Archicad, Allplan, Vectorworks, Solibri, Bluebeam Multi-brand, open-standard advocacy [16]
Dassault Systèmes ~5–7% 3DEXPERIENCE for construction, CATIA Complex geometry and industrialised construction
Hexagon AB ~4–6% Reality capture, HxDR, asset lifecycle tools Scan-to-model and operations data
Procore Technologies ~3–5% Construction management, model viewer, financials Contractor-side system of record [23]
RIB Software ~2–4% iTWO 5D, cost and scheduling integration 5D cost estimation specialisation
Glodon ~2–4% Cost estimation, digital construction suite China domestic leadership [8]
AVEVA ~1–3% Plant and process design, unified engineering Industrial and process facilities
Asite ~1–2% Common data environment, supply chain Owner-side collaboration niche
ACCA Software ~1–2% Edificius, usBIM platform European SME and open-format focus


Recent News & Developments

  • Autodesk (June 2023): Launched Forma, an outcome-based early-stage design environment, signalling a shift away from file-centric authoring toward cloud-native workflows [11]
  • European Union (April 2024): Adopted the recast Energy Performance of Buildings Directive, tightening renovation and building-data obligations across member states and extending the compliance case for structured models [5]


  • Bentley Systems (September 2024): Acquired Cesium, adding open 3D geospatial tiling to its infrastructure digital twin stack [15]


  • Hexagon AB (2025): Announced separation of its asset lifecycle intelligence division, creating a more focused engineering software entity
  • Saudi Arabia (2023–2024): National building code authorities advanced digital submission and modelling requirements in support of Vision 2030 delivery programmes [22]


Building Information Modelling Market Report Scope

Parameter Detail
Market Scope Global software, services and cloud platforms for building information modelling across design, construction and operations
Study Period 2021–2035 (Historical 2021–2024; Base Year 2025; Forecast 2026–2035)
CAGR 13.0% (2026–2035)
Market Size Checkpoints USD 9.24 Billion (2025); USD 10.50 Billion (2026); USD 19.35 Billion (2031); USD 31.54 Billion (2035)
Fastest Growing Segments Cloud deployment (16.9% CAGR); Post-construction lifecycle (15.5% CAGR); Infrastructure application (15.4% CAGR)
Companies Profiled Autodesk, Trimble, Bentley Systems, Nemetschek Group, Dassault Systèmes, Hexagon AB, Procore, RIB Software, Glodon, AVEVA, Asite, ACCA Software
Valuation Currency USD Billion, end-user revenue basis
CAGR Driver Disclaimer Driver and restraint impact percentages are directional analyst weightings and are not additive components of the headline growth rate

FAQs

What procurement clauses should an owner insert to make Building Information Modelling Market deliverables enforceable?
Reference ISO 19650 explicitly, attach Exchange Information Requirements as a contract schedule, and define acceptance criteria for each information delivery milestone. Vague "provide a BIM model" language is unenforceable [3].
How should buyers compare perpetual licences against subscription pricing?
Model total cost over seven years including maintenance, and weight cloud entitlements and named-user flexibility. Subscription usually wins below fifty seats; larger firms with stable headcount sometimes still favour perpetual estates [11].
Who owns the model in a Building Information Modelling Market engagement?
Ownership defaults to the author unless assigned. Most owner-side contracts grant a perpetual licence to use the model for operations while leaving copyright with designers, which avoids professional indemnity disputes [7].
What is a realistic implementation timeline for a mid-sized practice?
Expect nine to eighteen months to reach reliable coordinated output. Software installs in weeks; template libraries, naming conventions and staff competence take the remainder [12].
Does the Building Information Modelling Market require open standards, or are native formats acceptable?
Native formats are fine within a single-vendor team. Cross-discipline projects and public tenders increasingly require IFC deliverables alongside native files, so plan for dual output [10].
Which integration failure most often derails Building Information Modelling Market projects?
Cost-system integration. Estimating platforms rarely map cleanly to model classification codes, so quantity takeoffs need manual reconciliation unless a shared coding structure is agreed at project start [12].
How do insurers view model-based design liability?
Underwriters generally treat models as design documents, not warranties of constructability. Firms should confirm that professional indemnity cover extends to automated clash resolution outputs and disclaim reliance on unverified quantities [7].    
Author
Author
Author Profile
Apoorva Priyadarshi LinkedIn
Research Analyst
With 4+ years of experience in Market Intelligence and Strategic Research, Apoorv specializes in ICT, Semiconductor, and BFSI markets. Combining strong analytical capabilities with a deep understanding of technology-driven industries, he focuses on delivering data-driven insights that support strategic decision-making. With a background in technology and business research, Apoorv has contributed to numerous global market studies, competitive landscape analyses, and opportunity assessments across sectors such as semiconductors, digital banking, cybersecurity, and telecommunications.
Co-Author
Co-Author Profile
Shubham Munde LinkedIn
Team Lead - Research
Shubham brings over 7 years of expertise in Market Intelligence and Strategic Consulting, with a strong focus on the Automotive, Aerospace, and Defense sectors. Backed by a solid foundation in semiconductors, electronics, and software, he has successfully delivered high-impact syndicated and custom research on a global scale. His core strengths include market sizing, forecasting, competitive intelligence, consumer insights, and supply chain mapping. Widely recognized for developing scalable growth strategies, Shubham empowers clients to navigate complex markets and achieve a lasting competitive edge. Trusted by start-ups and Fortune 500 companies alike, he consistently converts challenges into strategic opportunities that drive sustainable growth.

Research Approach

Research Methodology on Building Information Modelling Market

Introduction

The present research aims to analyze the potential of the Building Information Modeling (BIM) market as projected in the report published by Market Research Future, entitled “Building Information Modelling Market ” (MRFR). The BIM market is expected to grow at a substantial rate owing to the increasing adoption of technological advancements in the construction sector. The report focuses on regional and global market growth along with market performance, drivers, and opportunities. The report also highlights various dynamics of the industry such as market outlook, opportunities, and constraints associated with this domain.

The research methodology applied in this report consists of primary research and secondary research. The primary research includes industry talks with BIM experts, developers of BIM technology, and building design software developers, while the secondary research includes examining published papers, books, and magazines, analysis of their contents, industry databases, press releases, and other syndicated data sources. This is supplemented with inputs from key industry players, reference material such as Bloomberg Businessweek, product launches, trade data, and price structure.

Objectives of the Study

The objectives of this study are as follows:

  • To study the current market trends, statistics and market performance of the BIM market
  • To analyze the aspects affecting the market growth, opportunities, and constraints associated with the BIM domain
  • To provide an insight into the regional and global BIM market growth
  • To analyze the market potential, business opportunities and trends for the BIM market
  • To define and forecast the global BIM market based on technology, application, and region

Scope of the Study

This research report covers the following market segments:

  • Technology: Cloud BIM, Mobile BIM, RESTful BIM, Open BIM
  • Application: Infrastructure, Asset, Buildings, Facility Management
  • Region: North America, Europe, Asia-Pacific, Latin America, and Middle East & Africa

Research Methodology

Secondary Research

 Secondary research includes the identification of data sources, the collection of the data, and the analysis of the data gathered. It is used to define the unique characteristics of the BIM market by mapping out the parameters available within the research framework while also developing a broad understanding of past market trends and developments.

The secondary sources include Bloomberg BusinessWeek, Search Engine databases, press releases, articles, and relevant reference materials such as white papers, company reports, industry reports, and news articles. Additionally, these are supplemented with inputs from leading businesses and industry experts related to the BIM market via interviews and surveys.

The collected data is then categorized into its respective segments and then analyzed using various methods such as Porter’s Five Forces Model, SWOT Analysis, and PESTEL analysis to estimate the potential of the BIM market in the future.

Primary Research

Primary research includes data gathered through direct communication and surveys of selected key personnel. It is used to validate the data collected from secondary research and to develop an in-depth understanding of the BIM market.

The primary data is collected through face-to-face interviews with key personnel from various stakeholders in the BIM market. These include BIM developers, suppliers, distributors, traders, vendors, and manufacturers. It is also gathered from a panel of domain experts from other areas such as academia, government and business.

Data Collection

The collected data is then categorized into its respective segments and then analyzed using various methods such as Porter’s Five Forces Model, SWOT Analysis, and PESTEL analysis to estimate the potential of the BIM market in the future. This data is then used to develop the necessary insights into the competitive landscape of the BIM market.

Data Validation

After the data is collected, it is then validated by conducting a series of three-point checks such as accuracy check, errors check, outliers check, trends check, and missing values check. This is done to ensure the accuracy as well as the completeness of the data.

Data Analysis

Once the data is validated, it is then analyzed and processed to develop an understanding of the BIM market landscape and its potential. The collected data is analyzed using various analytical and statistical tools such as Porter’s Five Forces Model, SWOT Analysis, and PESTEL Analysis.

Continuous Feedback

 Continuous feedback from the stakeholders helps in improving the accuracy and approaches used for analyzing the BIM market. This ensures that the insights produced are up-to-date and applicable to the BIM market.

Conclusion

The research methodology applied in this report helps to analyze the potential of the BIM market for the future, along with various dynamics of the industry such as market size, market growth, technology, applications, opportunities, and constraints associated with the domain. The data is collected from both primary and secondary research sources and validated through a series of measures to ensure accuracy, completeness, and correctness. This is further supplemented by continuous feedback from the stakeholders, which helps in improving the accuracy of the analysis and the insights produced.

Download Free Sample

Kindly complete the form below to receive a free sample of this Report

* Please use a valid business email

Download PDF ×

We do not share your information with anyone. However, we may send you emails based on your report interest from time to time. You may contact us at any time to opt-out.
















