Segmentation Quick Reference
| Dimension | Sub-Segments | Dominant Segment | Fastest Growing Segment |
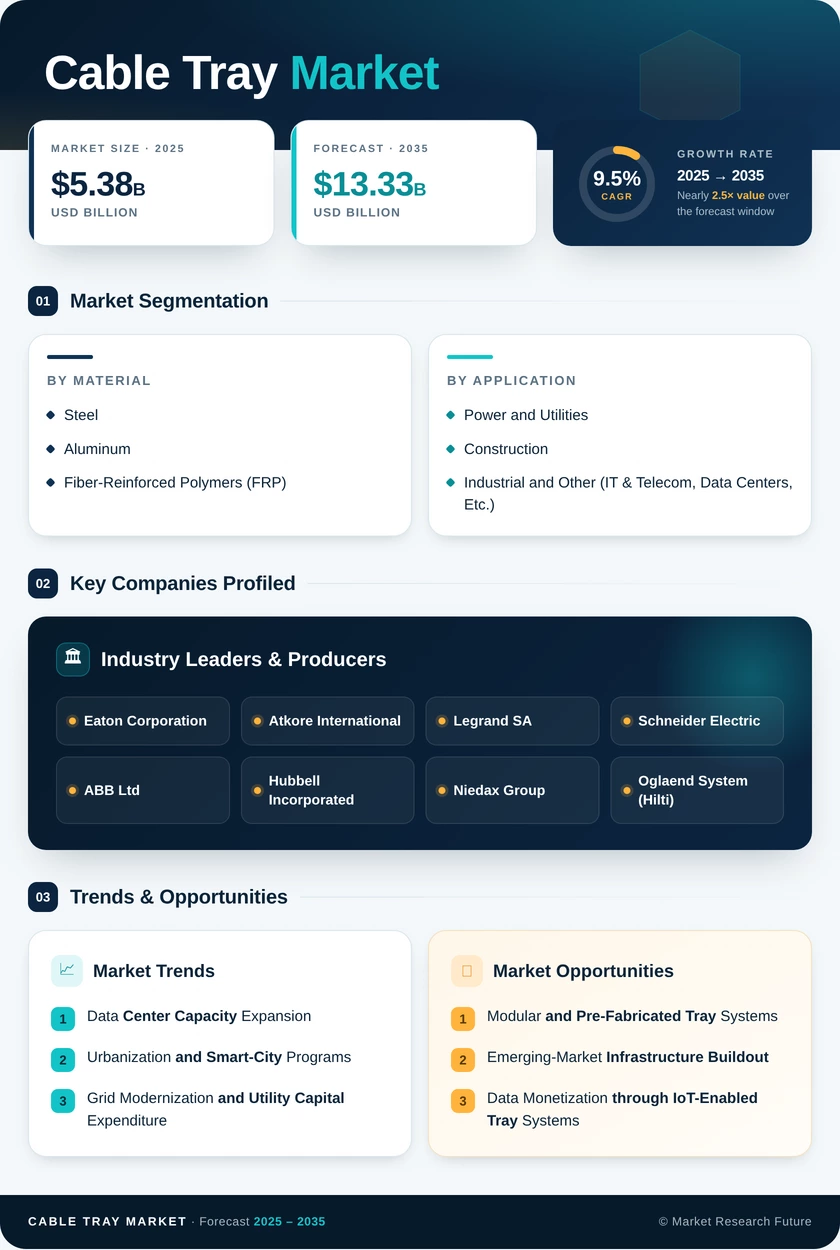
| By Material | Steel, Aluminum, Fiber-Reinforced Polymers (FRP) | Steel | Aluminum |
| By End-User Industry | Power and Utilities; Construction; Industrial and Other (IT & Telecom, Data Centers, Etc.) | Power and Utilities | Industrial and Other |
| By Region | North America, Europe, Asia-Pacific, South America, Middle East & Africa | North America | Asia-Pacific |
Market Segmentation Overview
By Material
| Sub-Segment | Key Trend |
| Steel | Sustained dominance in heavy-industrial and utility-scale installations driven by superior load capacity and established supply chains |
| Aluminum | Rapid adoption in data centers and commercial buildings, supported by weight advantages and improved alloy performance |
| Fiber-Reinforced Polymers (FRP) | Growing specification in corrosive environments such as chemical plants, coastal facilities, and wastewater treatment operations |
Steel continues to anchor the global cable tray market due to its unmatched structural strength and cost-effectiveness at scale, while aluminum's share is expanding fastest as data center and commercial construction customers prioritize lighter, easier-to-install systems that reduce overall project timelines.
By End-User Industry
| Sub-Segment | Key Trend |
| Power and Utilities | Grid modernization programs and renewable energy integration are driving sustained demand for heavy-duty tray systems |
| Construction | Smart-building mandates and high-density commercial developments requiring modular, code-compliant cable management |
| Industrial and Other (IT & Telecom, Data Centers, Etc.) | Hyperscale data center buildout and 5G network densification, creating the fastest growth trajectory |
Power and Utilities remains the largest buyer of cable tray systems globally, though the Industrial and Other segment — led by data centers and telecom — is closing the gap as digital infrastructure investment outpaces traditional construction spending in key markets.
By Region
| Sub-Segment | Key Trend |
| North America | Dominant revenue share supported by data center expansion, IIJA grid investment, and NEC code enforcement |
| Europe | Industrial retrofitting and CPR fire-safety compliance are driving steady replacement demand |
| Asia-Pacific | Fastest growth fueled by smart-city programs, 5G rollout, and manufacturing plant construction |
| South America | Mining and petroleum infrastructure are sustaining moderate growth |
| Middle East & Africa | Mega-project construction and oil & gas sector diversification are creating high-growth pockets |
North America leads the global cable tray market revenue on the strength of its data center pipeline and utility modernization programs, while Asia-Pacific's rapid urbanization and digital infrastructure expansion position it as the primary growth engine through 2035.