Request Free Sample ×

Kindly complete the form below to receive a free sample of this Report

* Please use a valid business email

Leading companies partner with us for data-driven Insights

clients tt-cursor
Hero Background

Canned Seafood Market

ID: MRFR/FnB/5240-HCR
128 Pages
Pradeep Nandi
Last Updated: May 28, 2026
Canned Seafood Market Size, Share, Industry Trend & Analysis Research Report: By Product Type (Canned Tuna, Canned Salmon, Canned Sardines, Canned Mackerel, Canned Shrimp & Others), By Distribution Channel (Supermarkets/Hypermarkets, Convenience Stores, E-Commerce, Foodservice/Institutional), By Packaging Type (Metal Cans, Pouches/Flexible Packaging, Glass Jars) - Forecast to 2035
Download PDF ×

We do not share your information with anyone. However, we may send you emails based on your report interest from time to time. You may contact us at any time to opt-out.


Canned Seafood Market Summary

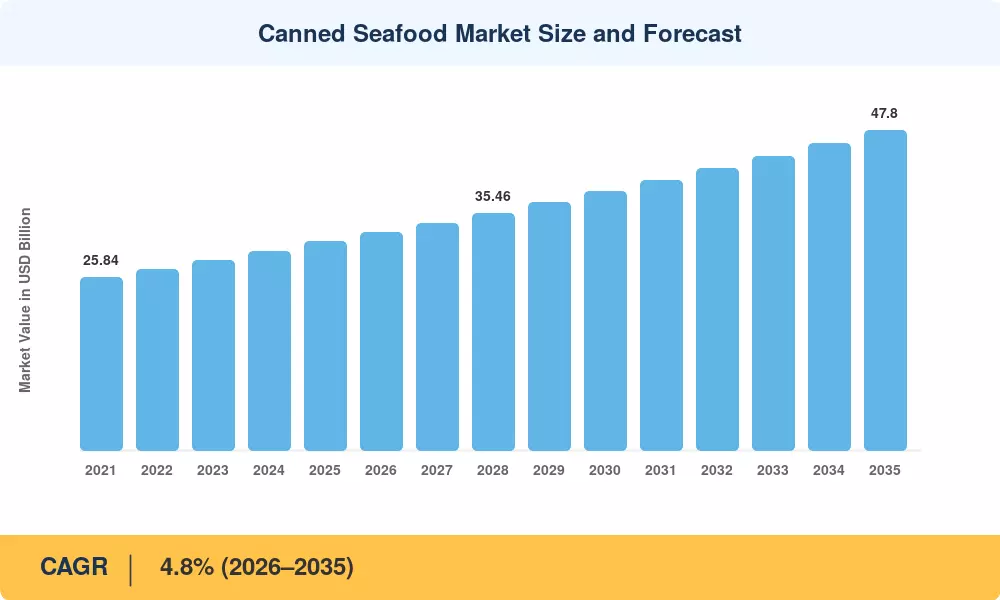
The global Canned Seafood Market stood at an estimated USD 31.2 billion in 2025 and is projected to reach USD 32.7 billion in 2026 before climbing to USD 47.8 billion by 2035, registering a CAGR of 4.8% across the forecast window of 2026–2035. Two catalysts anchor this trajectory: surging consumer demand for shelf-stable, high-protein convenience foods and a tightening regulatory environment around sustainable seafood canning practices that is reshaping procurement across the value chain. Government-backed traceability mandates — notably the EU's updated IUU Regulation and the U.S. SIMP program — have pushed processors to invest over USD 1.4 billion collectively in supply-chain digitization since 2022 [2].

The production landscape is undergoing a quiet but meaningful transformation. Legacy thermal-retort lines are giving way to high-pressure processing (HPP) and advanced nitrogen-flush packaging that extend shelf life while preserving omega-3 content and texture. Premium canned seafood brands have capitalized on this shift, commanding price points 40–60% above commodity tins by emphasizing single-origin sourcing and artisan preparation [3]. Retail data from IRI/Circana shows the premium tier grew at nearly twice the rate of the overall canned seafood category in 2024, validating the "tinned fish renaissance" trending across social media and specialty retail.

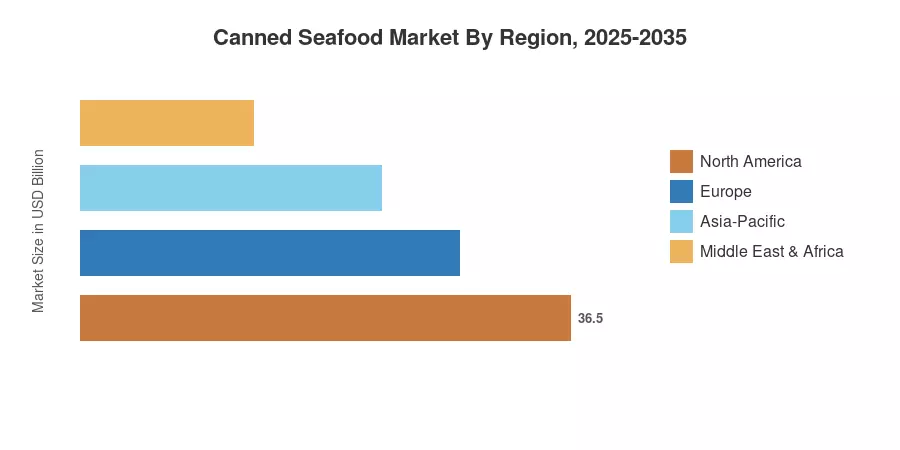
North America remains the dominant region, holding roughly 32% of global revenue, driven by strong private-label penetration and a mature retail infrastructure for ready-to-eat seafood convenience products. Asia-Pacific is the fastest-growing region, forecast to expand at a 6.1% CAGR through 2035, propelled by rising urbanization in Southeast Asia and growing cold-chain gaps that favor ambient protein. Europe accounts for approximately 27% of the Canned Seafood Market, anchored by Iberian and Scandinavian canning traditions and robust demand for canned sardines mackerel products The decade ahead will be shaped by how well processors balance cost efficiency with the sustainability credentials consumers increasingly demand.


Key Report Takeaways

• By Product Type

  • Canned tuna holds the largest share at approximately 38% of the Canned Seafood Market, supported by its versatility across foodservice and retail channels
  • Canned salmon is the fastest-growing product segment with a projected CAGR of 5.9%, driven by health-conscious consumers seeking omega-3-rich ready-to-eat seafood convenience options
  • Canned sardines and mackerel collectively represent an estimated USD 7.4 billion in 2025 revenue, fueled by the canned sardines mackerel trend sweeping European and North American specialty retailers

• By Distribution Channel

  • Supermarkets and hypermarkets account for roughly 52% of the Canned Seafood Market by value, reflecting the dominance of brick-and-mortar retail for shelf-stable proteins
  • E-commerce is growing at a 7.3% CAGR, the fastest among all distribution channels, as DTC premium canned seafood brand offerings gain traction

• By Geography

  • North America commands roughly USD 10.0 billion in 2025 revenue within the Canned Seafood Market
  • Asia-Pacific is forecast to register a 6.1% CAGR, the highest regional growth rate, underpinned by expanding middle-class protein consumption in Indonesia, Vietnam, and the Philippines
  • Europe holds the second-largest share at approximately 27%, with Spain, Portugal, and Norway leading in sustainable seafood canning capacity


Canned Seafood Market Size and Forecast (2021–2035)

Market size estimates draw on a triangulated methodology combining top-down trade-flow analysis (FAO FishStatJ, UN Comtrade), bottom-up processor revenue aggregation (company filings, trade association data), and demand-side validation through retail scanner datasets (NielsenIQ, Circana). All figures are expressed in constant 2025 USD.

Market Size Chart
Our Impact
Enabled $4.3B Revenue Impact for Fortune 500 and Leading Multinationals
Partnering with 2000+ Global Organizations Each Year
30K+ Citations by Top-Tier Firms in the Industry
 

Driver Impact Analysis

Driver ~% Impact on CAGR Geographic Relevance Impact Timeline
Rising demand for shelf-stable protein +1.4% Global Short-term (≤2 yr)
Premium and artisan canned seafood trend +0.9% North America, Europe Medium-term (2–4 yr)
Sustainable seafood canning regulations +0.7% EU, North America Long-term (≥4 yr)
E-commerce and DTC channel expansion +0.6% Global Medium-term (2–4 yr)
Urbanization in emerging Asia-Pacific +0.8% Asia-Pacific Long-term (≥4 yr)
Health and omega-3 awareness campaigns +0.5% Global Short-term (≤2 yr)
Private-label investment by major retailers +0.4% North America, Europe Medium-term (2–4 yr)


Shelf-Stable Protein Demand

Euromonitor’s packaged-food tracker [4] said consumer spend on ambient-temperature proteins will increase 11% in real terms between 2021 and 2024. Two big forces collide at the crossroads of the Canned Seafood Market: the post-pandemic resilience of pantries and the global move to a protein-first diet that has transformed grocery store aisles. Ready-to-eat seafood convenience items — in particular single-serve pouches and ring-pull cans — have lessened the friction between purchase and consumption, turning canned fish into a lunchbox staple instead of a hurricane-prep afterthought.


Premium and Artisan Tinned Fish Movement

What began as a niche trend on food-culture social media accounts has matured into a structural channel shift. Specialty retailers like Tinned Fish Market (NYC) and conservas bars in Lisbon now stock over 200 SKUs from premium canned seafood brands commanding USD 8–25 per tin [3]. The canned sardines mackerel trend specifically has lifted average unit prices in the category by 18% since 2022. Spanish and Portuguese producers have led the premiumization wave, investing roughly EUR 320 million in facility upgrades to meet export demand [12].

Sustainable Sourcing and Regulatory Pressure

The EU's revised Common Fisheries Policy and the U.S. Seafood Import Monitoring Program (SIMP) now require chain-of-custody documentation for 13 priority species, including tuna, sardines, and mackerel [2]. Compliance costs run USD 0.03–0.08 per can, but processors that achieve MSC or ASC certification report a 12–15% retail price premium. Sustainable seafood canning is no longer a marketing differentiator — it is a market-access requirement across major import destinations. This regulatory tightening rewards vertically integrated players and penalizes opaque supply chains.

E-Commerce and Direct-to-Consumer Channels

In 2024 shelf-stable fish online grocery penetrated 9.4% of category sales, up from 5.1% in 2020. Digital shops have worked well for luxury canned seafood brands like Scout, Fishwife and José Gourmet, all of whom have had success with subscription-box strategies. Logistics costs for ambient products are far lower than for refrigerated or frozen products, providing canned fish a structural advantage in e-commerce unit economics, which will be positive for the Canned Seafood Market.


Restraints Impact Analysis

Restraint ~% Impact on CAGR Geographic Relevance Impact Timeline
Raw material price volatility (skipjack, sardine) –0.6% Global Short-term (≤2 yr)
Mercury and contaminant perception barriers –0.4% North America, Asia Long-term (≥4 yr)
BPA-lining and packaging safety concerns –0.3% Europe, North America Medium-term (2–4 yr)
Competition from frozen and fresh seafood –0.3% Developed markets Long-term (≥4 yr)
Overcapacity in commodity tuna processing –0.2% Southeast Asia Medium-term (2–4 yr)


Raw Material Price Volatility

Skipjack tuna, the workhorse species for the Canned Seafood Market, has Bangkok benchmark prices of USD 1,100/MT to USD 2,300/MT throughout 2022-2024 [13]. That unpredictability puts pressure on processor margins, especially for brands tied to fixed retail price points with grocery chains. The variation in catch due to El Niño in the Western and Central Pacific will likely continue until at least 2027, making supply uncertain and procurement prices high for ready-to-eat seafood convenience producers, according to FAO’s GLOBEFISH Highlights report.


Mercury and Contaminant Perceptions

While the FDA states in guidelines that canned light tuna contains mercury substantially below the threshold, consumer surveys indicate that 22–28% of shoppers identify worries about mercury as a reason to cut down on canned fish purchases [14]. The image is most distorted in canned tuna salmon category among pregnant women and parents of young children – a demographic already oriented to high-protein convenience foods. Education attempts by the National Fisheries Institute and Global Tuna Alliance have not been enough, yet the perception gap remains.


BPA and Packaging Safety Scrutiny

In 2023, the European Food Safety Authority (EFSA) reduced the acceptable daily intake for BPA by a factor of 20,000, adding more impetus to reformulation throughout the canned-food industry [15]. Switching to BPA-NI (non-intent) linings adds USD 0.02-0.05 per unit. This expense is considerable and hard to pass on to price sensitive customers of commodity-grade canned fish, where margins are already tight.


Opportunities

Premiumization and Provenance-Driven Branding

The "conservas" movement has demonstrated that canned seafood can occupy the same shelf as artisan cheese and single-origin chocolate. Processors that invest in vintage-dated tins, single-catch labeling, and chef collaborations can capture the 15–20% price premium documented in European specialty retail The Canned Seafood Market has significant whitespace in premium canned seafood brand positioning across Asia-Pacific and South America, where artisan canned fish remains virtually nonexistent.

Emerging-Market Protein Gap

Sub-Saharan Africa and South Asia face a combined animal-protein deficit that the World Bank estimates at 14 million metric tons annually [9]. Canned sardines and mackerel — affordable, ambient-stable, and nutrient-dense — are natural candidates to fill this gap. Government procurement programs for school feeding and military provisioning represent addressable demand of roughly USD 1.8 billion that remains largely untapped by branded processors

Data-Driven Supply Chain and Traceability Monetization

Blockchain-verified catch data and QR-coded traceability can be monetized beyond compliance. Processors that offer full-chain transparency are licensing their data to ESG-rating agencies, sustainability-linked bond issuers, and retail partners seeking Scope 3 emissions verification [7]. This data monetization pathway turns a cost center (sustainable seafood canning compliance) into a revenue stream, with early movers reporting incremental revenue of 2–4% of annual sales

Functional and Fortified Canned Seafood

Product innovation is extending the category into functional-food territory. Canned tuna salmon products fortified with added vitamin D, collagen peptides, or turmeric-infused oils are gaining shelf space in health-focused retailers. The global functional-food sector is growing at 7.5% annually [10], and the Canned Seafood Market can ride this wave by repositioning tinned fish as a performance-nutrition platform rather than a pantry fallback.

Foodservice and Institutional Channel Expansion

Quick-service restaurant chains and institutional caterers are increasingly substituting frozen fish with canned alternatives to reduce kitchen labor and energy costs. A single case of canned tuna eliminates thawing time, reduces prep waste by an estimated 8–12%, and simplifies HACCP compliance


Future Outlook

Smart Canning and Industry 4.0 Integration

Automation and AI-driven quality control are transforming cannery operations. Machine-vision systems that detect fill-level inconsistencies and foreign-object contamination at 600 cans per minute are already deployed by Thai Union and Bolton Group [18]. The Canned Seafood Market will see broader adoption of predictive-maintenance platforms and digital-twin factory models through 2030, reducing waste by an estimated 8–12% and improving line uptime.

Sustainability-Linked Finance and ESG Reporting

As institutional investors integrate ocean-health metrics into portfolio construction, canned seafood processors with MSC/ASC certifications and transparent Scope 3 emissions data gain preferential access to sustainability-linked loans. Sustainable seafood canning practices are shifting from a marketing asset to a cost-of-capital advantage.

Plant-Based and Hybrid Alternatives

Plant-based seafood alternatives — using pea protein, algae, and konjac — are entering the canned-food aisle. While current penetration is below 2%, the segment is growing at 12–15% annually and could capture 5–7% of the Canned Seafood Market by 2035 [19]. Incumbents are hedging through dual-format launches: traditional canned tuna alongside plant-based "tuna-style" products under the same brand umbrella.

Climate Adaptation and Fishery Resilience

Ocean warming, acidification, and shifting fish migration patterns present the defining long-term risk for the Canned Seafood Market. FAO projections suggest tropical fishery yields could decline 10–25% by 2050 under moderate warming scenarios [20]. Processors are responding by diversifying species portfolios — incorporating anchovies, herring, and underutilized bycatch species — and investing in aquaculture-sourced raw material to buffer against wild-catch volatility. Climate-adaptive sourcing will separate resilient brands from vulnerable ones over the next decade.


Market Segmentation

By Product Type

Segment Key Metric Primary Demand Driver
Canned Tuna ~38% share (2025) Versatility; global brand recognition
Canned Salmon 5.9% CAGR Health trends; omega-3 demand
Canned Sardines USD 5.1 B (2025) Affordability; emerging-market staple
Canned Mackerel 5.2% CAGR Canned sardines mackerel trend; European demand
Canned Shrimp & Others ~8% share (2025) Niche premium and regional preferences


Canned tuna dominates the Canned Seafood Market by a wide margin, anchored by decades of brand building from StarKist, Bumble Bee, and Chicken of the Sea in North America and John West and Rio Mare in Europe. The canned tuna salmon segment collectively represents over half of global category revenue, reflecting these species' broad culinary applications and strong nutritional profiles. Premium canned seafood brand entrants have disrupted the tuna segment specifically, introducing olive-oil-packed, pole-and-line-caught variants that command retail prices three to five times above commodity alternatives.

Canned sardines and mackerel represent the fastest-moving story in the category. The canned sardines mackerel trend has propelled these species from utilitarian pantry items to curated culinary experiences, particularly in the ready-to-eat seafood convenience format. Portuguese and Spanish producers have seen export volumes to North America double since 2021 [12], and social-media-driven discovery continues to introduce new consumer cohorts to the category.

By Distribution Channel

Segment Key Metric Primary Demand Driver
Supermarkets/Hypermarkets ~52% share (2025) In-store visibility; impulse purchase
Convenience Stores USD 3.4 B (2025) On-the-go consumption; single-serve packs
E-Commerce 7.3% CAGR DTC premium brands; subscription models
Foodservice/Institutional ~14% share (2025) Cost efficiency; labor savings


Supermarkets remain the backbone of the Canned Seafood Market distribution infrastructure, though their share is gradually eroding as e-commerce gains ground. Online channels particularly benefit premium canned seafood brand positioning, where storytelling and provenance details translate more effectively in a digital format than on a crowded physical shelf. Ready-to-eat seafood convenience products in single-serve formats are driving convenience-store growth, particularly in Japan and South Korea where ambient protein snacking is culturally embedded.

By Packaging Type

Segment Key Metric Primary Demand Driver
Metal Cans ~71% share (2025) Traditional format; recyclability
Pouches/Flexible Packaging 6.4% CAGR Lightweight; portion control
Glass Jars USD 1.6 B (2025) Premium positioning; visual appeal


Metal cans remain the workhorse format, but flexible pouches are steadily gaining share as they reduce packaging weight by 60–75% versus traditional steel cans and align with sustainability-conscious consumer preferences. Sustainable seafood canning increasingly incorporates recyclable and reduced-material packaging innovations, with several major processors committing to 100% recyclable packaging by 2030.


Regional Market Share Analysis

Region Key Metric Primary Investment Themes
North America ~32% share (2025) Private-label growth; premium canned seafood brand expansion
Europe ~27% share (2025) Sustainable seafood canning leadership; conservas culture
Asia-Pacific 6.1% CAGR (2026–2035) Urbanization; rising protein demand; capacity expansion
South America USD 2.5 B (2025) Sardine and mackerel exports; domestic protein demand
Middle East & Africa 5.4% CAGR (2026–2035) Food security programs; import reliance; halal certification
Total USD 31.2 B (2025)

The Canned Seafood Market exhibits a balanced but shifting regional structure, with mature Western markets still dominant by value while Asia-Pacific and emerging regions drive incremental volume growth.


North America

Country Key Metric Key Driver
United States ~78% of regional revenue Retail private-label and club-channel penetration
Canada 5.2% CAGR Health-conscious consumer shift toward omega-3 sources
Mexico USD 0.9 B (2025) Canned tuna as affordable protein staple


The United States alone represents roughly USD 7.8 billion of the North American Canned Seafood Market. Walmart, Costco, and Kroger have all expanded private-label canned tuna salmon and sardine lines since 2023, compressing branded margins but expanding category shelf space. Canada's growth is fueled by immigration-driven demand diversity and a strong affinity for wild Pacific salmon products. Mexico's consumption remains heavily indexed to canned tuna, which accounts for over 70% of the country's canned seafood volume.

Europe

Country Key Metric Key Driver
Spain ~22% of regional revenue Conservas tradition; export-oriented processing base
United Kingdom 4.3% CAGR Ready-to-eat seafood convenience and sandwich culture
Portugal USD 1.1 B (2025) Artisan canning heritage; premium export growth
Germany ~11% of regional share Health and sustainability-conscious consumer base


Europe's Canned Seafood Market is shaped by a deep cultural affinity for preserved fish, particularly across the Iberian Peninsula and Scandinavia. The canned sardines mackerel trend has its spiritual home in Portugal and Spain, where family-owned canneries dating to the 19th century have been revitalized by global demand for artisan products [12]. The UK remains the largest single-country consumption market in Northern Europe, driven by the ready-to-eat seafood convenience segment in sandwich and salad meal-deal formats.

Asia-Pacific

Country Key Metric Key Driver
Thailand ~26% of regional revenue World's largest tuna-canning hub; export-driven
China 7.2% CAGR Rapid e-commerce growth; rising urban protein intake
Japan USD 2.8 B (2025) Mature, premium-oriented domestic consumption
Indonesia 6.8% CAGR Domestic sardine consumption; growing processing capacity


Asia-Pacific is both the production engine and the demand frontier for the Canned Seafood Market. Thailand processes an estimated 800,000 MT of canned tuna annually, supplying over 40% of global exports [16]. Japan's market, by contrast, is consumption-led and quality-obsessed, with consumers paying premiums for domestically caught and hand-packed products. China's trajectory is the region's wildcard — a combination of e-commerce penetration and rising middle-class protein demand could add USD 2–3 billion in incremental category value by 2032.

South America

Country Key Metric Key Driver
Ecuador ~35% of regional revenue Tuna-canning export powerhouse
Brazil 5.6% CAGR Sardine consumption; domestic market growth
Chile USD 0.4 B (2025) Salmon and mackerel canning for export


Ecuador's tuna fleet and processing infrastructure make it the dominant player in South America's Canned Seafood Market, exporting primarily to Europe and North America. Brazil's domestic sardine market is the region's largest by volume, supported by government-subsidized school-lunch programs that include canned fish as a protein source [9]. Chile contributes through its established salmon aquaculture sector, increasingly diverting a portion of harvest into value-added canned formats.

Middle East & Africa

Country Key Metric Key Driver
Morocco ~28% of regional revenue Sardine-canning export leader in Africa
Saudi Arabia 5.8% CAGR Import-dependent; halal-certified seafood demand
South Africa USD 0.3 B (2025) Pilchard canning; domestic food-security role


Morocco anchors the African canned seafood industry, processing over 600,000 MT of sardines annually and exporting to 100+ countries [17]. The broader Middle East & Africa region faces food-security imperatives that favor ambient-stable protein — making the Canned Seafood Market a strategic category for government procurement and humanitarian supply chains. Saudi Arabia's import demand is growing rapidly as the Kingdom diversifies its food basket under Vision 2030 goals.


Regional Market Share
 

Competitive Benchmarking

The Canned Seafood Market is moderately concentrated, with an estimated top five share of 35–40% and a Herfindahl-Hirschman Index (HHI) in the low-to-moderate range (~700–900). The landscape blends multinational conglomerates with vertically integrated Asian processors and a growing cohort of premium niche brands.

Company Est. Revenue Share Range Key Offerings Strategic Positioning
Thai Union Group ~12–15% Chicken of the Sea, John West, King Oscar Vertically integrated global leader; sustainability focus
Bolton Group ~7–9% Rio Mare, Saupiquet European premium positioning; olive-oil-packed lines
Bumble Bee Foods ~5–7% Bumble Bee, Brunswick North American mass-market; private-label co-packing
Dongwon Industries ~4–6% StarKist, Dongwon Integrated tuna supply chain; U.S. and Korean markets
Grupo Calvo ~3–5% Calvo, Nostromo Iberian heritage; South American expansion
Connors Bros./Clover Leaf ~2–4% Clover Leaf, Brunswick Canada Canadian market leader; sardine and herring specialty
Wild Planet Foods ~1–3% Wild Planet Sustainable sourcing pioneer; premium U.S. brand
Fishwife ~<1% Fishwife tinned fish DTC disruptor; social-media-native branding
Ramirez & Cia ~1–2% Ramirez conservas Oldest canned fish brand (est. 1853); Portuguese heritage
Princes Group ~3–5% Princes, Napolina UK market leader; broad ambience-food portfolio


Recent News & Developments


  • European Commission (November 2024): Proposed tightening IUU Regulation enforcement with mandatory digital catch certificates, directly impacting processors in the Canned Seafood Market [2].


  • Wild Planet Foods (March 2024): Achieved B-Corp recertification and expanded its ready-to-eat seafood convenience pouch line to 12 new SKUs targeting the foodservice channel [24].
  • U.S. FDA (January 2024): Updated sodium-reduction guidance for canned seafood, encouraging voluntary 15% sodium reduction targets by 2027, affecting formulations across the Canned Seafood Market [25].


Report Scope

Parameter Detail
Market Scope Global Canned Seafood Market (canned tuna, salmon, sardines, mackerel, shrimp, and other preserved seafood products)
Study Period 2021–2035
CAGR 4.8% (2026–2035)
Market Size — 2025 (Base Year) USD 31.2 Billion
Market Size — 2035 (Forecast End) USD 47.8 Billion
Fastest Growing Segments Canned Salmon (by product); E-Commerce (by channel); Asia-Pacific (by region)
Companies Profiled Thai Union Group, Bolton Group, Bumble Bee Foods, Dongwon Industries, Grupo Calvo, Connors Bros./Clover Leaf, Wild Planet Foods, Fishwife, Ramirez & Cia, Princes Group
Valuation Currency USD (constant 2025)


FAQs

How do tariffs on imported canned seafood affect retail pricing in North America?

U.S. tariffs on canned tuna from Thailand and Ecuador currently range from 6–35% depending on species and preparation, directly inflating shelf prices by USD 0.15–0.40 per unit [4]. Canadian tariffs are lower but apply anti-dumping duties on Vietnamese sardine products. Retailers absorb some impact through private-label sourcing shifts.

What food-safety certifications should procurement teams require from canned seafood suppliers?

Minimum thresholds include BRCGS or SQF certification for facility hygiene, MSC or ASC chain-of-custody for sustainable seafood canning claims, and HACCP compliance [2]. ISO 22000 adds a management system layer valued by multinational buyers.

How does canned seafood compare to frozen in terms of nutritional retention?

Thermal processing preserves 85–95% of omega-3 fatty acids and protein bioavailability, comparable to flash-freezing [14]. Vitamin D content drops modestly during retort sterilization. Overall, the nutritional gap between canned and frozen is negligible for most species.

Which emerging species are gaining traction in the Canned Seafood Market beyond tuna and sardines?

Smoked mussels, clams, and octopus are the fastest-growing niche segments, driven by the premium canned seafood brand movement [3]. Anchovies packed in artisan oils and sprat products from Baltic producers are also carving out specialty retail positioning.

What shelf-life advantages does retort canning offer over alternative preservation methods?

Retort-sterilized cans achieve 3–5-year ambient shelf life without refrigeration, outperforming MAP-packaged alternatives by 2–3x [18]. This makes canned seafood ideal for humanitarian aid, military provisioning, and remote-area distribution.

How are private-label programs reshaping competitive dynamics in the Canned Seafood Market?

Private-label canned seafood now represents 35–40% of North American and European category volume, pressuring branded margins by 200–400 basis points. Processors like Bumble Bee and Princes increasingly rely on co-packing contracts to maintain utilization rates.

What role does aquaculture-sourced raw material play in the future of canned seafood production?

Farmed salmon and shrimp already supply roughly 18% of canned seafood raw material globally, and this share is projected to reach 25–30% by 2032 as wild-catch volumes plateau [20]. Aquaculture integration reduces supply-chain volatility and supports sustainable seafood canning goals.


Author
Author
Author Profile
Pradeep Nandi LinkedIn
Senior Research Analyst
I have a bachelor's degree in mechanical engineering and an MBA. I have more than two years of expertise in the retail, food, and beverage, chemical, and material industries, and hence have developed a sound cross-domain expertise. A firm believer in lifelong learning and sharing of knowledge. Having a proclivity for hatching ideas and trying to absorb as much information as possible in a short amount of time. Introducing corporates to the data and insight, which enables them to move from probability to possibility, has been my key areas of interest. 

Research Approach


Secondary Research

The secondary research process involved comprehensive analysis of regulatory databases, industry trade statistics, peer-reviewed food science journals, fisheries publications, and authoritative food safety organizations. Key sources included the US Food & Drug Administration (FDA) Center for Food Safety and Applied Nutrition, European Food Safety Authority (EFSA), Food and Agriculture Organization (FAO) of the United Nations Fishery and Aquaculture Department, National Oceanic and Atmospheric Administration (NOAA) Fisheries, National Marine Fisheries Service (NMFS), United States Department of Agriculture (USDA) Economic Research Service, European Commission Directorate-General for Maritime Affairs and Fisheries (DG MARE), Codex Alimentarius Commission, Japan Ministry of Agriculture, Forestry and Fisheries (MAFF), China National Bureau of Statistics, UN Comtrade Database, International Trade Centre (ITC) Trade Map, World Customs Organization, National Fisheries Institute (NFI), Global Seafood Alliance (GSA), International Seafood Sustainability Foundation (ISSF), Seafood Nutrition Partnership, Marine Stewardship Council (MSC) certifications database, and Food and Drink Federation (FDF) industry reports. These sources were used to collect global capture fisheries and aquaculture production statistics, canning capacity data, food safety compliance records, consumer expenditure surveys, international trade flows of prepared and preserved seafood, retail scanner data from NielsenIQ and Circana (IRI), and sustainability certification tracking for tuna, salmon, sardines, mollusks, and other commercially canned species.


Primary Research

Qualitative and quantitative insights were obtained by interviewing supply-side and demand-side stakeholders during the primary research process. CEOs, Chief Sustainability Officers, VPs of Procurement and Aquaculture Operations, Quality Assurance Directors, and Plant Managers from canned seafood manufacturers, fishing fleet operators, aquaculture farms, canning facilities, and metal packaging suppliers comprised the supply-side sources. Grocery Managers and Category Managers constituted demand-side sources. Buyers from supermarket chains and convenience stores, Procurement Directors from broadline food service distributors (e.g., Sysco, US Foods, Bidfood), Pantry Managers from institutional catering operations, E-commerce Leads from online retail platforms (Amazon Fresh, Ocado, Alibaba), and Sustainability Officers from major retail groups. Market segmentation was validated in the canned fish (tuna, salmon, sardines), canned shellfish (clams, mussels, oysters), and seafood mix categories through primary research. Sustainability certification timelines (MSC, ASC, Dolphin-Safe) were confirmed. Private label versus branded procurement strategies, shelf-space allocation dynamics, and pricing elasticity were gathered in the easy-open cans, standard cans, and glass jar packaging formats.

Primary Respondent Breakdown:

By Designation: C-level Primaries (32%), Director Level (33%), Others (35%)

By Region: North America (32%), Europe (30%), Asia-Pacific (28%), Rest of World (10%)


Market Size Estimation

Global market valuation was derived through production volume analysis and revenue mapping across the value chain from fishery landing to retail shelf. The methodology included:

Identification of 50+ key manufacturers across North America, Europe, Asia-Pacific, and Latin America (including Thai Union Group, Maruha Nichiro Corporation, Dongwon Industries, StarKist Co., Bumble Bee Foods, Bolton Group, and Princes Group)

Product mapping for canned seafood blend, canned shellfish (clams, mussels, oysters, crab), and canned fish (tuna, salmon, sardines, mackerel)

Analysis of reported and modeled annual revenues specific to canned seafood portfolios, excluding fresh, frozen, and dried seafood operations where possible

Coverage of manufacturers representing 75-80% of global market share in 2024

Extrapolation using bottom-up (fisheries landings and aquaculture production × canning yield ratios × average selling price by species and country) and top-down (manufacturer revenue validation and trade data triangulation) approaches to derive segment-specific valuations for supermarkets, online retail, convenience stores, and specialty channels, as well as household versus food service end-use applications

Download Free Sample

Kindly complete the form below to receive a free sample of this Report