Segmentation Quick Reference
| Dimension | Sub-Segments | Dominant Segment | Fastest Growing Segment |
| Product Type | Light Tuna, White Tuna | Light Tuna | White Tuna |
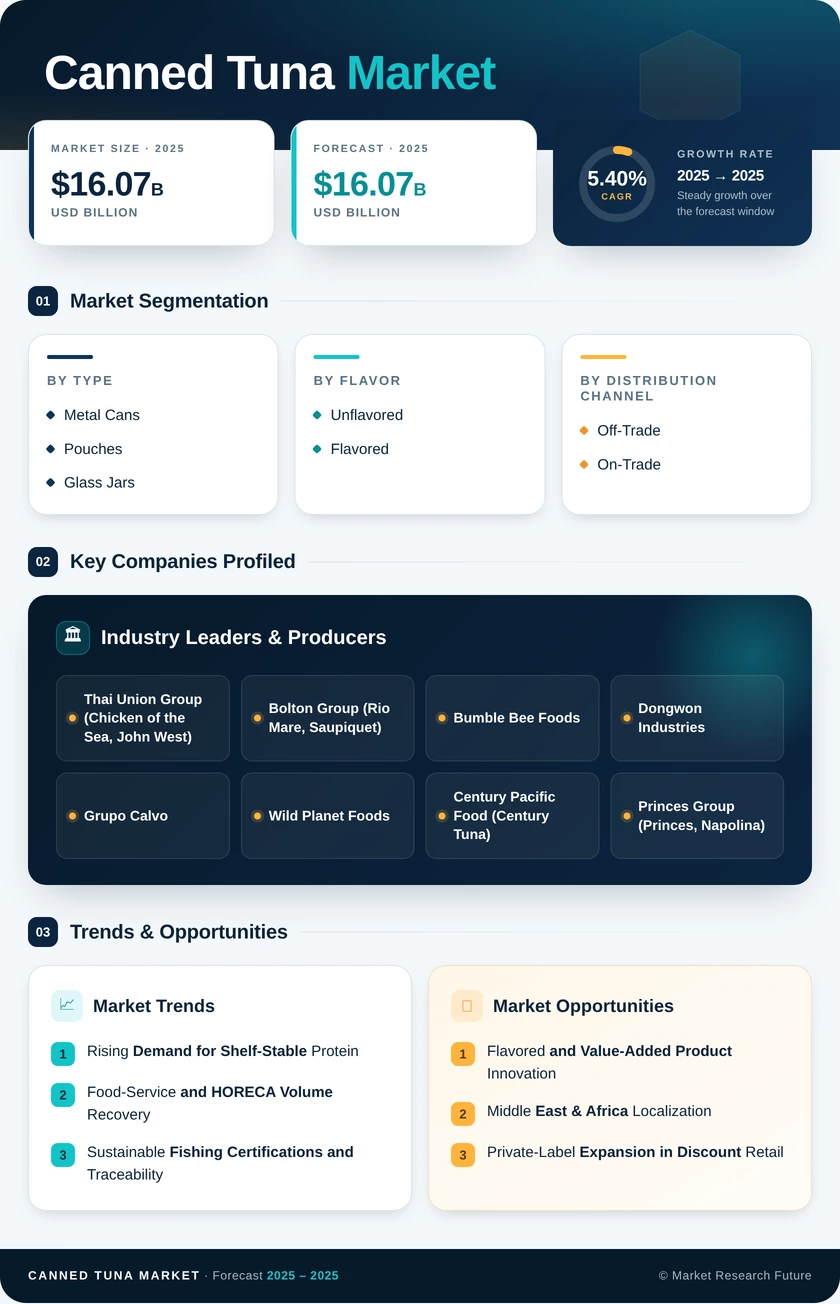
| Flavor | Unflavored, Flavored | Unflavored | Flavored |
| Packaging Type | Metal Cans, Pouches, Glass Jars | Metal Cans | Pouches |
| Distribution Channel | Off-Trade, On-Trade | Off-Trade | On-Trade |
| Region | North America, Europe, Asia-Pacific, South America, Middle East & Africa | Europe | Middle East & Africa |
Market Segmentation Overview
By Product Type
| Sub-Segment | Key Trend |
| Light Tuna | Volume anchor driven by skipjack affordability and FDA low-mercury endorsement; private-label penetration increasing |
| White Tuna | Premium growth fueled by MSC certification and albacore demand in specialty and health-oriented retail |
Light tuna dominates global volumes due to skipjack's cost advantage and regulatory favorability. White tuna is capturing incremental share as sustainability-certified albacore products command higher margins and attract health-conscious buyers willing to pay premium prices.
By Flavor
| Sub-Segment | Key Trend |
| Unflavored | Staple format for home cooking and food-service applications; stable demand across all regions |
| Flavored | Rapid innovation cycle with chili, herb, smoked, and teriyaki variants targeting convenience-oriented younger consumers |
Unflavored tuna remains the default purchase for most households globally. Flavored varieties are the growth engine, with processors launching 15–20 new SKUs per year across European and North American markets to capture millennial demand for zero-prep meal solutions.
By Packaging Type
| Sub-Segment | Key Trend |
| Metal Cans | Legacy format with the highest consumer trust and longest shelf life; aluminum recyclability supports ESG positioning |
| Pouches | Fastest-growing format driven by weight reduction, single-serve convenience, and lower processing energy costs |
| Glass Jars | Niche premium format popular in Southern Europe for the visual presentation of whole tuna loins |
Metal cans dominate the packaging landscape by revenue and unit volume. Pouches are rapidly gaining ground as sustainability mandates and on-the-go consumption patterns favor lighter, flexible packaging formats that align with circular economy goals.
By Distribution Channel
| Sub-Segment | Key Trend |
| Off-Trade | Supermarkets, hypermarkets, discount grocers, and e-commerce platforms lead volume sales; private-label growth accelerating |
| On-Trade | Hotels, restaurants, and catering buyers rebuilding post-pandemic volumes; menu diversification driving institutional demand |
Off-trade channels remain the primary revenue source as grocery retail scales private-label canned tuna programs. On-trade distribution is recovering strongly, with HORECA procurement in Europe and North America returning to 2019 baseline volumes during 2024–2025.