Canned Tuna Market

Key Players: Thai Union Group (Chicken of the Sea, John West), Bolton Group (Rio Mare, Saupiquet), Bumble Bee Foods, Dongwon Industries, Grupo Calvo, Wild Planet Foods, Century Pacific Food (Century Tuna), Princes Group (Princes, Napolina)

Canned Tuna Market

Canned Tuna Market Size, Share, Industry Trend & Analysis Research Report Information By Product Type (Light Tuna, White Tuna), By Flavor (Unflavored, Flavored), By Packaging Type (Metal Cans, Pouches, Glass Jars), By Distribution Channel (Off-Trade, On-Trade), By Region (North America, Europe, Asia-Pacific, South America, Middle East & Africa) - Forecast Till 2035
ID: MRFR/FnB/8857-CR
186 Pages
Snehal Singh
Last Updated: June 16, 2026
 

Canned Tuna Market Summary

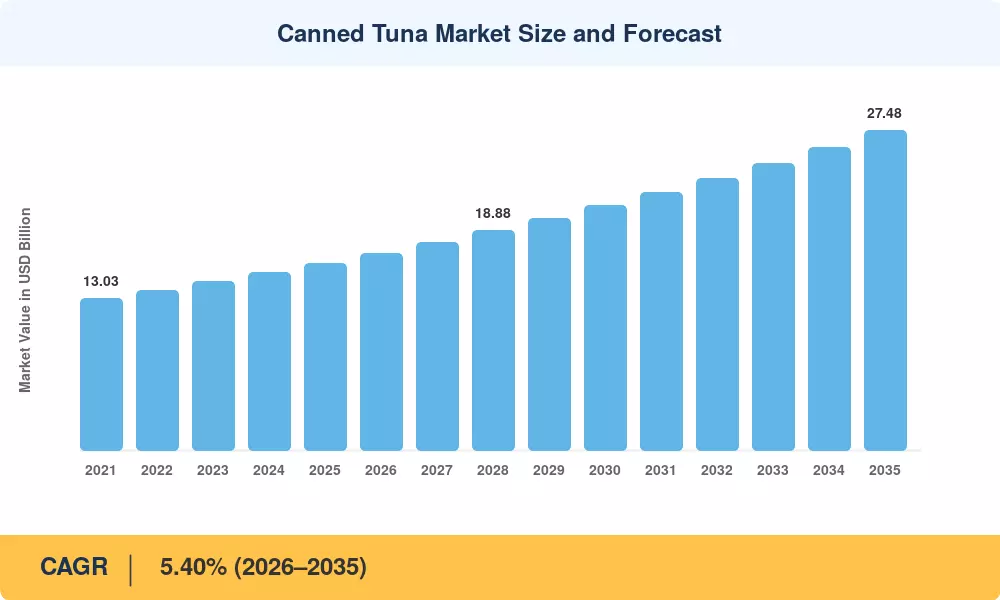
The global Canned Tuna Market was valued at USD 16.07 billion in 2025 and is projected to grow from USD 17.06 billion in 2026 to USD 27.48 billion by 2035, registering a CAGR of 5.40% during 2026–2035. Rising consumer preference for shelf-stable, high-protein convenience foods and expanding food-service procurement volumes are the twin engines behind this trajectory. Government-backed nutritional programs in Southeast Asia and Sub-Saharan Africa — several allocating over USD 200 million annually to fortified food distribution — are adding incremental demand for ready-to-eat canned fish products [2].

Processing technology is undergoing a quiet but consequential shift. Legacy steel-can lines, some dating back three decades, are giving way to flexible retort pouch systems that cut material costs by roughly 18% and reduce carbon intensity per unit. Thai Union Group alone committed USD 150 million between 2023 and 2025 to upgrade its Southeast Asian plants with automated pouch-filling and nitrogen-flush sealing lines, a move that other vertically integrated players are replicating across the Indian Ocean rim [3]. The transition also enables lighter shipping weights, which matters as ocean freight rates remain elevated.

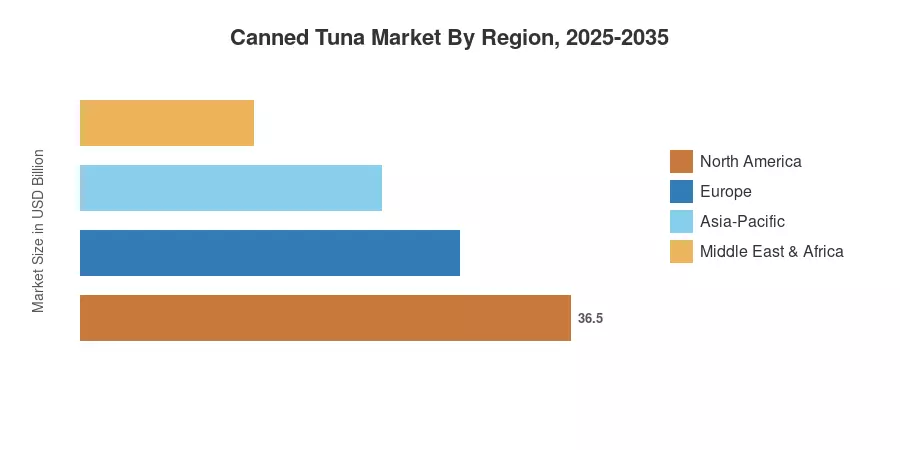
Europe commands the largest share of the Canned Tuna Market at an estimated 37.80% of 2025 revenues, driven by deeply entrenched consumption habits in Spain, Italy, and France. The Middle East & Africa region is the fastest-growing Region, with a projected CAGR of 6.10% through 2035, buoyed by new canning plants in Oman and rising per-capita protein intake across the Gulf Cooperation Council states Asia-Pacific holds the second-largest share at approximately 24.50%, anchored by Japan's premium sashimi-grade canned tuna segment and growing skipjack and albacore tuna consumption in the Philippines and Indonesia.


Key Report Takeaways

• By Product Type

  • Light tuna accounted for 63.10% of the Canned Tuna Market in 2025, supported by skipjack's favorable mercury profile under FDA "Best Choice" guidance
  • White tuna is forecast to expand at a 6.00% CAGR through 2035, as premiumization and MSC-certified sourcing lift retail price points

• By Packaging Type

  • Metal cans generated USD 14.20 billion in Canned Tuna Market revenue during 2025, reflecting entrenched consumer trust in traditional packaging
  • Pouches are projected to post a 6.20% CAGR from 2026 to 2035 as retailers prioritize lightweight, recyclable formats

• By Distribution Channel

  • Off-trade channels captured roughly 64.30% of global sales in 2025, with supermarket private-label lines expanding aggressively
  • On-trade distribution is anticipated to grow at a 6.70% CAGR through 2035, fueled by post-pandemic food-service volume recovery

• By Region

  • Europe dominated with a 37.80% share of the Canned Tuna Market in 2025, led by per-capita consumption exceeding 3 kg annually in Spain
  • The Middle East & Africa region leads growth projections at a 6.10% CAGR through 2035


Canned Tuna Market Size and Forecast (2021–2035)

The figures below are derived from MRFR's proprietary demand-supply triangulation model, cross-referenced with FAO catch data, trade flow databases, and processor financial disclosures. Historical values (2021–2024) reflect actual industry revenues; the base year (2025) blends preliminary shipment data with channel-level sell-through estimates. Forecast values (2026–2035) apply MRFR's calibrated CAGR of 5.40%.

Canned Tuna Market Size and Forecast
Our Impact
Enabled $4.3B Revenue Impact for Fortune 500 and Leading Multinationals
Partnering with 2000+ Global Organizations Each Year
30K+ Citations by Top-Tier Firms in the Industry
 

Driver Impact Analysis

Driver ~% Impact on CAGR Geographic Relevance Impact Timeline
Rising demand for shelf-stable protein +1.20% Global Short-term (≤2 yr)
Food-service & HORECA recovery +0.90% Europe, North America Short-term (≤2 yr)
Sustainable tuna fishing certifications (MSC, pole-and-line caught tuna) +0.70% Europe, Asia-Pacific Medium-term (2–4 yr)
Flexible packaging innovation (pouches, stand-up formats) +0.55% Global Medium-term (2–4 yr)
E-commerce subscription models +0.45% North America, Europe Medium-term (2–4 yr)
Emerging-market capacity expansion (MEA, South America) +0.80% MEA, South America Long-term (≥4 yr)
Flavored & value-added product diversification +0.40% Asia-Pacific, North America Long-term (≥4 yr)


Rising Demand for Shelf-Stable Protein

Cost-conscious consumers across both developed and emerging economies continue to pivot toward affordable, long-shelf-life protein options. In the United States, USDA Economic Research Service data shows that canned tuna in oil and water remains the second-most purchased shelf-stable protein after canned chicken, with per-household spending rising 8.3% between 2022 and 2024 [2]. Inflationary pressures on fresh seafood — wholesale Atlantic salmon prices climbed 22% over the same window — have widened the price gap, making ready-to-eat canned fish an even more compelling pantry staple for budget-constrained families.

Food-Service and HORECA Volume Recovery

Hotel, restaurant, and catering procurement of canned tuna rebounded substantially through 2024, with European food-service distributors reporting 14% year-over-year volume gains. Quick-service restaurant chains in Italy and Spain launched approximately 20 SKUs of tuna-based menu items during 2023–2024, taking advantage of portion-control benefits and canned tuna’s stable pricing compared to fresh alternatives. In the near term, this recovery creates a structural tailwind for the Canned Tuna Market.


Sustainable Fishing Certifications and Traceability

The Marine Stewardship Council certified over 28% of global tuna catch by volume as of 2024, up from 19% in 2020 [6]. Retailers in the EU and UK increasingly mandate MSC or equivalent sustainability labels as a condition for shelf placement, pushing processors toward pole-and-line caught tuna and FAD-free purse-seine methods. This certification premium — estimated at 12–15% above conventional product — supports margin expansion even as raw skipjack prices fluctuate.

E-Commerce and Subscription Bundling

Online grocery platforms have transformed repeat-purchase dynamics for shelf-stable categories. Amazon Fresh and regional equivalents report that canned tuna subscription orders grew 34% in 2024 across North America and Western Europe [7]. Subscription bundles, often combining skipjack and albacore tuna varieties with complementary pantry items, boost average order values by approximately USD 8–12 per cycle, enhancing lifetime customer value for brand owners in the Canned Tuna Market.


Restraints Impact Analysis

Restraint ~% Impact on CAGR Geographic Relevance Impact Timeline
Skipjack price volatility and supply uncertainty –0.60% Global Short-term (≤2 yr)
Mercury-content consumer perception –0.45% North America, Europe Medium-term (2–4 yr)
Competition from alternative canned proteins –0.35% North America Medium-term (2–4 yr)
Regulatory fragmentation on labeling standards –0.30% Asia-Pacific, South America Long-term (≥4 yr)
IUU fishing enforcement and catch quota reductions –0.25% Western & Central Pacific Long-term (≥4 yr)


Skipjack Price Volatility

Catch deficits in the Western and Central Pacific due to El Niño resulted in Bangkok reference-price movements of up to 40% for skipjack tuna, the backbone species for light canned tuna, between Q1 2023 and Q4 2024 [10]. Margins for non-contract processors were squeezed by 300-500 basis points during high price periods, with numerous mid-tier Southeast Asian canners idling production lines. Such volatility creates uncertainty for planning across the Canned Tuna Market supply.

Mercury-Content Consumer Perception

Despite FDA guidance classifying skipjack as a "Best Choice" low-mercury option, persistent consumer anxiety — particularly among pregnant women and parents — continues to dampen frequency of purchase in some demographics [11]. A 2024 survey by the European Food Safety Authority found that 31% of EU consumers actively limited canned tuna intake due to mercury concerns, even though actual methylmercury levels in commercial skipjack and albacore tuna products consistently fall well below regulatory thresholds.

Competition from Alternative Canned Proteins

Plant-based canned "tuna" alternatives from brands such as Good Catch and Loma Linda captured an estimated 2.8% of the North American shelf-stable seafood category by value in 2024 [12]. While still a niche segment, these products attract environmentally motivated younger consumers and may gradually erode share at the margin, particularly in premium urban retail channels where sustainable tuna fishing claims compete with zero-bycatch plant-based narratives.


Canned Tuna Market Opportunities

Flavored and Value-Added Product Innovation

Flavored canned tuna – infused with chile, lemon-herb, or smoked preparations – rose at roughly double the rate of unflavored goods in 2024 across European retail. Processors investing in culinary R&D to generate restaurant-inspired flavor profiles can command 25–30% price premiums above basic canned tuna in oil and water, targeting millennial and Gen-Z consumers who value convenience and taste variety


Middle East & Africa Localization

The Canned Tuna Market in the MEA region is transitioning from import dependence to domestic production. Oman's new 100-million-can-per-year facility, operational since late 2024, exemplifies this trend [8]. Saudi Arabia's Vision 2030 fisheries development program allocates approximately USD 1.3 billion to aquaculture and seafood processing infrastructure, creating opportunities for joint ventures with established canning multinationals

Private-Label Expansion in Discount Retail

Discount grocery chains — Aldi, Lidl, BIM, and D1 — are expanding canned tuna private-label portfolios at twice the rate of branded competitors in Europe and South America. Private-label canned tuna now represents over 38% of European volume, and co-manufacturing contracts offer mid-tier processors stable utilization rates exceeding 85%

Blockchain-Enabled Traceability Platforms

Blockchain traceability is gaining traction as consumers seek more catch-to-can transparency. Platforms such as OpenSC and Connecting Food [15] enable end-consumers to verify the provenance of pole-and-line caught tuna through QR codes on packaging. Processors that are involved in developing traceability infrastructure are positioning themselves to get preferential shelf space and premium pricing in sustainability-minded markets in Europe and North America.


Subscription-Based Direct-to-Consumer Models

DTC subscription brands such as Wild Planet and Safe Catch have demonstrated that ready-to-eat canned fish can sustain recurring-revenue models with churn rates below 15% per quarter [7]. The opportunity extends to emerging markets where mobile-commerce penetration is rising rapidly, enabling smaller processors to bypass traditional distribution bottlenecks


Canned Tuna Market Future Outlook

AI-Driven Quality Control and Processing Optimization

Machine-vision systems that can detect discolouration, bone fragments, and fill-level abnormalities at line speeds of more than 400 cans per minute are heading for commercial deployment. By 2028, it is anticipated that 35% of large-scale tuna canning plants will implement AI-powered inspection, resulting in a reduction in rejection rates of up to 60% and a reduction in quality-related recall costs throughout the Canned Tuna Market.


Circular Packaging and Extended Producer Responsibility

EU Extended Producer Responsibility regulations taking full effect by 2027 will require canned tuna producers selling into European markets to fund end-of-life collection for metal and flexible packaging. This regulatory pressure is accelerating investment in mono-material pouches and infinitely recyclable aluminum, with industry-wide packaging R&D budgets expected to increase by 20% over 2025 levels [17].

Climate-Resilient Supply Chains

El Niño and La Niña oscillations are shifting skipjack migration patterns, with the Western and Central Pacific Fisheries Commission projecting a 5–10% eastward migration of peak catch zones by 2030 [14]. Processors investing in multi-ocean sourcing strategies and long-term contracts with certified fisheries will be better insulated from the catch volatility that periodically disrupts canned tuna in oil and water supply chains.

Premiumization and Protein Positioning

The global high-protein diet trend — valued at over USD 28 billion across packaged food categories in 2025 — is repositioning canned tuna from a recession staple to an active-lifestyle product [18]. Brands launching high-protein, low-sodium, and omega-3-enriched canned tuna SKUs are commanding 20–35% price premiums in North American and European specialty retail, a trend that will expand the addressable Canned Tuna Market across fitness and health-conscious consumer segments through 2035.


Canned Tuna Market Segmentation

By Product Type

Segment Key Metric Primary Demand Driver
Light Tuna 63.10% share (2025) Low mercury; FDA "Best Choice"; price accessibility
White Tuna CAGR 6.00% (2026–2035) MSC premiumization; albacore tuna demand in specialty retail


Light tuna — predominantly skipjack — anchors the Canned Tuna Market by volume, driven by its competitive pricing and regulatory endorsement as a low-mercury protein source. Skipjack and albacore tuna together account for over 90% of commercial canned tuna raw material, with skipjack dominating commodity-tier retail and albacore commanding a premium in gourmet and health-focused segments. White tuna is the fastest-growing segment as consumers trade up toward MSC-certified albacore products with pole-and-line caught tuna provenance claims, particularly in Western European and North American specialty channels.

By Flavor

Segment Key Metric Primary Demand Driver
Unflavored 90.20% share (2025) Versatility; traditional consumer preference
Flavored CAGR 6.50% (2026–2035) Convenience; millennial/Gen-Z taste innovation


Unflavored canned tuna retains overwhelming dominance in the Canned Tuna Market because of its cooking versatility and lower per-unit cost. Flavored varieties — including chili-lime, smoked, Mediterranean herb, and teriyaki-infused products — are expanding rapidly as processors target younger consumers seeking ready-to-eat canned fish that requires no preparation beyond opening the container. European retailers report that flavored SKU counts grew by 40% between 2022 and 2024.

By Packaging Type

Segment Key Metric Primary Demand Driver
Metal Cans USD 14.20 Billion (2025) Consumer trust; shelf life; recyclability
Pouches CAGR 6.20% (2026–2035) Lightweight; lower material cost; single-serve convenience
Glass Jars 3.10% share (2025) Premium positioning; visual product appeal


Metal cans remain the Canned Tuna Market's packaging backbone, trusted by consumers for their durability and up-to-five-year shelf life. Pouches are gaining share rapidly as sustainable tuna fishing brands leverage the format's lower carbon footprint and appeal to on-the-go consumers. Glass jars occupy a niche premium position, particularly in Southern European markets where visual presentation of albacore tuna loins drives impulse purchases.

By Distribution Channel

Segment Key Metric Primary Demand Driver
Off-Trade 64.30% share (2025) Supermarket & discount-retail dominance
On-Trade CAGR 6.70% (2026–2035) HORECA recovery; food-service menu expansion


Off-trade channels — supermarkets, hypermarkets, discount grocers, and e-commerce — form the primary revenue base of the Canned Tuna Market. Private-label products from chains such as Aldi and Carrefour continue to grow their share within this channel. On-trade distribution (hotels, restaurants, catering) is recovering strongly from pandemic-era lows, with food-service buyers rebuilding skipjack and albacore tuna inventories to support expanded sandwich, salad, and pizza menus.


Regional Market Share Analysis

Region Key Metric Primary Investment Themes
North America 18.90% share (2025) Private-label growth; e-commerce penetration
Europe 37.80% share (2025) Sustainable tuna fishing mandates; premiumization
Asia-Pacific 24.50% share (2025) Domestic processing expansion; skipjack supply
South America 7.20% share (2025) Ecuador processing hub; intra-regional trade
Middle East & Africa 11.60% share (2025) Local capacity build-out; import substitution
Total 100.00%  

The Canned Tuna Market exhibits significant geographic diversity, shaped by per-capita seafood consumption patterns, local production capacity, trade agreements, and cultural dietary preferences.


Source Market Research Future (MRFR)Analysis

North America

Country Key Metric Key Driver
US 72.40% of regional share Retail private-label expansion; FDA "Best Choice" promotion
Canada CAGR 5.10% (2026–2035) Health-conscious consumption growth
Mexico USD 0.48 Billion (2025) Price-sensitive protein demand; growing modern trade


The United States dominates North American canned tuna consumption, though per-capita volumes have plateaued as younger demographics rotate toward canned salmon and plant-based alternatives. Canada's Canned Tuna Market is buoyed by immigration-driven population growth and rising interest in sustainable seafood, with MSC-labeled products capturing nearly 35% of shelf facings at major grocers. Mexico's expanding modern-trade footprint — Walmart de México and OXXO combined added over 600 net new stores in 2024 — continues to widen distribution reach for ready-to-eat canned fish products [2].

Europe

Country Key Metric Key Driver
Germany CAGR 4.80% (2026–2035) Discount retail private-label growth
UK USD 1.12 Billion (2025) Post-Brexit tariff realignment; own-brand expansion
France 14.30% of regional share Culinary tradition; flavored product innovation
Italy 18.60% of regional share Highest per-capita canned tuna consumption in Europe
Spain USD 1.85 Billion (2025) Entrenched dietary habits; HORECA recovery
Nordic Countries CAGR 5.20% (2026–2035) Sustainability-driven premiumization
Russia USD 0.38 Billion (2025) Import substitution; domestic brand emergence
Rest of Europe CAGR 4.70% (2026–2035) Eastern European modern-trade expansion


Europe's dominance in the Canned Tuna Market reflects deeply rooted Mediterranean dietary patterns — Italians consume over 4 kg of canned tuna per capita annually, and Spanish households treat it as a weekly meal staple. EU regulations mandating sustainable tuna fishing disclosures on packaging have accelerated MSC adoption among leading processors. The region's food-service sector, recovering strongly post-pandemic, is absorbing higher volumes of canned tuna in oil and water for use in prepared salads, sandwiches, and pizza toppings.

Asia-Pacific

Country Key Metric Key Driver
China CAGR 6.30% (2026–2035) Rising urban protein demand; e-commerce growth
India CAGR 6.50% (2026–2035) Coastal-state consumption; modern retail expansion
Japan USD 1.45 Billion (2025) Premium sashimi-grade canned products
South Korea 8.70% of regional share Convenience-store single-serve formats
ASEAN CAGR 5.80% (2026–2035) Processing hub status (Thailand, Philippines)
Rest of Asia-Pacific USD 0.42 Billion (2025) Emerging consumption patterns


Asia-Pacific serves a dual role in the Canned Tuna Market — as both the world's largest processing base and a major consumption region. Thailand alone processes roughly 30% of global canned tuna output, while Japan's market skews toward premium albacore tuna and yellowfin products priced 40–60% above commodity skipjack lines. India's coastal states — Kerala, Goa, and Karnataka — represent underpenetrated growth pockets where branded ready-to-eat canned fish is displacing loose-sold dried fish in urban retail [5].

South America

Country Key Metric Key Driver
Brazil 48.20% of regional share Largest consumer base; Bolsa Família protein demand
Argentina CAGR 4.60% (2026–2035) Economic recovery; retail modernization
Rest of South America USD 0.31 Billion (2025) Ecuador as a processing & export hub


Ecuador's tuna processing industry — the largest in the Americas — exported over USD 1.8 billion worth of canned and pouched tuna in 2024, supplying both intra-regional markets and European importers under preferential trade agreements [8]. Brazil's Canned Tuna Market benefits from government nutritional assistance programs that include canned protein in food baskets distributed to over 21 million low-income households.

Middle East & Africa

Country Key Metric Key Driver
Saudi Arabia 22.40% of regional share Vision 2030 fisheries investment; rising consumption
UAE CAGR 6.40% (2026–2035) Premium imported brands; expat-driven demand
South Africa USD 0.28 Billion (2025) Affordable protein positioning; Lucky Star brand dominance
Egypt CAGR 6.80% (2026–2035) Population growth; price-sensitive protein substitution
Rest of MEA 31.50% of regional share Oman capacity expansion; East African import growth


The Middle East & Africa region represents the most dynamic frontier for the Canned Tuna Market. Oman's investment in a 100-million-can production facility signals a broader regional shift from pure import reliance toward local value capture. Saudi Arabia's National Fisheries Development Program targets a threefold increase in domestic seafood processing capacity by 2030, creating partnership opportunities for global pole-and-line caught tuna suppliers and canning technology vendors [8].


Canned Tuna Market By Region, 2025-2035
 

Competitive Benchmarking

The Canned Tuna Market exhibits medium concentration, with the top five players collectively holding an estimated 40–48% of global revenue. The competitive structure combines vertically integrated multinationals that control fishing fleets and canneries with specialized regional brands that compete on provenance, sustainability credentials, and flavor innovation.

Company Est. Revenue Share Range Key Offerings Strategic Positioning
Thai Union Group (Chicken of the Sea, John West) ~10–14% Skipjack & albacore canned tuna; pouches; flavored lines Vertically integrated global leader; SeaChange sustainability program
Bolton Group (Rio Mare, Saupiquet) ~7–10% Premium canned tuna in olive oil; Mediterranean flavored range European market leader; Italian heritage branding
Bumble Bee Foods ~5–8% Canned tuna in oil and water; snack kits North American retail stalwart; value positioning
Dongwon Industries ~4–7% Canned tuna; retort pouches; foodservice packs South Korean market leader; ASEAN processing integration
Grupo Calvo ~3–5% Canned tuna; ready-to-eat salads; glass-jar premium line Spanish brand strength; South American expansion
Wild Planet Foods ~2–4% Pole-and-line caught tuna; sustainably sourced albacore Sustainability-first positioning; DTC subscription model
Century Pacific Food (Century Tuna) ~3–5% Canned tuna; flavored variants; value-tier products Philippine market leader; ASEAN export growth
Princes Group (Princes, Napolina) ~2–4% Own-label & branded canned tuna; ready meals UK private-label leader; Mitsubishi Corp. backing
StarKist (Dongwon subsidiary) ~5–8% Canned tuna; tuna creations pouches; single-serve US market co-leader; innovation in pouch formats
Jealsa Rianxeira ~2–3% Private-label canned tuna; MSC-certified lines Europe's largest private-label tuna co-manufacturer


Recent News & Developments


Canned Tuna Market Report Scope

Parameter Detail
Market Scope Global Canned Tuna Market — production, trade, and consumption of canned and pouched tuna products
Study Period 2021–2035
CAGR 5.40% (2026–2035)
Base Year Market Size USD 16.07 Billion (2025)
Forecast Endpoint USD 27.48 Billion (2035)
Fastest Growing Segment White Tuna (by product type); On-Trade (by distribution)
Fastest Growing Region Middle East & Africa
Companies Profiled Thai Union Group, Bolton Group, Bumble Bee Foods, Dongwon Industries, Grupo Calvo, Wild Planet Foods, Century Pacific Food, Princes Group, StarKist, Jealsa Rianxeira
Valuation Currency USD Billion


FAQs

What minimum order volumes do major canners require for private-label contracts?

Most Tier-1 co-manufacturers — Jealsa, Thai Union, and Century Pacific — set minimum orders at 1–2 full container loads (roughly 20–40 metric tons). Smaller processors may accept half-container lots at a 5–8% price premium [19].

How does pole-and-line caught tuna pricing compare with purse-seine product?

Pole-and-line skipjack typically trades at a 15–25% premium over purse-seine skipjack at the processor gate. The differential narrows for albacore tuna, where catch-method price gaps average 10–15% [6].

Which certifications carry the most retail shelf-placement weight in Europe?

MSC and Friend of the Sea are the two certifications most frequently mandated by EU retailers. Chains like Carrefour and Tesco require at least one of these labels for branded canned tuna listings [6].

How are tariff structures affecting cross-regional canned tuna trade flows?

EU GSP+ preferences give Ecuador and the Philippines duty-free access, while Thai exports face a 24% tariff. This disparity has shifted European import sourcing toward South American and ASEAN GSP+ beneficiaries [14].

What shelf-life advantages do retort pouches offer over traditional metal cans for the Canned Tuna Market?

Retort pouches deliver 24–36 months of shelf life versus 48–60 months for metal cans. Pouches compensate with 40% weight reduction and faster thermal processing, cutting energy costs per unit by roughly 12% [5].

How is the Canned Tuna Market affected by RFMO catch-quota decisions?

Regional Fisheries Management Organization quotas directly cap raw material availability. The WCPFC's 2024 skipjack purse seine effort limit capped tropical catch at approximately 1.6 million metric tons, constraining volume expansion for processors reliant on Western Pacific sourcing [14].

What role does the Canned Tuna Market play within broader emergency food-reserve programs?

Governments in Japan, South Korea, and several Gulf states include canned tuna in strategic food reserves due to its long shelf life. Japan's Ministry of Agriculture maintains roughly 15,000 metric tons of canned seafood in rolling stockpile reserves [21].


FAQs

What is the projected market valuation of the canned tuna market by 2035?

The projected market valuation of the canned tuna market is expected to reach 39.82 USD Million by 2035.

What was the overall market valuation of the canned tuna market in 2024?

The overall market valuation of the canned tuna market was 22.4 USD Million in 2024.

What is the expected CAGR for the canned tuna market during the forecast period 2025 - 2035?

The expected CAGR for the canned tuna market during the forecast period 2025 - 2035 is 5.33%.

Which product type generated the highest revenue in the canned tuna market?

Chunk Light Tuna generated the highest revenue, with valuations ranging from 8.96 to 15.92 USD Million.

What are the leading companies in the canned tuna market?

Key players in the canned tuna market include Thai Union Group, Bumble Bee Foods, and Starkist Co.

How does the revenue from canned tuna compare to other packaging types?

Canned tuna generated revenue of 10.0 to 18.0 USD Million, outperforming pouch and jar packaging types.

What distribution channel shows the highest revenue for canned tuna?

Supermarkets show the highest revenue for canned tuna, with figures between 10.0 and 18.0 USD Million.

What is the revenue range for the food service segment in the canned tuna market?

The food service segment in the canned tuna market has a revenue range of 7.0 to 12.0 USD Million.

Which flavor profile of canned tuna is projected to perform well?

Natural flavor profiles are projected to perform well, with revenue estimates between 8.96 and 15.84 USD Million.

What is the revenue range for the catering segment in the canned tuna market?

The catering segment in the canned tuna market has a revenue range of 5.4 to 9.82 USD Million.
Author
Author
Author Profile
Snehal Singh LinkedIn
Manager - Research
High acumen in analyzing complex macro & micro markets with more than 6 years of work experience in the field of market research. By implementing her analytical skills in forecasting and estimation into market research reports, she has expertise in Packaging, Construction, and Equipment domains. She handles a team size of 20-25 resources and ensures smooth running of the projects, associated marketing activities, and client servicing.

Research Approach


Secondary Research

The secondary research process involved comprehensive analysis of fisheries management databases, trade statistics, regulatory frameworks, food safety standards, and industry publications. Key sources included the US National Oceanic and Atmospheric Administration (NOAA) Fisheries, US Food & Drug Administration (FDA), Food and Agriculture Organization of the United Nations (FAO) - GLOBEFISH, Inter-American Tropical Tuna Commission (IATTC), International Commission for the Conservation of Atlantic Tunas (ICCAT), Western and Central Pacific Fisheries Commission (WCPFC), European Commission Directorate-General for Maritime Affairs and Fisheries (DG MARE), European Food Safety Authority (EFSA), National Fisheries Institute (NFI), International Seafood Sustainability Foundation (ISSF), Marine Stewardship Council (MSC), UN Comtrade Database, World Customs Organization (WCO) Harmonized System trade data, Atuna Market Intelligence, and national statistics offices of major tuna processing nations (Thailand, Indonesia, Philippines, Ecuador, Spain). These sources were used to collect catch volume statistics, trade flow data, RFMO quota regulations, mercury level compliance standards, sustainability certification metrics, and import/export tariff structures for skipjack, yellowfin, albacore, and other tuna species across retail and foodservice channels.


Primary Research

In the primary research process, supply-side and demand-side stakeholders were interviewed to obtain qualitative and quantitative insights. Supply-side sources included CEOs, VPs of Global Procurement, Fleet Operations Directors, Sustainability Officers, and Regulatory Affairs Heads from tuna canning conglomerates, purse seine fleet operators, and aquaculture processors. Demand-side sources comprised Category Managers from supermarket/hypermarket chains, Convenience Store procurement leads, Foodservice distribution buyers, E-commerce platform grocery directors, and Private Label development managers from mass merchandisers and discount retail channels. Primary research validated species-specific segmentation, confirmed sustainability certification adoption timelines, and gathered insights on catch-to-can pricing dynamics, shelf-space optimization strategies, and private label versus branded product penetration across distribution channels.

Primary Respondent Breakdown:

• By Designation: C-level Primaries (28%), Director Level (40%), Others (32%)

• By Region: North America (28%), Europe (35%), Asia-Pacific (30%), Rest of World (7%)


Market Size Estimation

Global market valuation was derived through revenue mapping and catch volume to retail price analysis. The methodology included:

• Identification of 50+ key processors and canners across Thailand, Indonesia, Philippines, Ecuador, Spain, United States, and Japan

• Product mapping across skipjack tuna (chunk light), albacore tuna (white/solid), yellowfin tuna, and bigeye formulations

• Analysis of reported and modeled annual revenues specific to canned tuna portfolios, including branded and private label manufacturing

• Coverage of processors representing 75-80% of global canned tuna market share in 2024

• Extrapolation using bottom-up (global catch volume × conversion rates to canned product × ex-vessel and retail ASP by country/region) and top-down (manufacturer revenue validation against trade database imports) approaches to derive segment-specific valuations for water-packed, oil-packed, and flavored variants

Download Free Sample

Kindly complete the form below to receive a free sample of this Report

Download PDF ×

We do not share your information with anyone. However, we may send you emails based on your report interest from time to time. You may contact us at any time to opt-out.