Car Insurance Market (2026 - 2035)

Car Insurance Market Size, Share and Research Report By Coverage Type (Bodily Injury Liability, Property Damage Liability, Collision, Comprehensive, Uninsured Motorist), By Distribution Channel (Independent Agents, Captive Agents, Online Platforms, Direct Insurers), By Vehicle Type (Passenger Cars, Commercial Vehicles (Trucks, Vans, Buses), Motorcycles, RVs (Recreational Vehicles)) and By Regional (North America, Europe, South America, Asia Pacific, Middle East and Africa) - Industry Forecast Till 2035
ID: MRFR/BS/20976-HCR
200 Pages
Ankit Gupta
Last Updated: June 22, 2026
Car Insurance Market
Market Size
Forecast Period2026-2035
CAGR (2026-2035)5.6%
2021 Market Size2150.0 USD Billion
2022 Market Size2271.0 USD Billion
Key Players
State Farm Mutual
Berkshire Hathaway
Progressive Corporation
Allstate Corporation
Liberty Mutual Group
Allianz SE
Opportunities
  • EV-Specialized Insurance Products
  • Embedded Insurance at Point of Vehicle Purchase
  • Emerging-Market Motorization

Car Insurance Market Summary

The global car insurance market reached an estimated USD 2,150 billion in premium value during 2025 and is projected to grow from USD 2,271 billion in 2026 to approximately USD 3,710 billion by 2035, registering a compound annual growth rate of 5.6% across the forecast window. Mandatory liability requirements continue to expand — at least nine US states tightened statutory minimum coverage limits between 2023 and 2025, while India's Motor Vehicles Amendment Rules raised third-party liability floors by 22% [1]. These regulatory ratchets convert directly into gross written premium gains and show no sign of reversing.

A sweeping digital overhaul is reshaping how policies are priced, sold, and serviced. Legacy broker-dependent distribution is giving ground to direct-to-consumer platforms that underwrite and bind coverage in minutes. Insurers collectively invested an estimated USD 18 billion in claims automation and digital underwriting infrastructure between 2022 and 2024, according to Global Insurance Report data [2]. Climate-driven insured losses, which surpassed USD 140 billion globally in 2024, are simultaneously hardening rates and encouraging parametric product innovation.

North America commands the largest share of the car insurance market at roughly 38% of 2025 premiums, underpinned by the world's highest average policy prices. Asia-Pacific is the fastest-growing region, expanding at an estimated 7.1% CAGR through 2035 as vehicle penetration surges in India, Indonesia, and Vietnam. Europe holds the second-largest position with approximately 27% of global premiums, driven by the EU Motor Insurance Directive revision and growing BEV adoption. The next decade will test which carriers can pair underwriting discipline with technology-led distribution at scale.


Key Report Takeaways

• By Coverage

  • Own damage coverage accounted for 62.2% of the car insurance market share in 2025, reflecting consumer preference for comprehensive protection in high-repair-cost environments.
  • Ancillary and add-on coverages are projected to record the fastest growth at an 8.5% CAGR through 2035 as cyber-liability riders and roadside-assistance bundles gain traction.

• By Powertrain

  • Internal combustion engine vehicles represented 77.3% of premiums within the car insurance market in 2025.
  • Battery electric vehicle insurance is forecast to expand at a 13.5% CAGR through 2035, propelled by rising EV registrations and higher average insured values.

• By Distribution Channel

  • Intermediated channels — agents, brokers, and bancassurance — captured an estimated 62.8% of car insurance market premiums in 2025.
  • Embedded, affinity, and partnership distribution models are advancing at a 9.6% CAGR through 2035.

• By Region

  • North America held the dominant position in the car insurance market, representing approximately 38% of 2025 premiums.
  • Asia-Pacific is projected to grow at a 7.1% CAGR, making it the fastest-growing region through 2035.


Car Insurance Market Size and Forecast (2021–2035)

Market Research Future derives historical estimates from disclosed gross written premium filings, national regulatory submissions, and verified industry databases. Forecast projections apply a proprietary model that weights mandatory-coverage expansion, claims inflation indices, vehicle parc growth, and digitalization adoption curves against macroeconomic baselines.
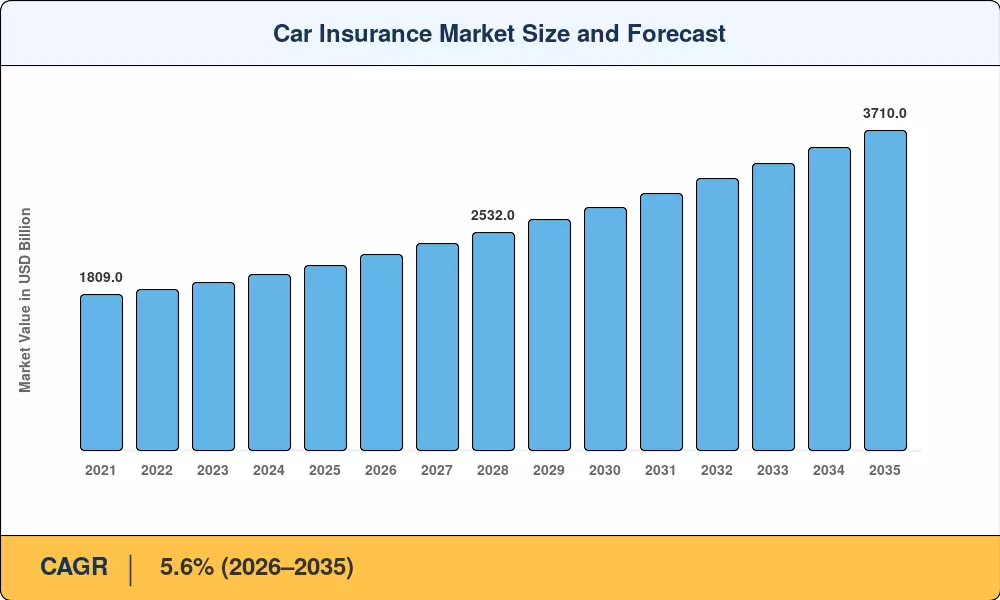
Car Insurance Market Size and Forecast
Our Impact
Enabled $4.3B Revenue Impact for Fortune 500 and Leading Multinationals
Partnering with 2000+ Global Organizations Each Year
30K+ Citations by Top-Tier Firms in the Industry

Driver Impact Analysis

Driver ~% Impact on CAGR Geographic Relevance Impact Timeline
Mandatory liability coverage expansion +1.2% Global Short-term (≤2 yr)
Claims inflation and repair cost escalation +0.9% North America, Europe Medium-term (2–4 yr)
Digital DTC platform adoption +0.8% North America, Asia-Pacific Medium-term (2–4 yr)
EV fleet growth and higher insured values +0.7% Europe, China Long-term (≥4 yr)
Climate-driven catastrophe loss frequency +0.6% Global Long-term (≥4 yr)
Telematics and behavior-based pricing +0.5% North America, Europe Medium-term (2–4 yr)
Emerging-market motorization +0.4% Asia-Pacific, South America Long-term (≥4 yr)


Mandatory Liability Coverage Expansion

Governments are steadily raising the financial bar for vehicle owners. In the United States, the National Association of Insurance Commissioners reported that six states enacted higher minimum-liability thresholds between 2023 and 2025. India's Motor Vehicles Amendment Rules, effective from April 2024, increased third-party premium floors by 22% for private passenger vehicles. These statutory actions create inelastic demand that flows directly into premium volume regardless of competitive dynamics within the car insurance market.

Claims Inflation and Repair Cost Escalation

The average U.S. auto physical-damage claim in 2024 reached USD 4,800, a 31% rise compared to 2020 levels, driven by the need for replacement of calibrated sensors on ADAS-laden vehicles [4], according to data from CCC Intelligent Solutions. Advanced driver-assistance hardware adds $1,200 to $3,500 per repair event vs. standard bodywork. Allianz’s annual loss report, while typical German motor claims expenses rose by 19% during the same time, the same is true for European markets. These constraints on the structure of costs are prompting rate rises and supporting premium growth in the vehicle insurance industry, even in mature, zero-growth parc conditions.


Digital DTC Platform Adoption

Direct-to-consumer platforms grew their share of new-policy originations from 18% to 27% globally between 2021 and 2024, according to [6]. These platforms compress quote-to-bind cycles to under three minutes, attracting younger demographics that prize transparency and mobile-first design. Progressive's online-channel premiums rose 24% year over year in 2024. The efficiency gains lower acquisition costs by 15–20% relative to agent channels, enabling reinvestment in pricing competitiveness and fueling further concentration within the car insurance market.

EV Fleet Growth and Higher Insured Values

According to BloombergNEF, worldwide electric car sales are expected to reach 20 million units in 2026, and the average insured value of a battery electric vehicle is 35–40% higher than its ICE equivalent [7]. The battery pack alone costs more than USD 15,000 to replace. This higher risk profile translates into a higher premium per policy, which results in a structural uplift in the premium pool of the vehicle insurance market, despite similar accident frequency across powertrain types.


Restraints Impact Analysis

The restraint impacts below are directional headwinds and do not net algebraically against the drivers listed in Section 4. They represent forces that moderate growth but are insufficient to reverse the positive trajectory of the car insurance market.

Restraint ~% Impact on CAGR Geographic Relevance Impact Timeline
ADAS/AV technology reducing accident frequency –0.5% North America, Europe Long-term (≥4 yr)
Regulatory rate caps and price controls –0.4% Asia-Pacific, South America Medium-term (2–4 yr)
Ride-sharing and declining vehicle ownership –0.3% Urban centers globally Long-term (≥4 yr)
Rising fraud and litigation costs –0.3% North America Short-term (≤2 yr)
Data privacy regulation constraining telematics –0.2% Europe Medium-term (2–4 yr)


ADAS and Autonomous Technology Frequency Reduction

As these systems achieve saturation in new vehicles — projected to equip 85% of new cars sold in the US by 2030 — the resulting accident-frequency decline will exert sustained downward pressure on pure-risk premiums. However, this headwind is partially offset by the higher severity of ADAS-related repair costs, which tempers net premium erosion within the car insurance market.

Regulatory Rate Caps and Price Controls

Many high-growth markets have regulatory caps on premium rates. Third-party tariffs in India, mandated by the Insurance Regulatory and Development Authority of India (IRDAI), restrict the pricing freedom of underwriters, and China’s sweeping vehicle insurance reform in 2020 decreased average premiums by about 22% [11]. Brazil’s Superintendência de Seguros Privados has imposed similar limitations. Such rate-compression regimes inhibit an increase in revenues in the auto insurance industry, even when claim volumes climb.


Ride-Sharing and Declining Vehicle Ownership

Each vehicle removed from the personal-use fleet eliminates a corresponding insurance policy, creating a slow but measurable drag on policy count growth within the car insurance market in mature urban zones.


Car Insurance Market Opportunities

EV-Specialized Insurance Products

Battery electric vehicles require bespoke policy structures covering battery degradation, thermal runaway, and home-charging liability. Carriers that bundle usage-based pay-per-mile car insurance with EV-specific riders can capture both the premium uplift from higher insured values and the loyalty of an expanding buyer segment.

Embedded Insurance at Point of Vehicle Purchase

OEM collaborations that include coverage in vehicle finance are a fundamental shift in distribution. Tesla’s proprietary insurance scheme, available in twelve US states, showed 30% lower acquisition costs than standard agency channels [15]. That concept may be applied to mainstream OEMs and EV start-ups, which would change the way consumers access the car insurance market and reduce the role of legacy intermediaries.


Emerging-Market Motorization

Vehicle penetration in India stands at approximately 35 cars per 1,000 people versus 760 in the United States [9]. Indonesia and Vietnam are below 100. As incomes rise and mandatory insurance enforcement tightens, these markets represent the largest untapped volume opportunity for the car insurance market over the next decade. Micro-insurance models priced below USD 50 annually are proving viable in India's tier-two cities.

Data Monetization and Risk Analytics

Insurers sit on vast troves of claims, telematics, and driver-behavior data. Monetizing these datasets through anonymized risk-scoring APIs for fleet operators, municipal planners, and autonomous-vehicle developers creates a non-underwriting revenue stream. Carriers that invest in analytics infrastructure position themselves for margin expansion beyond the traditional car insurance market underwriting cycle.

Parametric and Climate-Risk Products

Rising hail, flood, and wildfire frequency has outpaced traditional indemnity models in catastrophe-prone US states [5]. This product innovation opens new premium categories and strengthens the resilience of the car insurance market against climate volatility.


Car Insurance Market Future Outlook

Autonomous Vehicle Insurance Architecture

Autonomous vehicles will turn the liability model upside down – moving risk from the driver to the manufacturer and software supplier. The UK’s Automated Vehicles Act and equivalent EU frameworks will demand product-liability coverage at the OEM level by 2032, generating a parallel premium stream inside the automobile insurance market that bypasses traditional retail distribution totally [10].


Platform Economics and Consolidation

Scale advantages in data, pricing algorithms, and digital distribution are concentrating the car insurance market. this share is projected to reach 33% by 2030 as mid-tier underwriters lacking technology investment are acquired or forced into niche roles. API-driven platforms that aggregate multiple carriers will reshape price discovery for consumers.

Electrification Premium Supercycle

Each BEV carries a higher average insured value than its ICE predecessor. This structural shift means the car insurance market's premium pool grows faster than the underlying vehicle parc, as per-unit premiums for EVs run 25–40% above comparable ICE models. Carriers with early EV underwriting expertise will disproportionately capture this premium migration.

ESG Reporting and Sustainable Underwriting

Regulators and investors increasingly scrutinize insurers' climate-risk exposure. The ISSB's IFRS S2 standards, effective from 2025, require motor portfolios to disclose physical and transition climate risks [21]. Carriers that integrate ESG scoring into underwriting and claims can attract sustainability-conscious capital while managing tail-risk exposure within the car insurance market.


Car Insurance Market Segmentation

By Coverage

Segment Key Metric Primary Demand Driver
Third-Party Liability 4.8% CAGR (2026–2035) Statutory mandate tightening
Own Damage 62.2% share (2025) Consumer preference for comprehensive cover
Ancillary / Add-on 8.5% CAGR (2026–2035) Cyber-liability and roadside bundles


Own damage coverage dominates the car insurance market's coverage mix, reflecting vehicle owners' willingness to pay for full protection against collision, theft, and natural-disaster losses. Average own-damage premiums range from USD 600 in India to USD 1,800 in the United States. As vehicle repair costs climb — driven by ADAS sensor calibration and aluminum unibody construction — own-damage premium rates continue to harden.

Ancillary coverages represent the most dynamic growth vector. Zero-depreciation endorsements, engine-protect riders, and return-to-invoice add-ons collectively added an estimated USD 38 billion to the global car insurance market in 2024. Carriers that design modular add-on menus tailored to customer risk profiles are capturing incremental wallet share without triggering price-sensitivity resistance.

By Powertrain

Segment Key Metric Primary Demand Driver
Internal Combustion Engine (ICE) 77.3% share (2025) Dominant global vehicle parc
Hybrid USD 305 Billion (2025) Transitional fleet growth
Battery Electric Vehicle (BEV) 13.5% CAGR (2026–2035) Rising EV registrations and higher insured values


ICE vehicles still compose the overwhelming majority of the insured fleet, and their premium contribution to the car insurance market will remain dominant through at least 2030. Repair-cost inflation for ICE models with increasingly complex electronics is sustaining per-policy premium growth even as the parc matures.

BEV insurance is the segment's standout growth story. Battery replacement costs exceeding USD 15,000, limited repair-shop capacity for high-voltage systems, and elevated theft risk for catalytic-converter-free vehicles create a distinct actuarial profile. Specialist BEV carriers and dedicated OEM programs are carving a rapidly expanding niche within the broader car insurance market.

By Distribution Channel

Segment Key Metric Primary Demand Driver
Direct-to-Consumer (DTC) 6.7% CAGR (2026–2035) Mobile-first buyer demographics
Intermediated (Agents, Brokers, Bancassurance) 62.8% share (2025) Advisory value for complex policies
Embedded, Affinity & Partnership 9.6% CAGR (2026–2035) OEM and fintech integration


Intermediated channels retain the lion's share of the car insurance market because agent advice remains valued for high-premium comprehensive policies and commercial fleet accounts. Bancassurance is particularly strong across Europe and Asia-Pacific, where lenders bundle motor coverage into vehicle-financing packages.

Embedded and partnership models represent the fastest-evolving distribution architecture. Automakers, ride-hailing platforms, and digital-finance super-apps are originating policies at the point of vehicle transaction, reducing friction and acquisition costs. This channel is forecast to nearly double its share of the car insurance market by 2035 as API integration matures.


Regional Market Share Analysis

Region Key Metric Primary Investment Themes
North America ~38% of 2025 premiums Rate adequacy, DTC platforms, litigation reform
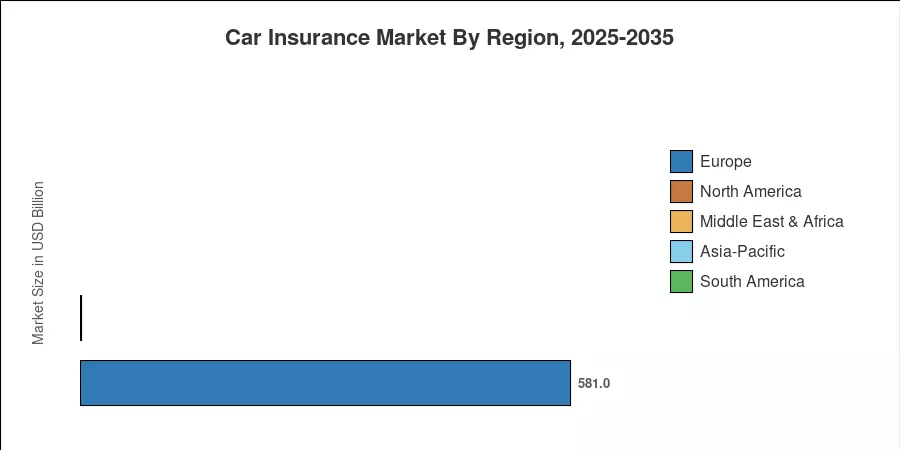
Europe USD 581 Billion (2025) Motor Directive revision, BEV coverage
Asia-Pacific 7.1% CAGR (2026–2035) Motorization, digital distribution, micro-insurance
South America ~6% of 2025 premiums Mandatory coverage enforcement, fintech insurers
Middle East & Africa 6.8% CAGR (2026–2035) Compulsory third-party expansion, Takaful growth
Total USD 2,150 Billion (2025)

The car insurance market's regional structure reflects each region's vehicle parc maturity, regulatory strictness, and insurance penetration rate. North America leads in absolute premium value; Asia-Pacific dominates growth.


North America

Country Key Metric Key Driver
United States ~82% of regional premiums Statutory minimums, litigation costs
Canada 5.1% CAGR (2026–2035) Provincial rate reform
Mexico USD 18 Billion (2025) Mandatory coverage enforcement


The US dominates the North American car insurance market, accounting for the vast majority of regional premiums. Rising severity costs, social inflation in personal-injury litigation, and expanding minimum-liability mandates in states such as Florida and Virginia are the principal premium drivers. Canada's provincial regulators are easing rate caps in Alberta and Ontario, encouraging competitive pricing and volume growth [17].

Europe

Country Key Metric Key Driver
Germany ~19% of regional premiums BEV fleet growth
United Kingdom 5.4% CAGR (2026–2035) FCA pricing reform
France USD 68 Billion (2025) Claims inflation
Italy 4.6% CAGR (2026–2035) Anti-fraud digitization
Spain ~7% of regional premiums Tourism-driven fleet expansion
Nordic Countries 4.9% CAGR (2026–2035) Telematics penetration
Russia USD 21 Billion (2025) Mandatory OSAGO reforms
Rest of Europe ~14% of regional premiums EU Motor Insurance Directive


Europe's car insurance market is being reshaped by the 2024 revision to the EU Motor Insurance Directive, which extends mandatory coverage to autonomous-mode operation. Germany's BEV registrations surpassed 1.4 million cumulative units in 2024, creating a premium-density uplift of 35% per policy compared with ICE equivalents [18]. The UK's FCA general insurance pricing reform, which banned the loyalty-penalty practice, initially compressed premiums but is now stabilizing.

Asia-Pacific

Country Key Metric Key Driver
China ~46% of regional premiums Comprehensive reform repricing
India 8.3% CAGR (2026–2035) Motorization and IRDAI mandates
Japan USD 52 Billion (2025) Aging-driver risk pricing
South Korea 5.8% CAGR (2026–2035) Digital insurer competition
ASEAN 7.9% CAGR (2026–2035) Rising vehicle penetration
Rest of Asia-Pacific ~8% of regional premiums Infrastructure and fleet expansion


Asia-Pacific is the fastest-growing region in the global car insurance market. China remains the region's anchor, though the 2020 comprehensive auto reform compressed premiums by roughly 22%; subsequent claims-ratio normalization is restoring growth. India added 4.2 million new vehicles to its registered parc in FY2024, and IRDAI's push toward universal motor third-party compliance is narrowing the uninsured gap [9].

South America

Country Key Metric Key Driver
Brazil ~61% of regional premiums Fleet expansion, mandatory DPVAT
Argentina 6.2% CAGR (2026–2035) Inflation-indexed premium growth
Rest of South America ~15% of regional premiums Regulatory formalization


Brazil anchors the South American car insurance market, with Superintendência de Seguros Privados data showing gross written premiums exceeding USD 78 billion in 2024. Digital insurtechs such as Youse and Minuto Seguros are expanding access in underserved northeastern states, increasing penetration from a low regional base [19].

Middle East & Africa

Country Key Metric Key Driver
Saudi Arabia ~28% of regional premiums Vision 2030 motor mandates
UAE 5.9% CAGR (2026–2035) Fleet growth and digital platforms
South Africa USD 14 Billion (2025) Compulsory third-party strengthening
Egypt 7.4% CAGR (2026–2035) New vehicle financing growth
Rest of MEA ~30% of regional premiums Takaful expansion


Saudi Arabia's Najm and unified motor-policy platform have digitized claims settlement across the Kingdom, reducing cycle times by 60% since 2021 [20]. The UAE's car insurance market benefits from a young, vehicle-dense population and mandatory comprehensive coverage for financed vehicles.


Car Insurance Market By Region, 2025-2035

Competitive Benchmarking

The global car insurance market exhibits medium concentration. The top five carriers hold an estimated 18–22% of worldwide premiums, while the top twenty account for roughly 35%. Regional concentration is considerably higher — State Farm and GEICO together control approximately 30% of the US personal-auto market. Competition increasingly pivots on digital capabilities, claims-processing speed, and telematics pricing sophistication rather than solely on brand or distribution breadth.

Company Est. Revenue Share Range Key Offerings Strategic Positioning
State Farm Mutual ~7–10% Personal auto, multi-line bundling Largest US personal-lines carrier, agent-led distribution
Berkshire Hathaway (GEICO) ~6–8% Direct auto, usage-based pricing Low-cost DTC leader, advertising scale advantage
Progressive Corporation ~5–7% Snapshot telematics, commercial auto Telematics pioneer, multi-channel pricing
Allstate Corporation ~4–6% Drivewise, bundled home-auto Digital transformation, Arity data subsidiary
Liberty Mutual Group ~3–5% Global commercial, personal auto International diversification, reinsurance arm
Allianz SE ~3–5% Motor, fleet, BEV coverage European leader, integrated asset management
AXA Group ~3–4% Motor, parametric, embedded Strong bancassurance partnerships globally
Zurich Insurance Group ~2–4% Commercial motor, fleet risk Corporate-fleet specialization, ESG integration
Ping An Insurance Group ~3–5% Digital auto, OneConnect platform China's largest insurer, AI-driven claims
Tokio Marine Holdings ~2–3% Personal auto, specialty lines Japan's largest P&C carrier, global M&A strategy


Recent News & Developments

  • Progressive Corporation (December 2025): Reported exceptional personal lines policy growth, capping the fiscal year with direct auto policies in force expanding 14% year-over-year to 15.99 million, powered by its usage-based insurance analytics and proactive rate management.
  • Tesla Insurance (December 2024): Continued managing its real-time behavior-based auto insurance product across 12 US states, leveraging proprietary vehicle telematics and Safety Score versions to dynamically calculate monthly premiums directly from driving performance data.
  • Allianz SE (December 2024): Formally withdrew its proposed $1.6 billion cash offer to acquire a 51% majority stake in Singapore’s Income Insurance after the Singapore government raised structural regulatory concerns regarding the preservation of the insurer's social mission.


  • UK Financial Conduct Authority (December 2022): Published its two-year review of general insurance pricing reforms, finding that the loyalty-penalty ban reduced renewal overcharging by 30% while increasing market switching rates by 18% [17].


Car Insurance Market Report Scope

Parameter Detail
Market Scope Global car insurance market, measured by gross written premium value
Study Period 2021–2035
CAGR 5.6% (2026–2035)
Base Year 2025 — USD 2,150 Billion
Forecast Endpoint 2035 — USD 3,710 Billion
Fastest Growing Segments BEV insurance (by powertrain); Ancillary/Add-on (by coverage)
Companies Profiled 10 (see Section 10)
Valuation Currency USD Billion


FAQs

How does telematics data quality affect premium accuracy in the car insurance market?
Telematics accuracy depends on OBD-II device calibration and smartphone-sensor fidelity, with GPS drift introducing 5–8% variance in mileage-based pricing [8]. Carriers mitigate this through multi-sensor fusion algorithms.
What integration challenges do legacy carriers face when adopting real-time pricing engines?
Most incumbents run decades-old policy-administration systems that lack API connectivity. Middleware replacement projects typically require 18–24 months and USD 50–120 million in implementation spend [2].
How do reinsurance costs influence retail premium pricing in the car insurance market?
Catastrophe reinsurance renewals rose 25–30% in 2024, and primary carriers pass roughly 60% of that increase through to retail motor rates [5]. This transmission lag typically spans two renewal cycles.
What role do credit-score-based pricing models play in the car insurance market?
Credit-based insurance scores are permitted in 46 US states. Several states enforce total bans on credit metrics for auto lines, which could raise average premiums by 8–12%.
How are fleet operators negotiating coverage differently from individual policyholders?
Fleet accounts leverage volume discounts averaging 15–25% below retail rates and increasingly demand real-time risk dashboards tied to telematics feeds [16]. Self-insured retentions above USD 250,000 are becoming standard for large fleets.
What cybersecurity exposures arise from connected-vehicle insurance in the car insurance market?
Vehicle-to-everything communication opens attack surfaces for spoofing and ransomware, creating liability gaps most standard motor policies do not cover [14]. Dedicated cyber endorsements are emerging but remain under 5% of policies sold.
How might central-bank interest-rate cycles affect insurer profitability in the car insurance market?
Investment income on float constitutes 15–20% of the combined profit for motor-focused carriers. A 200-basis-point rate decline compresses this margin and pressures underwriting discipline [3].    
Author
Author
Author Profile
Ankit Gupta LinkedIn
Team Lead - Research
Ankit Gupta is a seasoned market intelligence and strategic research professional with over six plus years of experience in the ICT and Semiconductor industries. With academic roots in Telecom, Marketing, and Electronics, he blends technical insight with business strategy. Ankit has led 200+ projects, including work for Fortune 500 clients like Microsoft and Rio Tinto, covering market sizing, tech forecasting, and go-to-market strategies. Known for bridging engineering and enterprise decision-making, his insights support growth, innovation, and investment planning across diverse technology markets.
Download Free Sample

Kindly complete the form below to receive a free sample of this Report

Download PDF ×

We do not share your information with anyone. However, we may send you emails based on your report interest from time to time. You may contact us at any time to opt-out.
















