Segmentation Quick Reference
| Dimension | Sub-Segments | Dominant Segment | Fastest Growing Segment |
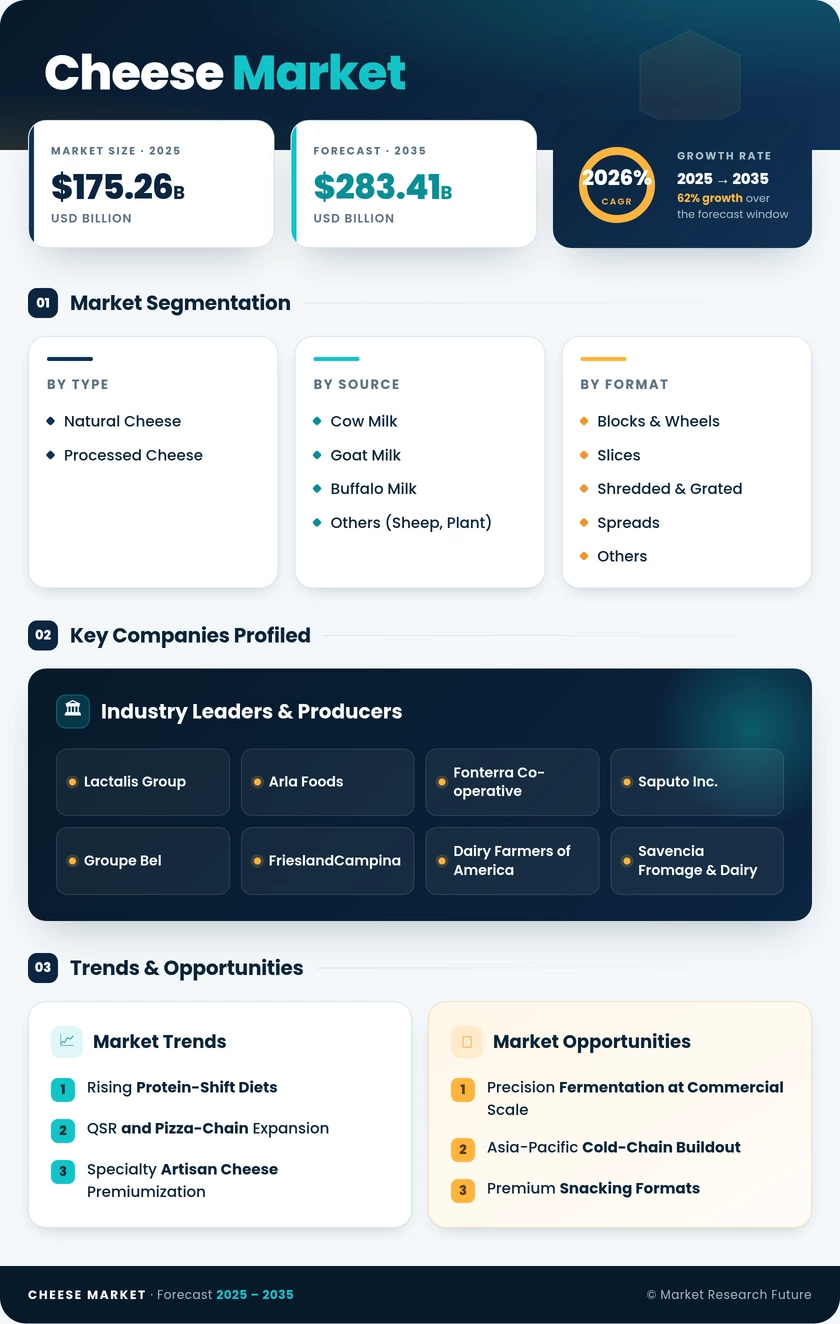
| Product Type | Natural Cheese, Processed Cheese | Natural Cheese | Processed Cheese |
| Milk Source | Cow, Goat, Buffalo, Others | Cow Milk | Others (Sheep, Plant-Based) |
| Format | Blocks & Wheels, Slices, Shredded & Grated, Spreads, Others | Blocks & Wheels | Slices |
| Distribution Channel | Retail, Foodservice (HoReCa) | Retail | Foodservice (HoReCa) |
| Geography | North America, Europe, Asia-Pacific, South America, Middle East & Africa | Europe | Asia-Pacific |
Market Segmentation Overview
By Product Type
| Sub-Segment | Key Trend |
| Natural Cheese | Clean-label demand and premiumization of aged, cave-ripened, and PDO-certified varieties |
| Processed Cheese | Convenience-driven growth through slices, spreads, and single-serve snack portions for QSR and retail |
Natural cheese continues to anchor global consumption through deep cultural roots in European and North American diets, while processed cheese expands its reach through cost-efficient formats tailored to fast-growing foodservice channels in Asia-Pacific and the Middle East.
By Milk Source
| Sub-Segment | Key Trend |
| Cow Milk | Scale economics and established supply chains maintain dominant position globally |
| Goat Milk | Rising awareness of digestibility benefits supports premium artisan positioning |
| Buffalo Milk | Traditional strength in Italian mozzarella and South Asian dairy markets |
| Others (Sheep, Plant-Based) | Niche premiumization and rapid plant-based innovation driving fastest growth |
Cow milk remains the industry backbone, but diversification across milk sources reflects shifting consumer preferences toward digestibility, sustainability, and novel taste profiles.
By Format
| Sub-Segment | Key Trend |
| Blocks & Wheels | Heritage formats sustaining value share through specialty and deli retail channels |
| Slices | Portion-control and labor savings driving adoption in QSR and institutional foodservice |
| Shredded & Grated | Home-cooking convenience and pizza-topping demand maintaining strong volume |
| Spreads | Breakfast and snacking occasions expanding addressable consumption moments |
| Others | Baked cheese snacks and novel formats capturing health-conscious snacking demand |
Format innovation remains a primary lever for market expansion, with sliced and shredded formats leading growth as foodservice operators prioritize consistency and efficiency.
By Distribution Channel
| Sub-Segment | Key Trend |
| Retail | Hypermarket assortment depth, private-label programs, and e-grocery expansion sustaining dominance |
| Foodservice (HoReCa) | Pizza-chain proliferation, experiential dining, and institutional procurement driving fastest growth |
Retail holds the majority share, but the structural shift toward out-of-home eating and QSR expansion in emerging economies positions foodservice as the primary growth vector through 2035.
By Geography
| Sub-Segment | Key Trend |
| North America | Mature per-capita consumption; premiumization and plant-based innovation driving value growth |
| Europe | PDO heritage, sustainability mandates, and Eastern European expansion sustaining market leadership |
| Asia-Pacific | Low per-capita base, rapid urbanization, and cold-chain investment fueling fastest growth globally |
| South America | Brazilian dominance; mozzarella and pizza-driven demand anchoring regional trajectory |
| Middle East & Africa | Halal certification, food security investment, and urbanization creating emerging-market opportunities |
Regional dynamics reflect a dual reality: mature Western markets pursuing value through premiumization and innovation, while emerging regions expand volume through infrastructure development and dietary shifts.