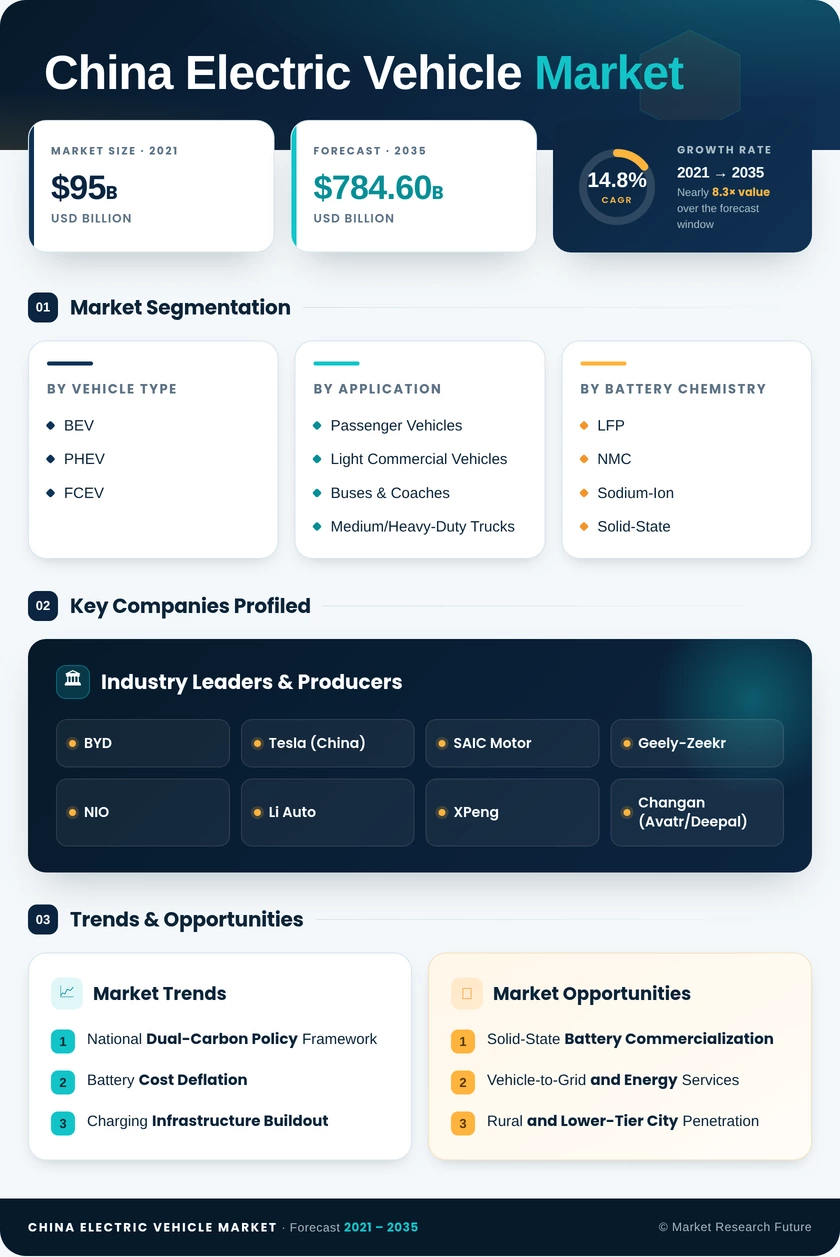
China Electric Vehicle Market (2026 - 2035)

ID: MRFR/AT/19953-HCR
128 Pages
Triveni Bhoyar
Last Updated: June 29, 2026
China Electric Vehicle Market Size, Share & Growth Analysis Report By Vehicle Type (Battery Electric Vehicle (BEV), Plug-in Hybrid Electric Vehicle (PHEV), Fuel Cell Electric Vehicle (FCEV)), By Application (Passenger Vehicles, Light Commercial Vehicles, Buses and Coaches, Medium/Heavy-Duty Trucks), By Battery Chemistry (Lithium Iron Phosphate (LFP), Nickel Manganese Cobalt (NMC), Sodium-Ion (Na-ion), Solid-State (Emerging)) and By Regional (North America, Europe, South America, Asia Pacific, Middle East and Africa) – Industry Growth & Forecast to 2035
China Electric Vehicle Market
Market Size
Forecast Period2026-2035
CAGR (2026-2035)14.8%
2025 Market SizeUSD 197.3 Billion
2035 Market SizeUSD 784.6 Billion
Key Players
BYD
Tesla
SAIC Motor
Geely-Zeekr
NIO
Li Auto
Opportunities
  • Solid-State Battery Commercialization
  • Vehicle-to-Grid and Energy Services
  • Rural and Lower-Tier City Penetration
  1. 1 Market Overview |
    1. 1.1 Study Assumptions & Market Definition |
    2. 1.2 Scope of the Study |
    3. 1.3 Research Methodology
  2. 2 Market Summary & Key Takeaways
  3. 3 Market Dynamics |
    1. 3.1 Market Drivers Analysis | |
      1. 3.1.1 National Dual-Carbon Policy Framework | |
      2. 3.1.2 Battery Cost Deflation Below USD 80/kWh | |
      3. 3.1.3 Charging Infrastructure Expansion Mandate | |
      4. 3.1.4 Provincial License-Plate & Purchase-Tax Incentives | |
      5. 3.1.5 Export Growth to Southeast Asia and Europe | |
      6. 3.1.6 Autonomous Driving Software Monetization | |
      7. 3.1.7 Fleet Electrification Mandates for Logistics |
    2. 3.2 Market Restraints Analysis | |
      1. 3.2.1 Grid Capacity Constraints in Rural Regions | |
      2. 3.2.2 Overcapacity and Price-War Margin Erosion | |
      3. 3.2.3 Tariff Escalation in Key Export Markets | |
      4. 3.2.4 Lithium and Rare-Earth Supply Volatility | |
      5. 3.2.5 Consumer Fatigue with Rapid Model Turnover |
    3. 3.3 Market Opportunity Analysis | |
      1. 3.3.1 Solid-State Battery Commercialization | |
      2. 3.3.2 Vehicle-to-Grid and Energy Services | |
      3. 3.3.3 Rural and Lower-Tier City Penetration | |
      4. 3.3.4 Autonomous Driving Software Monetization | |
      5. 3.3.5 Battery Recycling and Circular Economy |
    4. 3.4 Industry Value Chain Analysis |
    5. 3.5 Porter's Five Forces Analysis
  4. 4 China Electric Vehicle Market Size & Forecast (2021–2035) |
    1. 4.1 Historical Market Size (2021–2025) |
    2. 4.2 Current & Forecast Market Size (2026–2035) |
    3. 4.3 Market Size by Revenue (USD Billion) |
    4. 4.4 Year-over-Year Growth Analysis
  5. 5 Segmentation Analysis |
    1. 5.1 By Vehicle Type | |
      1. 5.1.1 Battery Electric Vehicle (BEV) | |
      2. 5.1.2 Plug-in Hybrid Electric Vehicle (PHEV) | |
      3. 5.1.3 Fuel Cell Electric Vehicle (FCEV) |
    2. 5.2 By Application | |
      1. 5.2.1 Passenger Vehicles | |
      2. 5.2.2 Light Commercial Vehicles | |
      3. 5.2.3 Buses and Coaches | |
      4. 5.2.4 Medium/Heavy-Duty Trucks |
    3. 5.3 By Battery Chemistry | |
      1. 5.3.1 Lithium Iron Phosphate (LFP) | |
      2. 5.3.2 Nickel Manganese Cobalt (NMC) | |
      3. 5.3.3 Sodium-Ion (Na-ion) | |
      4. 5.3.4 Solid-State (Emerging)
  6. 6 Regional Analysis |
    1. 6.1 East China | |
      1. 6.1.1 Shanghai | |
      2. 6.1.2 Jiangsu | |
      3. 6.1.3 Zhejiang | |
      4. 6.1.4 Anhui |
    2. 6.2 South China | |
      1. 6.2.1 Guangdong | |
      2. 6.2.2 Fujian | |
      3. 6.2.3 Guangxi |
    3. 6.3 North China | |
      1. 6.3.1 Beijing | |
      2. 6.3.2 Hebei | |
      3. 6.3.3 Tianjin |
    4. 6.4 Central China | |
      1. 6.4.1 Hubei | |
      2. 6.4.2 Hunan | |
      3. 6.4.3 Henan |
    5. 6.5 Southwest China | |
      1. 6.5.1 Sichuan | |
      2. 6.5.2 Chongqing |
    6. 6.6 Northeast China
  7. 7 Competitive Landscape |
    1. 7.1 Market Share Analysis (2025) |
    2. 7.2 Competitive Benchmarking Matrix |
    3. 7.3 Company Profiles | |
      1. 7.3.1 BYD | |
      2. 7.3.2 Tesla (China) | |
      3. 7.3.3 SAIC Motor | |
      4. 7.3.4 Geely-Zeekr | |
      5. 7.3.5 NIO | |
      6. 7.3.6 Li Auto | |
      7. 7.3.7 XPeng | |
      8. 7.3.8 Changan (Avatr/Deepal) | |
      9. 7.3.9 Great Wall Motor (ORA/Tank) | |
      10. 7.3.10 Wuling (SGMW)
  8. 8 Future Outlook & Strategic Recommendations (2026–2035) |
    1. 8.1 Intelligent Driving and Software-Defined Vehicles |
    2. 8.2 Battery Technology Leapfrogging |
    3. 8.3 Electrification of Heavy Transport |
    4. 8.4 ESG Reporting and Carbon-Credit Monetization
  9. 9 Recent Developments & News
  10. 10 Frequently Asked Questions (FAQs)
  11. 11 Report Scope & Methodology |
    1. 11.1 Study Period & Base Year |
    2. 11.2 Data Sources & Citations |
    3. 11.3 Abbreviations
  12. 12 LIST OF TABLES |
  13. TABLE 1 China Electric Vehicle Market Size & Forecast, by Revenue (USD Billion), 2021–2035 |
  14. TABLE 2 China Electric Vehicle Market — Year-over-Year Growth Analysis, 2021–2035 |
  15. TABLE 3 China Electric Vehicle Market — Driver Impact Analysis, 2026–2035 |
  16. TABLE 4 China Electric Vehicle Market — Restraint Impact Analysis, 2026–2035 |
  17. TABLE 5 China Electric Vehicle Market Size, by Vehicle Type, 2021–2035 (USD Billion) |
  18. TABLE 6 China Electric Vehicle Market Size, by Application, 2021–2035 (USD Billion) |
  19. TABLE 7 China Electric Vehicle Market Size, by Battery Chemistry, 2021–2035 (USD Billion) |
  20. TABLE 8 China Electric Vehicle Market Size, by Region, 2021–2035 (USD Billion) |
  21. TABLE 9 East China EV Market Size, by Province, 2021–2035 (USD Billion) |
  22. TABLE 10 South China EV Market Size, by Province, 2021–2035 (USD Billion) |
  23. TABLE 11 North China EV Market Size, by Province/City, 2021–2035 (USD Billion) |
  24. TABLE 12 Central China EV Market Size, by Province, 2021–2035 (USD Billion) |
  25. TABLE 13 Southwest China EV Market Size, by Province/City, 2021–2035 (USD Billion) |
  26. TABLE 14 Northeast China EV Market Size, by Province, 2021–2035 (USD Billion) |
  27. TABLE 15 Competitive Benchmarking Matrix — China Electric Vehicle Market, 2025 |
  28. TABLE 16 Company Profiles — Key Players, China Electric Vehicle Market |
  29. TABLE 17 Recent Developments & Strategic Announcements, 2023–2025 |
  30. TABLE 18 Report Scope & Methodology Summary |
  31. TABLE 19 Detailed Sources and Citations |
  32. TABLE 20 East China EV Market Size, by Vehicle Type, 2021–2035 (USD Billion) |
  33. TABLE 21 East China EV Market Size, by Application, 2021–2035 (USD Billion) |
  34. TABLE 22 East China EV Market Size, by Battery Chemistry, 2021–2035 (USD Billion) |
  35. TABLE 23 South China EV Market Size, by Vehicle Type, 2021–2035 (USD Billion) |
  36. TABLE 24 South China EV Market Size, by Application, 2021–2035 (USD Billion) |
  37. TABLE 25 South China EV Market Size, by Battery Chemistry, 2021–2035 (USD Billion) |
  38. TABLE 26 North China EV Market Size, by Vehicle Type, 2021–2035 (USD Billion) |
  39. TABLE 27 North China EV Market Size, by Application, 2021–2035 (USD Billion) |
  40. TABLE 28 North China EV Market Size, by Battery Chemistry, 2021–2035 (USD Billion) |
  41. TABLE 29 Central China EV Market Size, by Vehicle Type, 2021–2035 (USD Billion) |
  42. TABLE 30 Central China EV Market Size, by Application, 2021–2035 (USD Billion) |
  43. TABLE 31 Central China EV Market Size, by Battery Chemistry, 2021–2035 (USD Billion) |
  44. TABLE 32 Southwest China EV Market Size, by Vehicle Type, 2021–2035 (USD Billion) |
  45. TABLE 33 Southwest China EV Market Size, by Application, 2021–2035 (USD Billion) |
  46. TABLE 34 Southwest China EV Market Size, by Battery Chemistry, 2021–2035 (USD Billion) |
  47. TABLE 35 Northeast China EV Market Size, by Vehicle Type, 2021–2035 (USD Billion) |
  48. TABLE 36 Northeast China EV Market Size, by Application, 2021–2035 (USD Billion) |
  49. TABLE 37 Northeast China EV Market Size, by Battery Chemistry, 2021–2035 (USD Billion) |
  50. TABLE 38 Shanghai EV Market Size, by Vehicle Type, 2021–2035 (USD Billion) |
  51. TABLE 39 Shanghai EV Market Size, by Application, 2021–2035 (USD Billion) |
  52. TABLE 40 Shanghai EV Market Size, by Battery Chemistry, 2021–2035 (USD Billion) |
  53. TABLE 41 Guangdong EV Market Size, by Vehicle Type, 2021–2035 (USD Billion) |
  54. TABLE 42 Guangdong EV Market Size, by Application, 2021–2035 (USD Billion) |
  55. TABLE 43 Guangdong EV Market Size, by Battery Chemistry, 2021–2035 (USD Billion) |
  56. TABLE 44 Beijing EV Market Size, by Vehicle Type, 2021–2035 (USD Billion) |
  57. TABLE 45 Beijing EV Market Size, by Application, 2021–2035 (USD Billion) |
  58. TABLE 46 Beijing EV Market Size, by Battery Chemistry, 2021–2035 (USD Billion) |
  59. TABLE 47 Jiangsu EV Market Size, by Vehicle Type, 2021–2035 (USD Billion) |
  60. TABLE 48 Jiangsu EV Market Size, by Application, 2021–2035 (USD Billion) |
  61. TABLE 49 Jiangsu EV Market Size, by Battery Chemistry, 2021–2035 (USD Billion) |
  62. TABLE 50 Zhejiang EV Market Size, by Vehicle Type, 2021–2035 (USD Billion) |
  63. TABLE 51 Zhejiang EV Market Size, by Application, 2021–2035 (USD Billion) |
  64. TABLE 52 Zhejiang EV Market Size, by Battery Chemistry, 2021–2035 (USD Billion) |
  65. TABLE 53 Sichuan EV Market Size, by Vehicle Type, 2021–2035 (USD Billion) |
  66. TABLE 54 Sichuan EV Market Size, by Application, 2021–2035 (USD Billion) |
  67. TABLE 55 Sichuan EV Market Size, by Battery Chemistry, 2021–2035 (USD Billion) |
  68. TABLE 56 Hubei EV Market Size, by Vehicle Type, 2021–2035 (USD Billion) |
  69. TABLE 57 Hubei EV Market Size, by Application, 2021–2035 (USD Billion) |
  70. TABLE 58 Hubei EV Market Size, by Battery Chemistry, 2021–2035 (USD Billion) |
  71. TABLE 59 Chongqing EV Market Size, by Vehicle Type, 2021–2035 (USD Billion) |
  72. TABLE 60 Chongqing EV Market Size, by Application, 2021–2035 (USD Billion) |
  73. TABLE 61 Chongqing EV Market Size, by Battery Chemistry, 2021–2035 (USD Billion)
  74. 13 LIST OF FIGURES |
  75. FIGURE 1 China Electric Vehicle Market Dynamics — Drivers, Restraints, and Opportunities |
  76. FIGURE 2 China Electric Vehicle Market — Industry Value Chain Analysis |
  77. FIGURE 3 China Electric Vehicle Market — Porter's Five Forces Analysis |
  78. FIGURE 4 China Electric Vehicle Market Size Trend & Forecast (USD Billion), 2021–2035 |
  79. FIGURE 5 China Electric Vehicle Market Share, by Vehicle Type (%), 2025 |
  80. FIGURE 6 China Electric Vehicle Market Share, by Application (%), 2025 |
  81. FIGURE 7 China Electric Vehicle Market Share, by Battery Chemistry (%), 2025 |
  82. FIGURE 8 China Electric Vehicle Market Share, by Region (%), 2025 |
  83. FIGURE 9 East China EV Market Size Trend (USD Billion), 2021–2035 |
  84. FIGURE 10 South China EV Market Size Trend (USD Billion), 2021–2035 |
  85. FIGURE 11 North China EV Market Size Trend (USD Billion), 2021–2035 |
  86. FIGURE 12 Central China EV Market Size Trend (USD Billion), 2021–2035 |
  87. FIGURE 13 Southwest China EV Market Size Trend (USD Billion), 2021–2035 |
  88. FIGURE 14 Northeast China EV Market Size Trend (USD Billion), 2021–2035 |
  89. FIGURE 15 China Electric Vehicle Market — Competitive Landscape Heat Map, 2025 |
  90. FIGURE 16 China Electric Vehicle Market — Company Revenue Share Analysis (%), 2025 |
  91. FIGURE 17 China Electric Vehicle Market — Growth Rate Comparison by Vehicle Type (CAGR %), 2026–2035 |
  92. FIGURE 18 China Electric Vehicle Market — Growth Rate Comparison by Application (CAGR %), 2026–2035 |
  93. FIGURE 19 China Electric Vehicle Market — Growth Rate Comparison by Battery Chemistry (CAGR %), 2026–2035

Segmentation Quick Reference

DimensionSub-SegmentsDominant SegmentFastest Growing Segment
By Vehicle TypeBEV, PHEV, FCEVBEV (72% share, 2025)PHEV (CAGR 18.3%)
By ApplicationPassenger Vehicles, Light Commercial Vehicles, Buses & Coaches, Medium/Heavy-Duty TrucksPassenger Vehicles (82% share, 2025)Medium/Heavy-Duty Trucks (CAGR 19.7%)
By Battery ChemistryLFP, NMC, Sodium-Ion, Solid-StateLFP (67% share, 2025)Sodium-Ion (CAGR 42.5%)


Market Segmentation Overview

By Vehicle Type

Sub-SegmentKey Trend
Battery Electric Vehicle (BEV)Pack costs below USD 92/kWh, driving price parity with ICE; range exceeding 600 km standard
Plug-in Hybrid Electric Vehicle (PHEV)EREV architectures from Li Auto and AITO are capturing range-anxious buyers in lower-tier cities
Fuel Cell Electric Vehicle (FCEV)Hydrogen corridor pilots in Beijing-Zhangjiakou and Shanghai are targeting heavy-duty trucking


BEVs continue to anchor the China Electric Vehicle Market as the dominant powertrain architecture. PHEVs — especially extended-range variants — are the fastest-growing vehicle type as they bridge the gap between full electrification and charging-infrastructure availability in inland provinces. FCEVs remain a niche focused on heavy transport but are gaining policy support through dedicated hydrogen city-cluster programs.

By Application

Sub-SegmentKey Trend
Passenger VehiclesPremiumization trend; rising average transaction prices driven by intelligent-driving features
Light Commercial VehiclesLast-mile logistics electrification mandated in 60+ cities by 2027
Buses and CoachesNear-complete electrification of urban transit fleets; export demand from Southeast Asia
Medium/Heavy-Duty TrucksBattery-swap networks and hydrogen fuel cells enabling long-haul decarbonization


Passenger vehicles dominate in absolute revenue terms, while medium and heavy-duty trucks represent the highest-growth application segment. Municipal green-freight mandates and battery-swap technology are accelerating commercial-vehicle adoption across the China Electric Vehicle Market, particularly in logistics-intensive corridors connecting major manufacturing hubs.

By Battery Chemistry

Sub-SegmentKey Trend
Lithium Iron Phosphate (LFP)Default chemistry for mass-market EVs; cell cost below USD 55/kWh
Nickel Manganese Cobalt (NMC)Retained in premium/long-range applications; declining share as LFP improves density
Sodium-Ion (Na-ion)Emerging ultra-low-cost option for micro-EVs; CATL Jining plant targeting 2026 volume production
Solid-State (Emerging)Semi-solid-state packs entering pilot production; 350+ Wh/kg cell-level density targeted by 2027


LFP's cost and safety advantages have made it the backbone chemistry of the China Electric Vehicle Market. Sodium-ion technology, while still nascent, is the fastest-growing chemistry segment as manufacturers seek to eliminate dependence on lithium supply chains and serve the ultra-affordable micro-EV category that drives volume in rural China.


Download PDF ×

We do not share your information with anyone. However, we may send you emails based on your report interest from time to time. You may contact us at any time to opt-out.