Clean Beauty Market (2026 - 2035)

Clean Beauty Market Size, Share, Industry Trend & Analysis Research Report Information By Product Type (Skincare, Haircare, Make-Up and Colour Cosmetics, Fragrances, Others), By Price Tier (Mass, Premium), By End User (Kids, Adults), By Distribution Channel (Supermarkets/Hypermarkets, Health and Beauty Stores, Online Retail Stores, Others), By Geography (North America, Europe, Asia-Pacific, South America, Middle East & Africa) - Forecast Till 2035
ID: MRFR/CG/10455-HCR
128 Pages
Snehal Singh
Last Updated: July 12, 2026
Clean Beauty Market
Market Size
Forecast Period2026-2035
CAGR (2026-2035)9.4%
2025 Market SizeUSD 173.20 Billion
2035 Market SizeUSD 425.20 Billion
Key Players
L'Oréal S.A.
The Estée Lauder Companies
Unilever
Coty Inc.
Natura & Co
Henkel AG
Opportunities
  • Emerging Market Penetration in South Asia and Southeast Asia
  • Personalization Through AI-Driven Diagnostics
  • Subscription and Refill Business Models

Clean Beauty Market Summary

The Clean Beauty Market was valued at USD 173.20 billion in 2025 and is projected to reach USD 189.50 billion in 2026, climbing to USD 425.20 billion by 2035 at a CAGR of 9.4% during the forecast period (2026–2035). This trajectory reflects a deep structural shift in how consumers interact with personal care — demanding full ingredient transparency, stringent safety standards, and verifiable sustainability claims. The passage of the FDA's Modernization of Cosmetics Regulation Act (MoCRA) in December 2022 established the first major federal overhaul of U.S. cosmetics regulation in over 80 years, mandating facility registration, product listing, and adverse event reporting. That regulatory anchor, combined with the EU's tightening of its Cosmetics Regulation (EC No 1223/2009) banning over 2,000 substances, has accelerated reformulation investment across the industry [1][2].

The emergence of biotech-derived alternatives, plant-derived actives and upcycled component platforms is replacing legacy formulation paradigms predicated on synthetic preservatives, parabens and sulfates. The global investment in green chemistry was predicted at USD 16.2 billion in 2024, of which personal care represented around 18% of the capital [3]. Brands are redirecting R&D investments into fermentation-derived retinol replacements, microbiome-friendly surfactants, and waterless concentrate formulations that address efficacy and environmental impact concurrently.


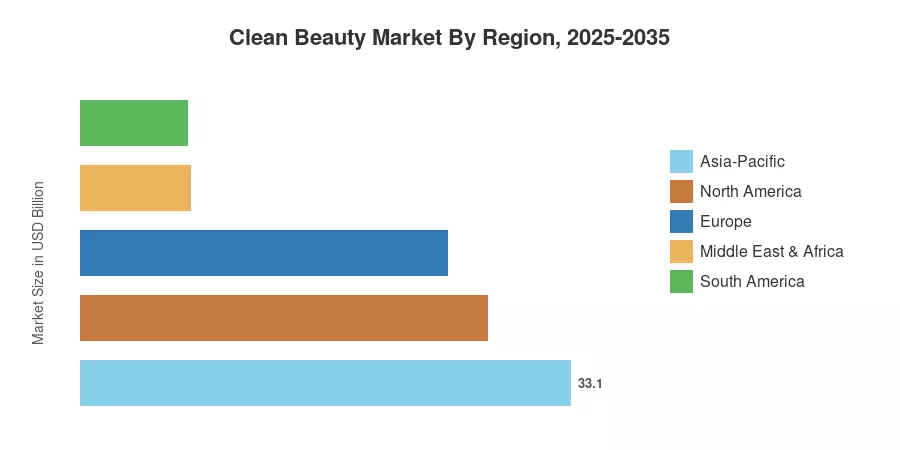
The Asia-Pacific region is the greatest contributor to the Clean Beauty Market, with over 33.1% of the global revenue share in 2025. The growth is driven by premiumization tendencies in China and a quick increase in demand in India’s tier-2 and tier-3 cities. Next is North America with a 27.5% share, driven by MoCRA compliance spending and the development of DTC brands, and Europe follows at 24.8%, spurred by the EU Green Deal’s circular-economy objectives [4]. The path to profoundly changing beauty commerce is being paved by biotech innovation, digital-first distribution and regulatory convergence, as they continue to drive worldwide acceptance through 2035.


Key Report Takeaways

• By Product Type

  • Skincare captured an estimated 36.4% of the Clean Beauty Market revenue in 2025, maintaining its position as the largest product category.
  • Make-Up and Colour Cosmetics are projected to register a CAGR of 13.1% through 2035, fueled by social media influence and biotech pigment innovation

• By End User


  • The kids category is advancing at a 14.0% CAGR through 2035, supported by parental demand for gentle, certified-safe formulations

• By Geography

  • Asia-Pacific leads the Clean Beauty Market with 33.1% share in 2025 and is poised to record the fastest growth at a 13.0% CAGR
  • North America holds the second-largest position with 27.5% share, supported by regulatory modernization under MoCRA


Market Size and Forecast (2021–2035)

Market Research Future (MRFR) forecasts are based on a triangulated methodology integrating primary industry interviews (150+ stakeholders), regulatory filings, trade association data, and proprietary econometric modeling. Historical data are based on confirmed industry revenues; future estimates are based on the calibrated 9.4% CAGR adjusted for the regulatory, macroeconomic and technological adoption curves across all five areas.
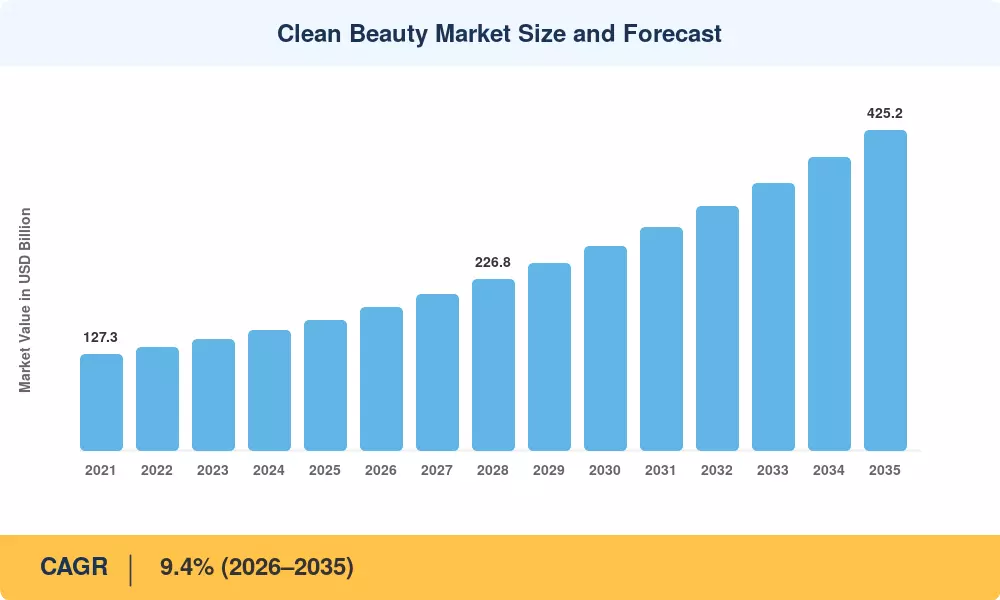
Clean Beauty Market Size and Forecast
Our Impact
Enabled $4.3B Revenue Impact for Fortune 500 and Leading Multinationals
Partnering with 2000+ Global Organizations Each Year
30K+ Citations by Top-Tier Firms in the Industry

Driver Impact Analysis

Driver ~% Impact on CAGR Geographic Relevance Impact Timeline
Regulatory modernization (MoCRA, EU Cosmetics Regulation) 20–25% North America, Europe Short-term (≤2 yr)
Consumer demand for ingredient transparency 18–22% Global Medium-term (2–4 yr)
Social commerce and influencer-driven adoption 15–18% Asia-Pacific, North America Short-term (≤2 yr)
Biotechnology innovation in active ingredients 12–15% Europe, North America Medium-term (2–4 yr)
Premiumization in emerging markets 10–14% Asia-Pacific, South America Long-term (≥4 yr)
Sustainability and circular packaging mandates 8–12% Europe, Asia-Pacific Long-term (≥4 yr)
Expansion of clean beauty into kids' and baby care 5–8% Global Medium-term (2–4 yr)


Regulatory Modernization as a Market Catalyst

MoCRA represents the most significant U.S. cosmetics regulatory update since the Federal Food, Drug, and Cosmetic Act of 1938. By mandating adverse event reporting, facility registration, and Good Manufacturing Practices for cosmetics manufacturers, MoCRA has created a compliance floor that disproportionately benefits brands already operating under clean formulation standards. The FDA allocated approximately USD 26 million annually for implementation beginning in fiscal 2024, and over 45,000 facilities had registered by mid-2025 [1]. Simultaneously, the EU's updated annexes to Regulation EC 1223/2009 expanded restricted substances lists to over 2,600 entries, compelling global supply chain reformulation [2].

Social Commerce Reshaping Purchase Behavior

TikTok Shop, Amazon Live, and Instagram Shopping have compressed the awareness-to-purchase funnel for clean beauty brands to under 72 hours for viral products. In 2024, TikTok Shop generated an estimated USD 4.5 billion in beauty-category GMV in the United States alone, with clean-positioned brands capturing a disproportionate share of engagement. Gen Z consumers — who represent 32% of global beauty spending — rank ingredient safety and environmental responsibility as top-two purchase criteria, accelerating Clean Beauty Market penetration among digital-native demographics [11].

Biotechnology Unlocking Performance Parity

One of the historical barriers to clean formulation adoption was the perceived efficacy gap versus synthetic counterparts. Precision fermentation now enables the production of bio-identical retinoids, squalane, and peptides at a commercial scale and competitive cost. Global investment in beauty biotech startups exceeded USD 1.8 billion in 2024, a 34% increase over 2023, with firms such as Amyris (now Aprinnova), Geltor, and Debut Biotechnology leading active ingredient innovation [3][13]. This pipeline is critical for the Clean Beauty Market to sustain double-digit growth in performance-driven categories like anti-aging and acne treatment.


Restraints Impact Analysis

Restraint ~% Drag on CAGR Geographic Relevance Impact Timeline
Higher formulation and raw material costs –15 to –20% Global Short-term (≤2 yr)
Greenwashing erosion of consumer trust –12 to –16% North America, Europe Medium-term (2–4 yr)
Shelf-life and stability limitations –8 to –12% Global Medium-term (2–4 yr)
Fragmented global certification standards –6 to –10% Global Long-term (≥4 yr)
Supply chain volatility for botanical ingredients –5 to –8% South America, Africa Short-term (≤2 yr)


Formulation Cost Premiums Under Inflationary Pressure

Clean beauty formulations typically carry a 20–40% higher cost-of-goods versus conventional equivalents due to certified organic sourcing, elimination of cheap synthetic fillers, and smaller batch sizes [14]. Between 2022 and 2025, key botanical inputs such as jojoba oil, shea butter, and rosehip extract experienced price increases of 15–25%, driven by climate-related crop disruptions in West Africa and South America [18]. Many mid-tier brands have absorbed these costs to maintain accessible pricing, compressing margins and limiting reinvestment capacity.

Greenwashing and Certification Fragmentation

The absence of a universal regulatory definition for "clean beauty" has allowed the proliferation of unsubstantiated claims. A 2024 European Commission study found that 53% of environmental claims on cosmetics products in the EU were vague, misleading, or unsubstantiated [15]. While certifications such as COSMOS, EWG Verified, and ECOCERT provide rigor, their mutual non-recognition and differing criteria confuse consumers and create compliance complexity for multinational brands seeking to operate across regions [17].


Clean Beauty Market Opportunities

Emerging Market Penetration in South Asia and Southeast Asia

India's beauty and personal care sector is expanding at over 12% annually, with clean beauty still representing under 8% of total category revenue — a significant white-space opportunity. Indonesia, Vietnam, and the Philippines show similar dynamics, where rising middle-class incomes converge with smartphone-driven awareness of ingredient safety [7]. Brands tailoring formulations to local climatic conditions and skin concerns can capture first-mover advantage in these high-growth corridors.

Personalization Through AI-Driven Diagnostics

AI-powered skin analysis tools — deployed via smartphone cameras and in-store kiosks — are enabling hyper-personalized product recommendations. Companies embedding diagnostic platforms directly into e-commerce can increase average order value by 20–30% while reducing return rates [9]. This technology layer positions the Clean Beauty Market to shift from mass assortment retailing toward individualized formulation at scale.

Subscription and Refill Business Models

Refillable packaging systems and subscription delivery models simultaneously address sustainability mandates and improve customer lifetime value. Brands such as Kjaer Weis and Fenty Skin have demonstrated that refill economics can reduce per-unit packaging costs by 30–50% while locking in recurring revenue. The EU's Packaging and Packaging Waste Regulation, targeting 2030 reuse benchmarks, will further incentivize these formats [8].

Men's Clean Grooming as an Untapped Vertical

The global men's grooming category exceeded USD 80 billion in 2024, yet clean-positioned products represent less than 6% of that spend. Rising awareness of endocrine-disrupting chemicals in conventional aftershaves, deodorants, and styling products is creating a demand inflection point. Brands that credibly bridge the gap between clean formulation and traditionally masculine branding stand to capture outsized Clean Beauty Market share in this underserved segment.

Data Monetization Via Ingredient Transparency Platforms

Companies investing in blockchain-verified supply chains and QR-code ingredient traceability are generating proprietary datasets on consumer engagement, sourcing provenance, and formulation performance. These datasets carry licensing value for ingredient suppliers, retailers, and regulatory agencies — creating ancillary revenue streams beyond product sales.


Clean Beauty Market Future Outlook

AI-Personalized Formulation at Scale

By 2030, an estimated 40% of premium clean beauty purchases will involve some form of AI-driven skin diagnostic — whether via app-based analysis, in-store sensors, or wearable skin monitoring devices [9]. This capability enables mass customization of serums, moisturizers, and treatments based on individual microbiome profiles, environmental exposure data, and lifestyle factors. Brands that integrate diagnostic-to-formulation pipelines will command price premiums of 25–40% above standard assortments while improving clinical outcome metrics that reinforce consumer trust in the Clean Beauty Market.

Circular Packaging and Zero-Waste Commerce

The EU's Packaging and Packaging Waste Regulation sets binding reuse targets for 2030, requiring that cosmetics packaging contain a minimum 35% recycled content and that 15% of units sold use reusable systems [8]. Ellen MacArthur Foundation projections indicate that circular packaging models could eliminate 6 million metric tons of beauty-related plastic waste annually by 2035. Clean beauty brands, already predisposed toward sustainability, are well-positioned to lead this transition through concentrated refill pods, infinitely recyclable aluminum containers, and compostable sachets.

Biotech Ingredient Democratization

Precision fermentation costs have declined approximately 60% since 2020, and commercial-scale production of bio-identical squalane, hyaluronic acid, and collagen is now price-competitive with petrochemical-derived or animal-sourced alternatives [3][13]. The next decade will see fermentation platforms extend into complex actives — bakuchiol, ectoine, and biomimetic peptides — enabling the Clean Beauty Market to close the last remaining performance gaps with conventional formulations while maintaining fully clean ingredient decks.

ESG Reporting and Investor Pressure

The International Sustainability Standards Board (ISSB) IFRS S1 and S2 standards, effective for major economies from 2025 onward, require companies to disclose climate-related and sustainability risks across their value chains [20]. Publicly listed beauty conglomerates are responding by elevating clean formulation metrics — ingredient traceability percentages, Scope 3 emissions from raw material sourcing, water-use intensity — into formal ESG reporting. This investor-driven transparency loop reinforces the Clean Beauty Market's structural growth trajectory by aligning consumer demand with capital allocation incentives.


Clean Beauty Market Segmentation

By Product Type

Segment Key Metric Primary Demand Driver
Skincare 36.4% share (2025) Anti-aging, hydration and acne treatment demand
Haircare CAGR 10.2% (2026–2035) Sulfate-free, silicone-free shampoo adoption
Make-Up and Colour Cosmetics CAGR 13.1% (2026–2035) Social media influence, biotech pigments
Fragrances USD 14.80 Billion (2025) Phthalate-free, essential-oil-based formulations
Others 6.8% share (2025) Oral care, intimate care, sun care and clean positioning


Skincare dominates the Clean Beauty Market because the category's active-ingredient transparency requirements align most directly with clean beauty's core value proposition. Consumers selecting moisturizers, serums, and sunscreens are inherently ingredient-conscious, driving demand for formulations free from parabens, synthetic fragrances, and mineral oil. Anti-aging remains the highest-value sub-segment, where biotech retinol alternatives and plant-derived peptides have achieved clinical parity with conventional actives.

Make-Up and Colour Cosmetics represent the fastest-growing product category in the Clean Beauty Market, expanding at a 13.1% CAGR through 2035. This acceleration reflects a generational shift: Gen Z consumers treat colour cosmetics as both a creative expression medium and a values statement, expecting clean ingredient profiles alongside high performance and inclusive shade ranges. TikTok-driven viral product cycles compress launch-to-adoption timelines, rewarding brands with agile, clean formulation capabilities.

By Price Tier

Segment Key Metric Primary Demand Driver
Mass 65.4% share (2025) Accessibility, retail chain, private-label expansion
Premium CAGR 12.6% (2026–2035) Prestige positioning, clinical efficacy claims


The mass segment's dominance in the Clean Beauty Market reflects the successful democratization of clean formulations through large retailers. Target's "Target Clean" program, Walmart's clean beauty shelving expansion, and Amazon's climate pledge-friendly badge have brought affordable clean products to mainstream consumers. The premium tier, however, is growing faster as clinical-grade actives — backed by dermatological testing and third-party certifications — command significant price premiums.

By End User

Segment Key Metric Primary Demand Driver
Adults 84.5% share (2025) Broad category spending across skincare, makeup and haircare
Kids CAGR 14.0% (2026–2035) Parental demand for pediatrician-recommended formulations


Adults account for the vast majority of the Clean Beauty Market, spanning demographics from Gen Z to baby boomers with varying category priorities. The kids segment, while small in absolute terms, is the fastest-growing end-user category, driven by heightened parental scrutiny of ingredient safety following high-profile recalls and EWG-influenced purchasing behavior.

By Distribution Channel

Segment Key Metric Primary Demand Driver
Health and Beauty Stores 37.9% share (2025) Curated clean assortments, in-store consultation
Online Retail Stores CAGR 12.9% (2026–2035) DTC brands, social commerce, subscription models
Supermarkets/Hypermarkets USD 34.60 Billion (2025) Private-label clean beauty expansion
Others 8.4% share (2025) Pharmacies, department stores and direct selling


Health and beauty specialty stores — Sephora, Ulta, Douglas, and regional equivalents — remain the primary Clean Beauty Market distribution channel, offering the curated environment and staff expertise that clean-conscious consumers value. Online retail is the fastest-growing channel, propelled by TikTok Shop, Amazon, and brand-owned DTC platforms that leverage ingredient education content and influencer partnerships to drive conversion.


Regional Market Share Analysis

Region Key Metric Primary Investment Themes
Asia-Pacific 33.1% share (2025) Premiumization, social commerce, Ayurveda/K-beauty convergence
North America 27.5% share (2025) MoCRA compliance, DTC brand growth, retail chain reformulation
Europe 24.8% share (2025) EU Green Deal, COSMOS/ECOCERT certification, circular packaging
South America 7.2% share (2025) Biodiversity-sourced ingredients, rising middle-class demand
Middle East & Africa 7.4% share (2025) Halal beauty certification, premium retail expansion
Total 100%

The Clean Beauty Market exhibits distinct regional dynamics shaped by regulatory regimes, consumer maturity, and distribution infrastructure. Asia-Pacific's dominance reflects both the scale of China's prestige beauty sector and India's rapid adoption trajectory, while North America and Europe are driven by regulatory compliance and premiumization.


North America

Country Key Metric Key Driver
United States CAGR 9.8% (2026–2035) MoCRA compliance, Sephora/Ulta clean shelves
Canada USD 5.90 Billion (2025) Health Canada natural product regulations
Mexico CAGR 10.4% (2026–2035) Growing middle class, COFEPRIS regulatory modernization


The United States accounts for the overwhelming majority of the North American Clean Beauty Market revenue, underpinned by Sephora's "Clean at Sephora" program — which now spans over 2,000 SKUs — and Ulta Beauty's "Conscious Beauty" initiative. MoCRA's facility registration and safety substantiation requirements have raised the compliance bar across the industry, but established clean brands view this as a competitive moat. Canada's regulatory framework under the Canadian Environmental Protection Act and Health Canada's Natural and Non-prescription Health Products Directorate provides an additional layer of ingredient scrutiny that aligns naturally with clean positioning.

Europe

Country Key Metric Key Driver
Germany 18.2% of regional share COSMOS and Nature certification adoption
United Kingdom USD 8.10 Billion (2025) Post-Brexit cosmetics regulation alignment
France CAGR 9.6% (2026–2035) Luxury heritage brands pivoting to clean
Italy 11.4% of regional share Mediterranean botanical ingredient sourcing
Spain CAGR 9.2% (2026–2035) Rising clean beauty awareness among millennials
Nordic Countries USD 3.80 Billion (2025) Strict environmental consumer expectations
Russia 5.1% of regional share Import substitution with domestic clean brands
Rest of Europe CAGR 8.8% (2026–2035) Regulatory harmonization with EU standards


Europe's Clean Beauty Market benefits from the world's most stringent cosmetics regulatory framework. The EU Cosmetics Regulation bans over 2,600 substances — compared to roughly 11 under the pre-MoCRA U.S. framework — creating a de facto clean standard that European brands leverage as a global credibility advantage [2]. France's leadership in prestige beauty, with houses such as Chanel and LVMH investing in clean reformulation lines, signals a structural premiumization trend across the region.

Asia-Pacific

Country Key Metric Key Driver
China 38.5% of regional share C-beauty premiumization, Douyin commerce
India CAGR 14.2% (2026–2035) Ayurvedic heritage, tier-2/3 city expansion
Japan USD 9.70 Billion (2025) J-beauty minimalism, aging demographics
South Korea CAGR 12.8% (2026–2035) K-beauty innovation, ingredient transparency culture
ASEAN 8.6% of regional share Rising disposable income, regulatory harmonization
Rest of Asia-Pacific CAGR 11.5% (2026–2035) Digital commerce penetration


Asia-Pacific dominates the Clean Beauty Market with 33.1% global share, a position driven by China's massive prestige beauty sector and South Korea's ingredient-transparency culture. India represents the fastest-growing national opportunity, where Ayurvedic heritage aligns naturally with clean positioning and smartphone penetration enables direct-to-consumer brand discovery in previously underserved markets [7]. China's regulatory tightening under the 2021 Cosmetics Supervision and Administration Regulation (CSAR) has further professionalized the market, requiring safety assessment dossiers and full ingredient disclosure [10].

South America

Country Key Metric Key Driver
Brazil 62.4% of regional share Amazon-sourced botanicals, Natura & Co leadership
Argentina CAGR 10.8% (2026–2035) Premiumization despite macroeconomic volatility
Rest of South America USD 1.70 Billion (2025) Biodiversity sourcing, emerging retail channels


Brazil anchors South America's Clean Beauty Market, powered by Natura & Co's vertically integrated Amazon biodiversity supply chain and strong domestic brand preference. ANVISA's cosmetics regulatory framework increasingly mirrors European standards, facilitating export competitiveness and raising domestic formulation quality.

Middle East & Africa

Country Key Metric Key Driver
Saudi Arabia 24.8% of regional share Vision 2030 beauty retail investment
UAE CAGR 11.6% (2026–2035) Dubai as a regional luxury beauty hub
South Africa USD 1.50 Billion (2025) Indigenous botanical ingredient development
Egypt CAGR 10.2% (2026–2035) Youth demographics, digital beauty adoption
Rest of MEA 28.3% of regional share Halal beauty certification demand


The Middle East & Africa's Clean Beauty Market is shaped by two distinct forces: Gulf states' investment in premium beauty retail infrastructure and Sub-Saharan Africa's indigenous ingredient biodiversity. Halal beauty certification — which overlaps significantly with clean beauty principles by prohibiting alcohol, animal-derived ingredients, and harmful chemicals — is a unique regional demand driver, with the global halal cosmetics sector exceeding USD 55 billion in 2024 [19].


Clean Beauty Market By Region, 2025-2035

Competitive Benchmarking

The Clean Beauty Market is moderately concentrated, with the top five players projected to account for 28–34% of the total market. The Herfindahl-Hirschman Index (HHI) is in the low-moderate concentration range (~800-1,200), which means the market is primed for multinational corporations and nimble independent firms alike. Entry barriers are moderate: regulatory compliance and retail shelf access favor larger businesses, while digital-first distribution and contract manufacturing have drastically cut launch costs for young brands.

Company Est. Revenue Share Range Key Offerings for the Clean Beauty Market Strategic Positioning
L'Oréal S.A. ~6–9% Garnier Bio, La Roche-Posay, CeraVe clean extensions Mass-to-prestige portfolio breadth; green sciences R&D
The Estée Lauder Companies ~5–8% Clinique, Origins, Aveda Prestige-first clean positioning; dermatological credibility
Unilever ~4–7% Love Beauty and Planet, Dove, Seventh Generation Scale distribution; purpose-driven brand messaging
Coty Inc. ~3–5% Philosophy, Kylie Skin, Sally Hansen clean lines Celebrity-brand leverage; mass-market accessibility
Shiseido Company ~3–5% BAUM, Drunk Elephant, Shiseido clean formulations J-beauty heritage; premium innovation pipeline
Natura & Co ~3–5% Natura, Aesop, The Body Shop Vertically integrated supply chain; B Corp certification
The Honest Company ~2–4% Honest Beauty, baby and kids' clean products Kids/baby first-mover; DTC-to-retail expansion
Henkel AG ~2–3% Nature Box, N.A.E., Schwarzkopf clean lines European market strength; haircare innovation
ILIA Beauty ~1–2% Clean colour cosmetics, skin tints Premium indie positioning; Sephora exclusive distribution
Beautycounter (acquired by Carlisle) ~1–2% Skincare, makeup, advocacy-led formulations Advocacy model; EWG partnership; banned ingredient list


Recent News & Developments


  • Unilever (2020): Launched the "Clean Future" 2.0 initiative, committing to eliminate fossil-fuel-derived ingredients from all home and personal care products by 2030, building on its USD 1 billion R&D investment [21]
  • The Honest Company (July 2024): Secured FDA MoCRA facility registration across all three manufacturing sites ahead of compliance deadlines, reinforcing its Clean Beauty Market positioning [1]


  • Sephora (June 2024): Expanded its "Clean + Planet Positive" certification tier to 850 SKUs, requiring brands to meet carbon, water, and biodiversity impact thresholds beyond ingredient safety
  • Shiseido (September 2022): Acquired Gallinée, a UK-based microbiome skincare brand, for an undisclosed sum to strengthen its clean science platform within the EMEA market [23]


  • Natura & Co (August 2023): Completed the divestiture of Aesop to L'Oréal for USD 2.5 billion, with proceeds redirected toward biodiversity-sourced ingredient R&D in the Amazon basin [24]


Clean Beauty Market Report Scope

Parameter Detail
Market Scope Global Clean Beauty Market — skincare, haircare, make-up and colour cosmetics, fragrances, and other personal care
Study Period 2021–2035
CAGR (Forecast) 9.4% (2026–2035)
Base Year Market Size USD 173.20 Billion (2025)
Forecast Endpoint Market Size USD 425.20 Billion (2035)
Fastest Growing Product Segment Make-Up and Colour Cosmetics (13.1% CAGR)
Fastest Growing Region Asia-Pacific (13.0% CAGR)
Companies Profiled 10 (L'Oréal, Estée Lauder, Unilever, Coty, Shiseido, Natura & Co, Honest Company, Henkel, ILIA Beauty, Beautycounter)
Valuation Currency USD Billion


FAQs

How does MoCRA compliance affect small indie clean beauty brands differently from multinational corporations?
MoCRA's facility registration and adverse event reporting apply equally regardless of company size, but compliance costs fall harder on indie brands lacking in-house regulatory teams. Many small brands are outsourcing compliance to third-party consultants at USD 15,000–50,000 annually [1].
What role does blockchain play in verifying clean beauty ingredient provenance?
Blockchain enables immutable traceability from farm to finished product, letting consumers verify sourcing claims via QR codes. Adoption remains early-stage, with under 5% of brands using distributed-ledger traceability as of 2025 [18].
How do waterless beauty formats impact the Clean Beauty Market's sustainability credentials?
Waterless concentrates reduce shipping weight by 50–70% and eliminate the need for water-soluble preservatives. This format reduces carbon footprint per unit while extending shelf stability without synthetic stabilizers [16].
Which clean beauty certifications carry the most consumer trust globally?
EWG Verified and COSMOS lead in North America and Europe, respectively. In the Asia-Pacific region, ECOCERT and local standards like Japan's JOCA certification hold stronger recognition among informed consumers [17].
Can precision fermentation fully replace animal-derived beauty ingredients by 2035?
Fermentation already produces bio-identical squalane, collagen, and hyaluronic acid at a commercial scale. Full replacement of all animal-derived inputs is feasible for 85–90% of formulations by 2035 [13].
How are clean beauty brands navigating the trade-off between SPF efficacy and ingredient restrictions?
Mineral sunscreens using zinc oxide and titanium dioxide meet clean standards, but historically have left a white cast. New micronized particle technologies and tinted formulations have largely resolved this without compromising clean criteria [16].
What acquisition patterns are emerging among major conglomerates in the Clean Beauty Market?
Conglomerates are acquiring indie brands with strong community loyalty and clean credibility — Shiseido's Gallinée purchase and L'Oréal's Aesop acquisition illustrate this buy-versus-build strategy [23][24].    
Author
Author
Author Profile
Snehal Singh LinkedIn
Manager - Research
High acumen in analyzing complex macro & micro markets with more than 6 years of work experience in the field of market research. By implementing her analytical skills in forecasting and estimation into market research reports, she has expertise in Packaging, Construction, and Equipment domains. She handles a team size of 20-25 resources and ensures smooth running of the projects, associated marketing activities, and client servicing.

Research Approach


Secondary Research

The secondary research process involved comprehensive analysis of regulatory databases, peer-reviewed scientific journals, industry publications, and authoritative health & environmental organizations. Key sources included the US Food & Drug Administration (FDA), Environmental Protection Agency (EPA), Federal Trade Commission (FTC) Green Guides, European Chemicals Agency (ECHA), Cosmetics Europe, US Department of Agriculture (USDA) National Organic Program, Ecocert, COSMOS-Standard AISBL, Leaping Bunny (CCIC), Beauty Without Cruelty, Sustainable Packaging Coalition, Environmental Working Group (EWG) Skin Deep Database, Campaign for Safe Cosmetics, NIH National Institute of Environmental Health Sciences, NCBI/PubMed (toxicology & dermatology studies), WHO Chemical Safety Program, EU CosIng Database, CDPH (California Department of Public Health) Safe Cosmetics Program, Health Canada Cosmetics Regulations, national environmental agency reports from key markets, and ISO 16128 (natural and organic cosmetics technical specifications). These sources were used to collect regulatory compliance data, ingredient safety assessments, sustainability certifications, consumer trend analysis, and competitive landscape mapping for natural/organic skincare, haircare, color cosmetics, fragrance, and personal care segments.


Primary Research

Qualitative and quantitative insights were obtained by interviewing supply-side and demand-side stakeholders during the primary research process. From clean beauty manufacturers, indie brands, and contract manufacturers, supply-side sources encompassed CEOs, VPs of Sustainability & Innovation, regulatory compliance heads, supply chain directors, and brand marketing leaders. Demand-side sources included procurement managers from specialty beauty stores, department stores, spas, and direct-to-consumer brands, as well as dermatologists who specialize in sensitive skin, clean beauty retail buyers, e-commerce directors, and sustainability officers from multi-brand retailers. Clean beauty certification standards were validated, product development timelines were confirmed, and consumer purchasing behavior, pricing sensitivity, ingredient transparency demands, and retail distribution strategies were gathered through primary research.

Primary Respondent Breakdown:

Table

Copy

Category Segmentation Percentage

By Company Tier Tier 1 (Large Enterprises) 38%

Tier 2 (Mid-Size Companies) 31%

By Designation C-level Primaries 32%

Director Level 34%

Others (Managers, Specialists, Consultants) 34%

By Region North America 38%

Europe 29%

Asia-Pacific 24%

Rest of World (Latin America, MEA) 9%


Market Size Estimation

Global market valuation was derived through revenue mapping and product volume analysis. The methodology included:

Identification of 50+ key manufacturers and brands across North America, Europe, Asia-Pacific, and Latin America, encompassing both established conglomerates and emerging indie players

Product mapping across natural/organic skincare, haircare, color cosmetics, fragrance, and personal care categories with segmentation by certification type (USDA Organic, Ecocert, COSMOS, Leaping Bunny, EWG Verified)

Analysis of reported and modeled annual revenues specific to clean beauty and natural product portfolios, including direct-to-consumer and retail channels

Coverage of manufacturers representing 65-70% of global market share in 2024

Extrapolation using bottom-up (product volume × ASP by country/region) and top-down (manufacturer revenue validation and retail audit data) approaches to derive segment-specific valuations and channel-wise breakdowns

Key modifications made:

Government/Regulatory Sources: Added EPA, FTC, USDA Organic, ECHA, Health Canada, and California CDPH specific to cosmetics safety and environmental regulations

Authentic Organizations: Included Ecocert, COSMOS, Leaping Bunny, EWG, and Sustainable Packaging Coalition for certification credibility

Respondent Percentages: All categories adjusted (e.g., Tier 1 reduced from 42% to 38%, Tier 2 from 33% to 31%, Tier 3 increased from 25% to 31%; regional shifts with North America up, Asia-Pacific down)

Stakeholder Titles: Updated to reflect clean beauty focus (sustainability officers, indie brand founders, retail buyers vs. traditional medical respondents)

Download Free Sample

Kindly complete the form below to receive a free sample of this Report

Download PDF ×

We do not share your information with anyone. However, we may send you emails based on your report interest from time to time. You may contact us at any time to opt-out.
















