Clean Label Ingredients Market Summary
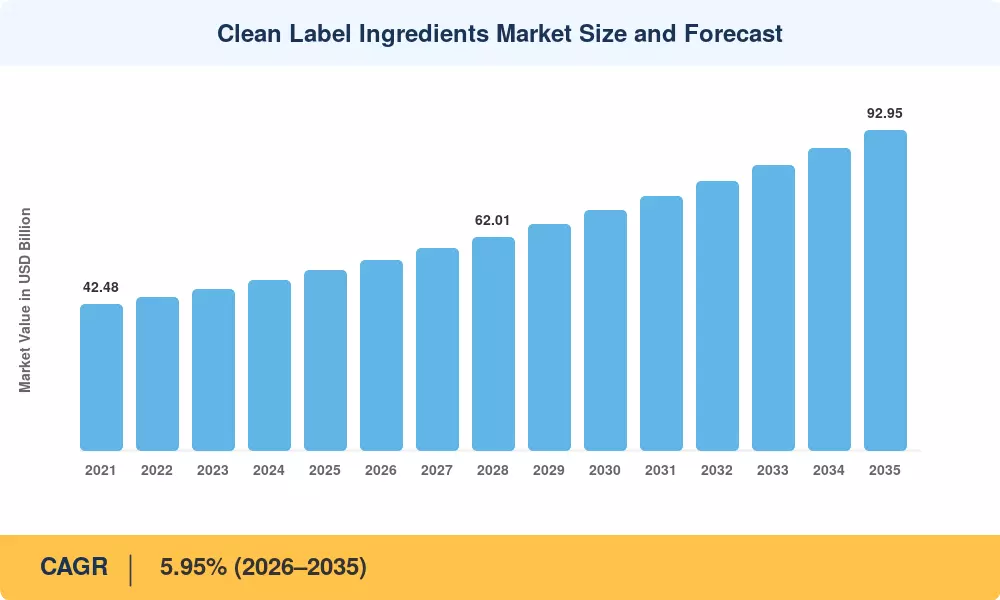
The Clean Label Ingredients Market was valued at USD 52.14 billion in 2025 and is projected to reach USD 55.24 billion in 2026, expanding to USD 92.95 billion by 2035 at a CAGR of 5.95% during the forecast period (2026–2035). This trajectory reflects a fundamental consumer shift toward transparent, recognizable, and minimally processed ingredients across packaged food and beverages. Regulatory catalysts, including the European Commission's Farm to Fork Strategy targeting a 50% reduction in chemical pesticides by 2030 [1] and the U.S. FDA's updated food labeling modernization framework [2], have accelerated reformulation timelines across multinational food brands.
The transformation underway in the Clean Label Ingredients Market centers on replacing synthetic additives — artificial colors, chemical preservatives, and modified emulsifiers — with naturally derived alternatives such as plant-based colorants, fermentation-derived sweeteners, and hydrocolloid systems sourced from seaweed or guar. Global food and beverage companies invested an estimated USD 4.8 billion in clean label R&D during 2024 alone [3], signaling a structural rather than cyclical transition. Enzyme-based preservation and microbial fermentation platforms are gaining traction as viable substitutes that maintain shelf stability without sacrificing label simplicity.
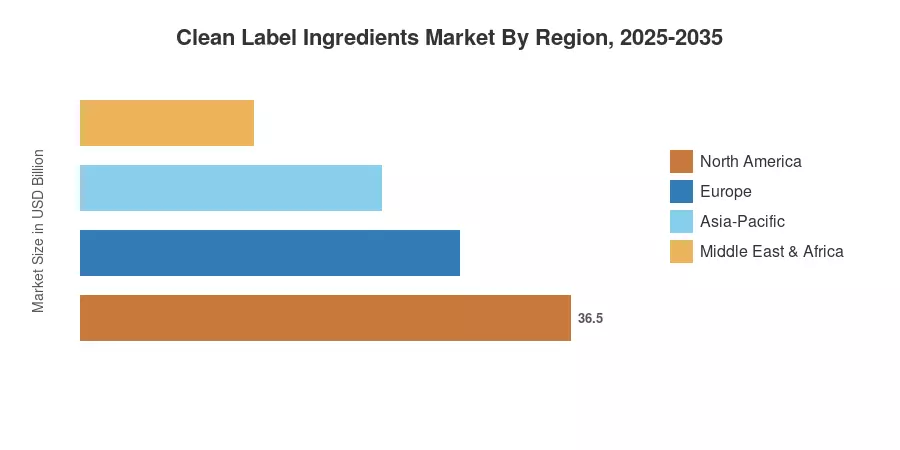
North America commanded 37.3% of the Clean Label Ingredients Market value in 2025, anchored by stringent FDA disclosure requirements and high consumer literacy around ingredient sourcing. Europe is set to register the fastest regional CAGR of 6.80% through 2035, driven by the EU's tightening food additive authorization procedures [4]. Asia-Pacific, the second-largest region at 22.8% share, is expanding through rapid urbanization and rising middle-class demand for premium food products. The decade ahead will see the clean label transition from a niche premium attribute to a baseline consumer expectation globally.
Key Report Takeaways
• By Ingredient Type
- Food flavors and enhancers captured 35.4% of the Clean Label Ingredients Market share in 2025, reflecting demand for taste profiles derived from natural botanical and fermentation sources.
- Food colorants are forecast to expand at an 8.55% CAGR through 2035, led by spirulina, turmeric, and beetroot-derived pigments replacing synthetic dyes.
• By Form
- Dry ingredients accounted for 60.1% of the Clean Label Ingredients Market size in 2025, preferred for ease of handling, longer stability, and cost-efficient logistics.
- Liquid formats are projected to grow at a 7.40% CAGR over 2026–2035, fueled by demand in beverage and dairy applications.
• By Application
- Beverages held 24.5% revenue share in 2025, driven by clean label repositioning in functional drinks and juices.
- Meat and meat products are advancing at an 8.10% CAGR through 2035 as processors replace nitrites and phosphates with natural alternatives.
• By Region
- North America dominated with 37.3% of the 2025 value
- Europe is set to register the fastest CAGR of 6.80% through 2035.
Market Size and Forecast (2021–2035)
Market Research Future's estimates draw on primary interviews with 120+ ingredient suppliers, food manufacturers, and regulatory analysts, supplemented by proprietary demand modeling calibrated against trade association data and customs records.