Segmentation Quick Reference
| Dimension | Sub-Segments | Dominant Segment | Fastest Growing Segment |
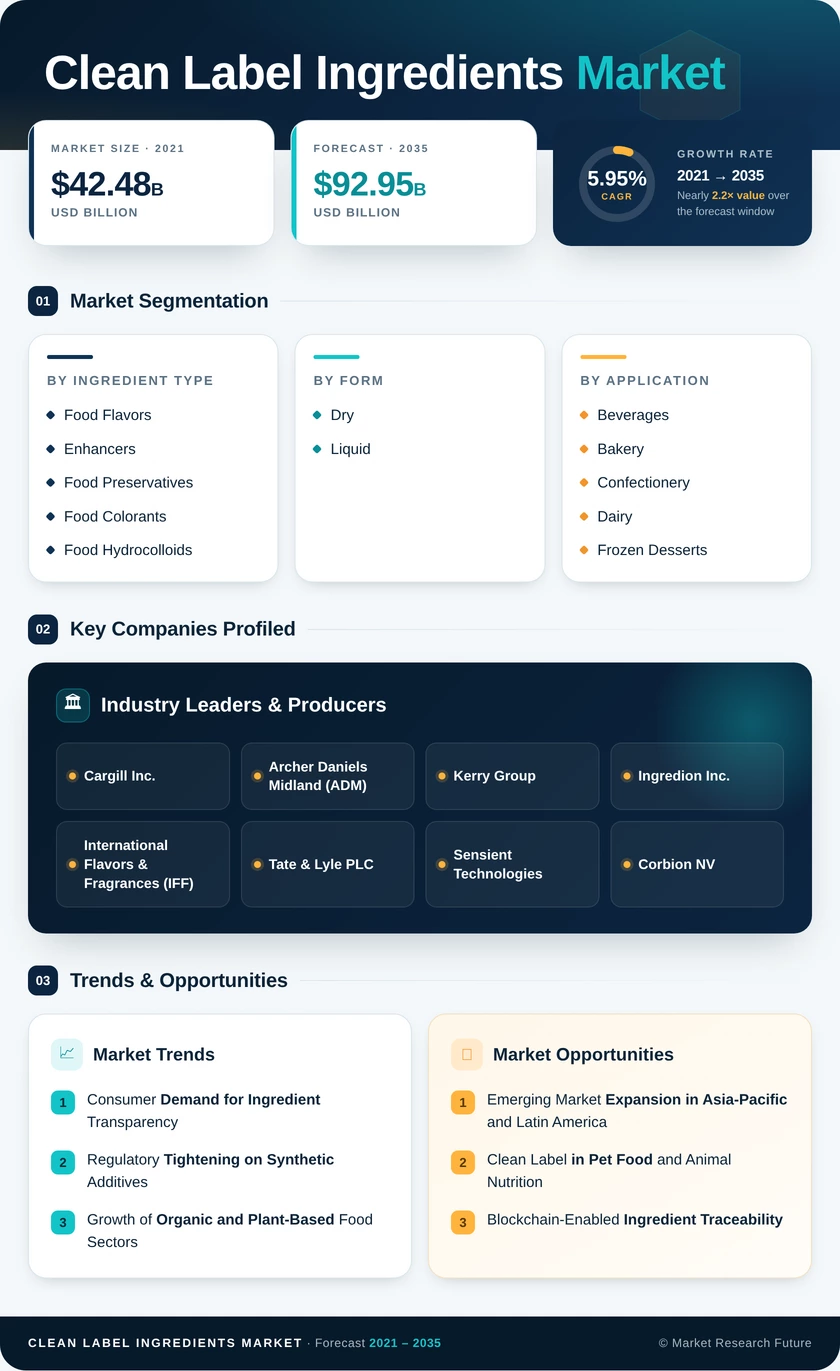
| Ingredient Type | Food Flavors and Enhancers, Food Preservatives, Food Colorants, Food Hydrocolloids and Texturizers, Food Sweeteners | Food Flavors and Enhancers | Food Colorants |
| Form | Dry, Liquid | Dry | Liquid |
| Application | Beverages, Bakery and Confectionery, Dairy and Frozen Desserts, Meat and Meat Products, Other Applications | Beverages | Meat and Meat Products |
| Geography | North America, Europe, Asia-Pacific, South America, Middle East & Africa | North America | Europe |
Market Segmentation Overview
By Ingredient Type
| Sub-Segment | Key Trend |
| Food Flavors and Enhancers | Shift from artificial flavor systems to fermentation-derived and botanical extraction-based natural flavors |
| Food Preservatives | Adoption of rosemary extract, nisin, and citrus-based antimicrobial systems replacing synthetic preservatives |
| Food Colorants | Regulatory bans on synthetic dyes are accelerating demand for spirulina, beetroot, and turmeric-derived colorants |
| Food Hydrocolloids and Texturizers | Plant-based food expansion is driving demand for clean-label guar gum, pectin, and modified starch texturizers |
| Food Sweeteners | Stevia, monk fruit, and allulose are replacing artificial high-intensity sweeteners in reformulated products |
Food flavors and enhancers remain the largest ingredient type segment, driven by the food industry's need to maintain consumer-acceptable taste profiles while removing artificial flavor compounds. Fermentation-derived natural flavors and cold-press botanical extraction technologies have reached commercial maturity, enabling cost-competitive natural flavor alternatives across major food categories.
By Form
| Sub-Segment | Key Trend |
| Dry | Preferred for bakery, confectionery, and snack applications where stability and handling ease are critical |
| Liquid | Growing in beverage and dairy processing lines requiring direct-dose ingredient integration |
Dry ingredients dominate clean label formulations due to superior storage stability, lower logistics cost, and broad applicability across powdered, granulated, and encapsulated delivery formats. Liquid forms are gaining traction in continuous processing environments where reconstitution steps create production bottlenecks.
By Application
| Sub-Segment | Key Trend |
| Beverages | Clean label repositioning of RTD teas, juices, and functional beverages with natural sweeteners and colors |
| Bakery and Confectionery | Replacement of synthetic leavening agents, emulsifiers, and preservatives in bread and snack cakes |
| Dairy and Frozen Desserts | Consumer demand for short-ingredient-list yogurt, ice cream, and cheese products |
| Meat and Meat Products | Regulatory and consumer pressure to replace nitrites and phosphates with natural curing alternatives |
| Other Applications | Sauces, condiments, ready meals, and infant nutrition are adopting clean label reformulation strategies |
Beverages lead application-based segmentation as consumers demonstrate the highest label-reading behavior in this category. Meat and meat products represent the fastest-growing application segment, where clean label alternatives to traditional curing and preservation agents are reshaping processed meat formulations globally.