Clean Coal Technology Market

Key Players: GE Vernova, Mitsubishi Power, Shanghai Electric, Harbin Electric, Dongfang Electric, Doosan Enerbility, Babcock & Wilcox, IHI Corporation

Clean Coal Technology Market

Clean Coal Technology Market Research Report Information by Technology (Gasification Technology, Combustion Technology, and Enabling Technology), And By Region (North America, Europe, Asia-Pacific, And Rest Of The World) โ€“Market Forecast Till 2035
ID: MRFR/EnP/8534-HCR
111 Pages
Priya Nagrale
Last Updated: June 22, 2026

Clean Coal Technology Market Summary

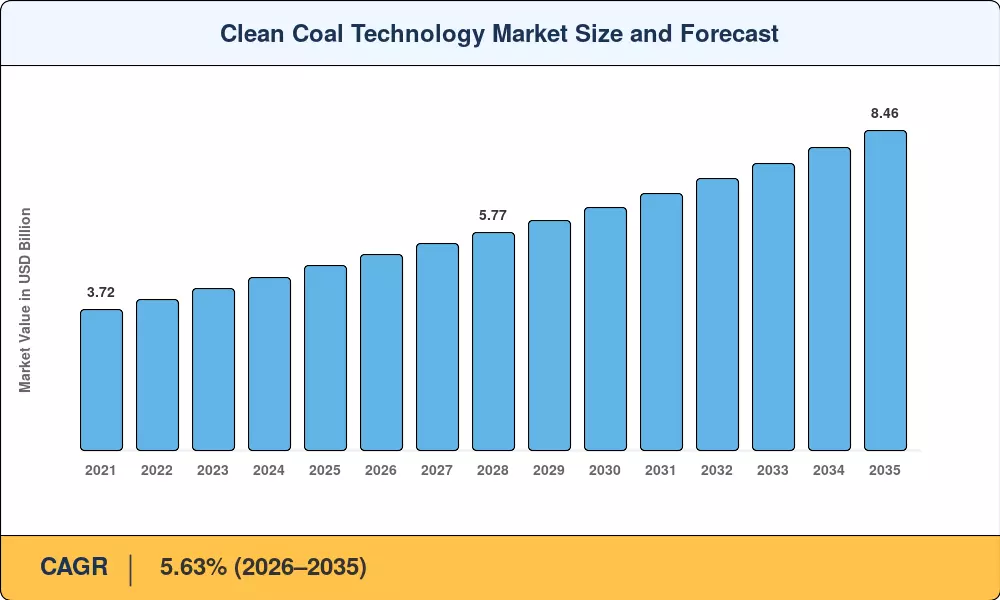
The Clean Coal Technology Market reached an estimated USD 4.89 Billion in 2025 and is projected to grow from USD 5.17 Billion in 2026 to USD 8.46 Billion by 2035, registering a CAGR of 5.63% during the forecast period. Tightening emission regulations across both OECD and non-OECD economies โ€” including the expanded U.S. 45Q tax credit worth up to USD 85 per ton of sequestered COโ‚‚ and the EU Emissions Trading System carbon price exceeding EUR 70 per ton โ€” are channeling capital toward cleaner coal combustion and post-combustion capture systems [1][2].

A generational shift in coal-fired power infrastructure is well underway. Legacy subcritical units, which still account for roughly 40% of the global coal fleet, are being replaced or retrofitted with supercritical and ultra-supercritical boilers that push thermal efficiencies beyond 45%. The International Energy Agency estimates that converting all subcritical plants to high-efficiency, low-emissions technology could cut global COโ‚‚ output by 2 gigatons annually [3]. Meanwhile, carbon capture, utilization, and storage retrofits are extending the economic life of mid-age plants that would otherwise face early retirement, unlocking an estimated USD 12โ€“18 Billion in avoided stranded-asset losses across Asia and North America through 2035 [4].

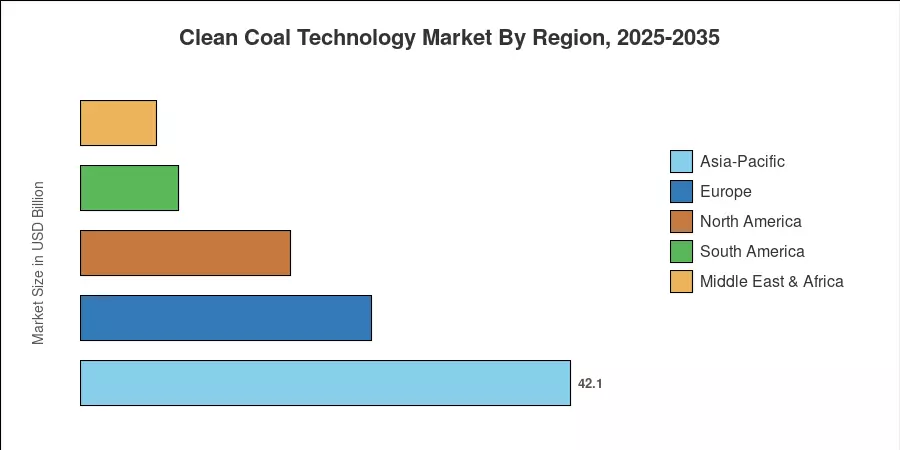
From a geographic standpoint, the Clean Coal Technology Market is anchored by Asia-Pacific, which commanded approximately 42.1% of global revenue in 2025, driven by aggressive coal fleet modernization programs in China and India. North America is on track to post the fastest regional CAGR of 7.47% between 2026 and 2035, supported by federal incentive structures and industrial decarbonization mandates. Europe held the second-largest share at roughly 25.0%, where EU taxonomy rules continue to push remaining coal assets toward capture-ready configurations [5]. The decade ahead will hinge on how quickly financing mechanisms scale to match the technical readiness of next-generation combustion and capture systems.

Key Report Takeaways

โ€ข By Technology

  • Supercritical systems held approximately 47.5% of the Clean Coal Technology Market in 2025, reflecting broad adoption across Asian and European coal fleets.
  • Ultra-supercritical technology is expected to record a CAGR of 15.8% through 2035, making it the fastest-growing combustion segment.
  • Circulating fluidized bed combustion is gaining traction in industrial co-firing applications, with demand rising steadily in cement and chemicals end-use verticals.

โ€ข By Component

  • Equipment accounted for 76.2% of the Clean Coal Technology Market share in 2025, encompassing boilers, turbines, and emissions-control hardware.
  • Services โ€” including engineering, procurement, construction, and maintenance โ€” are forecast to expand at an 8.55% CAGR through 2035 as the installed base grows.

โ€ข By End-User

  • Power utilities represented 78.8% of the Clean Coal Technology Market in 2025, underscoring the sector's dependence on grid-scale coal generation.
  • Iron and steel applications are projected to register the fastest end-user growth at a 9.05% CAGR, fueled by blast-furnace emission reduction mandates.

โ€ข By Region

  • Asia-Pacific led global revenue with a 42.1% share in 2025, anchored by fleet expansion in China and India.
  • North America is forecast to post the highest regional CAGR at 7.47% between 2026 and 2035.

Market Size and Forecast (2021โ€“2035)

Market Research Future's proprietary estimation framework combines bottom-up plant-level capacity analysis, import-export trade data for key combustion and capture equipment, and validated secondary research from government energy agencies, OEM annual filings, and multilateral development bank project databases.

Clean Coal Technology Market Size and Forecast
Our Impact
Enabled $4.3B Revenue Impact for Fortune 500 and Leading Multinationals
Partnering with 2000+ Global Organizations Each Year
30K+ Citations by Top-Tier Firms in the Industry

Driver Impact Analysis

Driver ~% Impact on CAGR Geographic Relevance Impact Timeline
Emission-reduction mandates and carbon pricing ~22% Global Short-term (โ‰ค2 yr)
CCUS retrofit economics and 45Q incentives ~20% North America, Europe Medium-term (2โ€“4 yr)
Supercritical/USC fleet expansion in Asia ~18% Asia-Pacific Medium-term (2โ€“4 yr)
Plant digitalization and AI-based controls ~14% Global Long-term (โ‰ฅ4 yr)
Baseload power reliability requirements ~12% Asia-Pacific, MEA Short-term (โ‰ค2 yr)
Industrial decarbonization in steel and cement ~9% Europe, Asia-Pacific Long-term (โ‰ฅ4 yr)
Multilateral development bank financing ~5% South America, MEA Medium-term (2โ€“4 yr)

ย 

Emission-Reduction Mandates and Carbon Pricing

Governments worldwide are ratcheting carbon costs upward, creating a direct financial incentive to upgrade coal assets. The EU ETS carbon price averaged EUR 73 per ton in 2024, while Canada's federal carbon charge is legislated to reach CAD 170 per ton by 2030 [1]. These price signals make the incremental capital cost of supercritical conversions and capture retrofits economically recoverable within 5โ€“7 years for mid-size units, accelerating the Clean Coal Technology Market across regulated jurisdictions.

CCUS Retrofit Economics and Tax Incentives

Project-finance models for capture-equipped coal plants were significantly altered by the U.S. Inflation Reduction Act, which increased the 45Q credit to USD 85 per ton for geologically stored CO2 and USD 60 per ton for consumption paths [2]. A corridor of policy certainty is being created by comparable incentive frameworks in the UK's Carbon Capture Business Model and Canada's Investment Tax Credit for Carbon Capture. Between 2026 and 2035, the clean coal technology market is expected to receive a total of USD 40 billion in CCUS investment [8].

ย 

Supercritical and Ultra-Supercritical Fleet Expansion

China's 14th Five-Year Plan mandates that all new coal capacity operate at supercritical or higher steam conditions, while India's National Electricity Plan targets the retirement of 25 GW of subcritical capacity by 2032 [3][5]. These mandates directly expand the addressable market for high-efficiency boilers, turbines, and ancillary equipment sold into the Clean Coal Technology Market.

Plant Digitalization and AI-Based Controls

Digital-twin platforms and machine-learning-based combustion optimization can improve heat rates by 1.5โ€“3.0%, translating to meaningful fuel-cost savings and emission reductions [12]. Early adopters in Japan and South Korea report payback periods under 18 months for AI control retrofits, which strengthens the business case for broader plant modernization and supports growth in the Clean Coal Technology Market.

Restraints Impact Analysis

Restraint ~% Impact on CAGR Geographic Relevance Impact Timeline
Renewable-energy cost competitiveness ~โˆ’28% Global Long-term (โ‰ฅ4 yr)
ESG-driven capital withdrawal from coal ~โˆ’25% Europe, North America Short-term (โ‰ค2 yr)
Permitting and social-license barriers for CCUS ~โˆ’20% Europe, North America Medium-term (2โ€“4 yr)
High upfront capital costs for USC retrofits ~โˆ’15% South America, MEA Medium-term (2โ€“4 yr)
Technology lock-in risk and stranded-asset concern ~โˆ’12% Global Long-term (โ‰ฅ4 yr)

ย 

Renewable-Energy Cost Competitiveness

Unsubsidized levelized costs for solar PV fell below USD 30/MWh in optimal locations by 2024, and onshore wind is competitive at USD 25โ€“45/MWh across most geographies [16]. This cost trajectory pressures the economic justification for new or retrofitted coal assets, particularly where grid-scale battery storage is maturing. The Clean Coal Technology Market faces its most persistent headwind from this secular shift.

ESG-Driven Capital Withdrawal

Over 150 global financial institutions have adopted coal-exclusion policies since 2020, collectively managing more than USD 40 Trillion in assets [17]. Restricted access to project finance raises the weighted average cost of capital for coal-asset upgrades and constrains the pace of fleet modernization, especially in markets that depend on international lending for infrastructure development.

Permitting and Social-License Barriers

Due to concerns about subsurface storage liability and local community opposition, CCUS projects have protracted permitting procedures, which average 3โ€“5 years in the United States and longer in some parts of Europe [18]. Decision-making in the clean coal technology market is slowed by these delays, which also reduce the investable window for capture retrofits.

ย 

Clean Coal Technology Market Opportunities

Industrial Carbon Capture in Steel and Cement

Steelmakers and cement producers collectively account for roughly 15% of global COโ‚‚ emissions, and both sectors face tightening carbon-intensity benchmarks under the EU Carbon Border Adjustment Mechanism [14]. Retrofitting blast furnaces and clinker kilns with oxy-fuel or post-combustion capture modules represents a high-growth opportunity that extends the Clean Coal Technology Market beyond its traditional power-utility base.

Emerging-Market Fleet Modernization

Southeast Asian nations โ€” Vietnam, Indonesia, and the Philippines โ€” operate young but inefficient coal fleets averaging 10โ€“15 years of age. Multilateral financing through the Asian Development Bank's Energy Transition Mechanism and the Just Energy Transition Partnerships could unlock USD 8โ€“12 Billion for efficiency upgrades between 2026 and 2035 [15]. This represents a largely untapped geography for the Clean Coal Technology Market.

Digital Performance Optimization as a Service

OEMs and independent software vendors are increasingly offering AI-driven combustion tuning, predictive maintenance, and emissions-monitoring platforms on subscription models. This shift from one-time equipment sales to recurring-revenue service agreements expands the addressable market and creates stickier customer relationships within the Clean Coal Technology Market.

Hydrogen Co-Firing and Ammonia Blending

With a goal of 20% ammonia blending by 2030, Japan's Green Innovation Fund has set aside JPY 300 billion for ammonia co-firing trials at coal-fired power plants [21]. A parallel technology pathway that maintains the current boiler infrastructure while lowering stack emissions would be created by a successful scale-up, creating a new product category in the clean coal technology market.

ย 

Data Monetization Through Emission-Credit Registries

Plants equipped with continuous emissions monitoring and verified capture systems can generate tradable carbon credits on compliance and voluntary markets. As credit prices rise, these data-driven revenue streams improve project IRR and attract private capital into the Clean Coal Technology Market.

Clean Coal Technology Market Future Outlook

AI-Driven Autonomous Plant Operations

AI-based combustion optimization is expected to be used in 35% of supercritical and USC coal plants worldwide by 2030, up from less than 10% in 2025 [12]. To maximize efficiency while reducing NOโ‚“ and particle emissions, these systems continuously modify air-fuel ratios, soot-blower sequencing, and steam temperatures. The distinction between producers of equipment and providers of technology platforms will become increasingly hazy as the clean coal technology market incorporates software value alongside hardware.

ย 

CCUS Hub and Cluster Economics

The transition from standalone capture projects to multi-source hub-and-cluster configurations โ€” where multiple emitters share transport and storage infrastructure โ€” will drive down per-ton capture costs by an estimated 30โ€“40% by 2032 [8]. Projects like the U.S. Gulf Coast CCS corridor and the Northern Lights network in Norway are proving this model, and the Clean Coal Technology Market will benefit as hub economics make capture viable for smaller emitters.

Hydrogen-Coal Transition Pathways

Coal gasification paired with carbon capture to produce blue hydrogen represents a bridge technology that repurposes existing coal infrastructure for a hydrogen economy. The IEA projects that blue hydrogen could supply 10โ€“15% of global hydrogen demand by 2035, provided capture rates exceed 90% [25]. This pathway directly sustains demand within the Clean Coal Technology Market even as direct coal combustion for electricity declines in some regions.

ESG Reporting and Taxonomy-Aligned Investment

The EU Sustainable Finance Taxonomy and similar classification frameworks in ASEAN, Japan, and South Korea are creating explicit investment categories for transition technologies, including high-efficiency coal with capture [17]. As mandatory ESG disclosure spreads, companies operating Clean Coal Technology Market assets will need verified emission-intensity data to access green-labeled financing, driving demand for integrated monitoring, reporting, and verification systems.

Clean Coal Technology Market Segmentation

By Technology

Segment Market Share (2025) Primary Demand Driver
Subcritical 18.4% Retrofit and maintenance of legacy fleet
Supercritical 47.5% Dominant new-build and conversion standard
Ultra-Supercritical 15.8% Highest thermal efficiency (>45%) mandates
Circulating Fluidized Bed Combustion 10.2% Fuel flexibility and low-grade coal utilization
Oxy-Fuel Combustion 4.8% Capture-ready combustion demonstrations
Others 3.3% Integrated gasification combined cycle and emerging concepts

ย 

Supercritical systems remain the backbone of the Clean Coal Technology Market because they represent the best balance between proven reliability and meaningful efficiency gains over subcritical units. Operating at steam conditions of 24.1 MPa and 565ยฐC, supercritical boilers achieve thermal efficiencies of 38โ€“42%, reducing coal consumption per MWh by approximately 15% compared to subcritical predecessors [3]. Chinese and Indian state utilities have standardized on 660 MW and 800 MW supercritical units as the default configuration for new coal capacity.

Ultra-supercritical technology pushes steam conditions above 27.6 MPa and 600ยฐC, achieving thermal efficiencies beyond 45%. Although capital costs run 15โ€“20% higher than supercritical equivalents, the fuel savings and lower emission intensity deliver faster payback in high-utilization-factor environments [3]. The Clean Coal Technology Market is seeing accelerating USC adoption in Japan, South Korea, and coastal China, where fuel-import costs magnify the value of each efficiency percentage point.

By Component

Segment Key Metric Primary Demand Driver
Equipment 76.2% share (2025) Boilers, turbines, pollution-control systems
Services 8.55% CAGR (2026โ€“2035) EPC, O&M, digital optimization contracts

ย 

The equipment segment dominates the Clean Coal Technology Market because greenfield builds and major retrofits require large capital outlays for boilers, steam turbines, flue-gas treatment systems, and CCUS modules. Services, however, represent the faster-growing revenue pool as the global installed base of supercritical and USC units expands. Long-term service agreements, performance guarantees, and digitalization contracts now account for a rising share of OEM revenue.

By End-User Industry

Segment Key Metric Primary Demand Driver
Power Utilities 78.8% share (2025) Grid-scale baseload generation
Iron and Steel 9.05% CAGR (2026โ€“2035) Blast-furnace emission mandates
Cement USD 0.31 Billion (2025) Clinker-kiln capture demonstrations
Chemicals and Fertilizers USD 0.19 Billion (2025) Coal-to-chemicals gasification
District Heating USD 0.12 Billion (2025) Northern China and Eastern European networks

ย 

Power utilities command the largest share of the Clean Coal Technology Market because coal-fired electricity generation remains the single largest application of coal combustion infrastructure globally. Grid operators in China, India, and Southeast Asia continue to add supercritical capacity to meet baseload demand that variable renewables cannot yet serve around the clock. Iron and steel applications, meanwhile, are poised for the fastest growth as the EU's Carbon Border Adjustment Mechanism forces steelmakers to decarbonize blast-furnace operations or face punitive levies on exports [14].

Regional Market Share Analysis

Region Revenue Share (2025) Primary Investment Themes
Asia-Pacific 42.1% Fleet expansion, USC mandates, industrial capture
Europe 25.0% ETS compliance, plant retrofits, phase-out planning
North America 18.0% 45Q incentives, CCUS hubs, baseload reliability
South America 8.4% Thermal-generation diversification, multilateral finance
Middle East & Africa 6.5% Energy security, industrial coal-to-power programs
Total 100.0% โ€”

The Clean Coal Technology Market spans five major regions, each shaped by distinct policy regimes, coal-fleet demographics, and investment cycles.

ย 

North America

Country CAGR (2026โ€“2035) Key Driver
US 7.82% 45Q tax credits and DOE CCUS demonstration hubs
Canada 6.95% Federal carbon-capture investment tax credit
Mexico 5.10% CFE coal-fleet efficiency upgrades

ย 

The United States remains the primary engine of North American growth in the Clean Coal Technology Market, with the DOE awarding USD 2.5 Billion to regional CCUS hub projects in 2024 alone [11]. Canada's parallel Investment Tax Credit for CCUS โ€” offering up to 60% cost coverage for capture equipment โ€” is catalyzing projects in Alberta's industrial corridor, while Mexico's state utility CFE is exploring supercritical conversions at its Petacalco and Carbรณn II complexes [22].

Europe

Country Share of Regional Revenue (2025) Key Driver
Germany 24.5% Lignite transition pathway and capture R&D
UK 18.2% Carbon Capture Business Model contracts
France 8.9% Industrial decarbonization roadmap
Italy 7.6% Sardinia and Brindisi retrofit projects
Spain 6.8% Just Transition Fund allocations
Nordic Countries 5.4% Bio-CCS and waste-to-energy capture
Russia 15.8% Siberian fleet expansion
Rest of Europe 12.8% Eastern EU cohesion fund investments

ย 

The European Clean Coal Technology Market is shaped by the dual imperative of meeting ETS Phase IV targets while maintaining grid stability during the renewable transition. The UK's Track-1 and Track-2 CCUS clusters represent a combined capture capacity of over 20 MtCOโ‚‚/year, and Germany's lignite transition pathway includes earmarked federal funds for capture demonstrations at Jรคnschwalde and Schwarze Pumpe [10][23].

Asia-Pacific

Country Share of Regional Revenue (2025) Key Driver
China 48.5% USC mandates under the 14th Five-Year Plan
India 22.3% National Mission for Clean Coal Technologies
Japan 12.8% Ammonia co-firing demonstrations
South Korea 8.1% 10th Basic Plan coal-transition pathway
ASEAN 5.6% ADB Energy Transition Mechanism
Rest of Asia-Pacific 2.7% Emerging industrial-capture projects

ย 

Asia-Pacific dominates the Clean Coal Technology Market because China and India together operate over 60% of the world's coal-fired capacity. China's Energy Administration approved 106 GW of new coal capacity in 2023 โ€” nearly all at supercritical or higher parameters โ€” while India's Central Electricity Authority is targeting USC boiler deployments at 12 upcoming greenfield sites [3][5].

South America

Country CAGR (2026โ€“2035) Key Driver
Brazil 5.38% Jorge Lacerda's complex modernization
Argentina 4.72% Rรญo Turbio expansion
Rest of South America 4.15% Colombia and Chile mine-mouth efficiency projects

ย 

South America's position in the Clean Coal Technology Market is modest but growing. Brazil's Engie-operated Jorge Lacerda complex โ€” the largest coal station in Latin America โ€” is evaluating supercritical turbine retrofits that could extend plant life by 15 years, and multilateral lenders are structuring concessional finance packages for emission-reduction upgrades across the region [15].

Middle East & Africa

Country Share of Regional Revenue (2025) Key Driver
South Africa 52.3% Eskom fleet recovery and Medupi/Kusile optimization
Saudi Arabia 12.4% Industrial coal-to-power diversification
UAE 9.8% Hassyan clean-coal power station
Egypt 8.7% Hamrawein power complex
Rest of MEA 16.8% Emerging-market industrial demand

ย 

South Africa anchors the MEA segment of the Clean Coal Technology Market, where Eskom's troubled Medupi and Kusile supercritical stations โ€” representing 9.6 GW of capacity โ€” are undergoing remediation programs funded partly through the USD 8.5 Billion Just Energy Transition Partnership [24]. The UAE's 2.4 GW Hassyan plant demonstrates that even hydrocarbon-rich Gulf states see a role for efficient coal generation in baseload diversification.

Clean Coal Technology Market By Region, 2025-2035

Competitive Benchmarking

The Clean Coal Technology Market exhibits low concentration, with the top five players accounting for an estimated 32โ€“38% of global revenue. The competitive field includes diversified power-equipment conglomerates, regional state-owned manufacturers, and specialized CCUS technology developers. Strategic positioning is shifting from pure hardware supply toward integrated solutions that bundle equipment, digital platforms, and long-term service agreements.

Company Est. Revenue Share Range Key Offerings Strategic Positioning
GE Vernova ~7โ€“10% USC steam turbines, CCUS integration, digital controls Global full-line OEM with a strong services backlog
Mitsubishi Power ~6โ€“9% USC boilers, ammonia co-firing, M-Series gas-steam hybrid Technology leader in ultra-high-efficiency parameters
Shanghai Electric ~5โ€“8% Supercritical and USC boiler islands, turbine-generator sets Dominant Chinese domestic supplier with Belt & Road exports
Harbin Electric ~4โ€“7% 1,000 MW USC units, flue-gas desulfurization systems Chinese state-owned, large-scale project execution
Dongfang Electric ~4โ€“6% Supercritical boilers, steam turbines, CFB units Diversified energy-equipment manufacturer
Doosan Enerbility ~3โ€“5% USC boilers, environmental systems, and plant digitalization Korean market leader expanding into Southeast Asia
Babcock & Wilcox ~2โ€“4% Oxy-fuel combustion, BrightLoop chemical looping, CCUS U.S.-based capture-technology specialist
IHI Corporation ~2โ€“4% Boilers, ammonia co-firing burners, SCR systems Japan-based; leading ammonia-blending R&D
Sumitomo SHI FW ~2โ€“3% CFB boilers, biomass co-firing, waste-to-energy CFB technology specialist for low-grade fuels
BHEL ~2โ€“3% Supercritical boiler-turbine-generator packages Indian state-owned; dominant domestic market share

ย 

Recent News & Developments

ย 

  • Mitsubishi Power (January 2025): Completed a 20% ammonia co-firing demonstration at JERA's Hekinan Unit 4 in Japan, achieving continuous operation for over 200 hours with no measurable increase in NOโ‚“ emissions [21].
  • U.S. Department of Energy (November 2024): Awarded USD 890 million in grants to four regional CCUS hub projects under the Bipartisan Infrastructure Law, each targeting capture capacity of 2โ€“4 MtCOโ‚‚/year from coal and industrial sources [11].

ย 

  • Doosan Enerbility (June 2024): Signed a memorandum of understanding with Indonesia's PLN to evaluate supercritical boiler retrofits at three existing subcritical coal plants totaling 2,100 MW [15].
  • UK Government (April 2024): Announced Track-2 CCUS cluster selections covering Teesside and Humberside, with a combined capture capacity of 12 MtCOโ‚‚/year and government support totaling GBP 1.2 billion [23].
  • BHEL (February 2024): Delivered the boiler for India's first indigenous 800 MW USC unit at NTPC Darlipali Stage-II, marking a milestone in local manufacturing capability for the Clean Coal Technology Market [5].
  • Babcock & Wilcox (October 2023): Announced a commercial-scale partnership with Southern Company to deploy its BrightLoop chemical-looping technology at Plant Barry in Alabama, targeting 95% COโ‚‚ capture rates [8].

Clean Coal Technology Market Report Scope

Parameter Detail
Market Scope Global Clean Coal Technology Market covering combustion, capture, and emission-control systems
Study Period 2021โ€“2035
CAGR 5.63% (2026โ€“2035)
Market Size (2025) USD 4.89 Billion
Market Size (2035) USD 8.46 Billion
Fastest Growing Technology Ultra-Supercritical
Fastest Growing End-User Iron and Steel
Fastest Growing Region North America
Companies Profiled 10 (GE Vernova, Mitsubishi Power, Shanghai Electric, Harbin Electric, Dongfang Electric, Doosan Enerbility, Babcock & Wilcox, IHI Corporation, Sumitomo SHI FW, BHEL)
Valuation Currency USD Billion

ย 

FAQs

How do 45Q credit economics compare to EU ETS carbon pricing for justifying capture retrofits?

The 45Q credit offers a fixed USD 85/ton payment, providing cost certainty, while EU ETS prices fluctuate around EUR 70/ton and carry market risk. U.S. projects typically achieve faster financing closure because the fixed credit simplifies financial modeling [2].

What minimum plant capacity factor makes a supercritical-to-USC boiler conversion financially viable?

Most project-finance models require a minimum 65% capacity factor to deliver acceptable returns on USC conversion capital within 8โ€“10 years. Plants operating below 55% utilization rarely justify the upgrade economics [3].

How do OEM long-term service agreements affect the total cost of ownership for clean coal assets?

LTSAs typically reduce unplanned outage hours by 20โ€“30% and lock in parts pricing, lowering lifecycle costs by an estimated 12โ€“18% compared to time-and-materials maintenance approaches [12].

What role does coal rank play in selecting the appropriate clean coal combustion technology?

High-rank bituminous coals suit supercritical and USC pulverized-coal boilers, while low-rank lignites and sub-bituminous coals perform better in circulating fluidized bed systems designed for high-moisture fuels [3].

How are carbon-credit revenues changing project IRR for CCUS-equipped coal plants?

Verified capture credits trading at USD 40โ€“85/ton add 2โ€“5 percentage points to project IRR, often lifting marginal projects above the 10% equity-return threshold required by infrastructure investors [8].

What supply-chain bottlenecks currently constrain USC boiler deployment timelines?

Nickel-based superalloy tubes rated for 700ยฐC-class steam conditions face 18โ€“24 month lead times, and only a handful of global forging facilities can produce the required header and piping components [19].

How does ammonia co-firing interact with existing NOโ‚“ control systems at coal plants?

Ammonia combustion can increase NOโ‚“ formation at flame temperatures above 1,800ยฐC, but staged-combustion burner designs and selective catalytic reduction systems manage emissions within regulatory limits at blending ratios up to 20% [21]. ย  ย 
Author
Author
Author Profile
Priya Nagrale LinkedIn
Senior Research Analyst
With an experience of over five years in market research industry (Chemicals & Materials domain), I gather and analyze market data from diverse sources to produce results, which are then presented back to a client. Also, provide recommendations based on the findings. As a Senior Research Analyst, I perform quality checks (QC) for market estimations, QC for reports, and handle queries and work extensively on client customizations. Also, handle the responsibilities of client proposals, report planning, report finalization, and execution
Download Free Sample

Kindly complete the form below to receive a free sample of this Report

Download PDF ×

We do not share your information with anyone. However, we may send you emails based on your report interest from time to time. You may contact us at any time to opt-out.