Segmentation Quick Reference
| Dimension | Sub-Segments | Dominant Segment | Fastest Growing Segment |
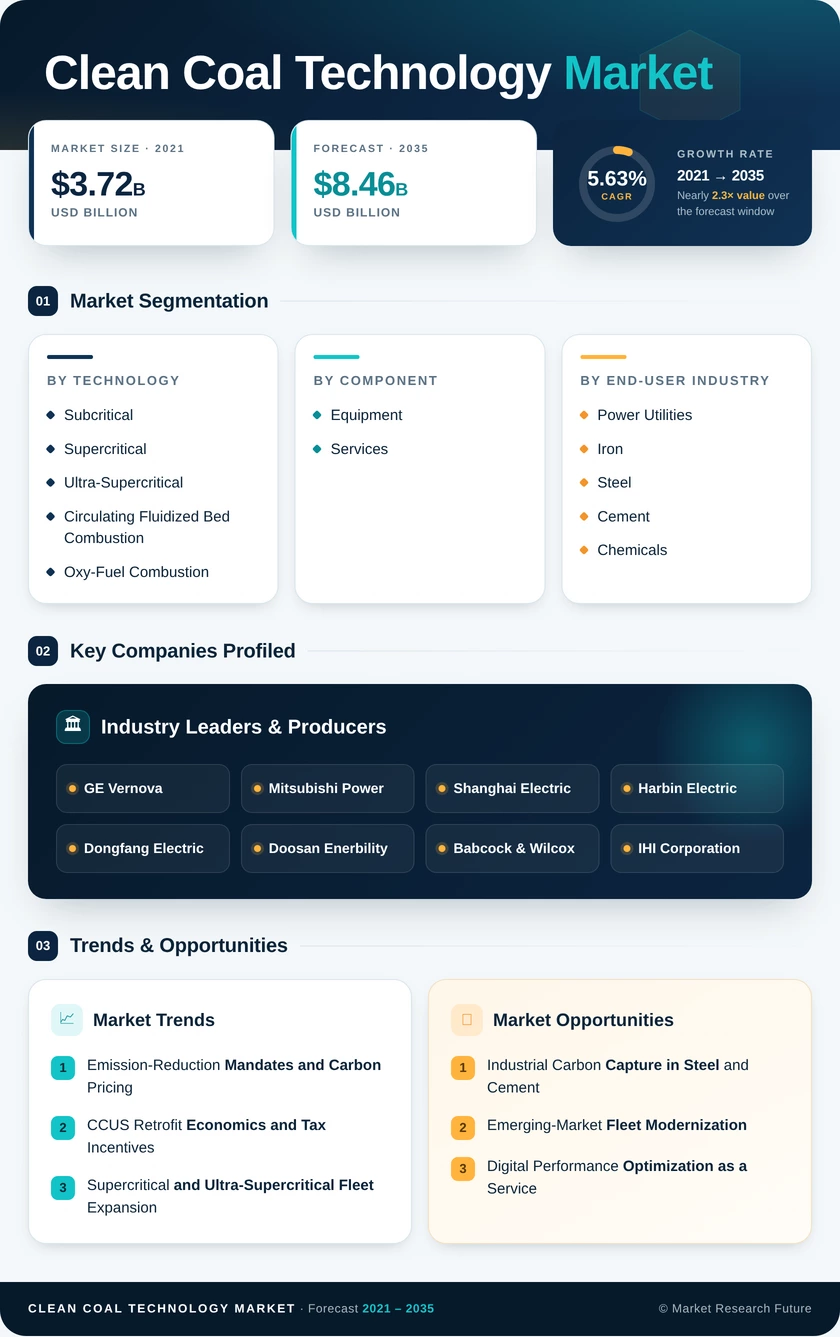
| Technology | Subcritical, Supercritical, Ultra-Supercritical, Circulating Fluidized Bed Combustion, Oxy-Fuel Combustion, Others | Supercritical | Ultra-Supercritical |
| Component | Equipment, Clean Coal Technology Markets | Equipment | Clean Coal Technology Markets |
| End-User Industry | Power Utilities, Iron and Steel, Cement, Chemicals and Fertilizers, District Heating | Power Utilities | Iron and Steel |
| Geography | North America, Europe, Asia-Pacific, South America, Middle East & Africa | Asia-Pacific | North America |
Market Segmentation Overview
By Technology
| Sub-Segment | Key Trend |
| Subcritical | Declining share as legacy units retire or convert to higher-efficiency parameters |
| Supercritical | Standard specification for new-build coal capacity across China, India, and Southeast Asia |
| Ultra-Supercritical | Rapid adoption driven by mandates for thermal efficiency exceeding 45% |
| Circulating Fluidized Bed Combustion | Growing in industrial applications using low-rank coals and opportunity fuels |
| Oxy-Fuel Combustion | Advancing through pilot programs targeting high-purity CO₂ streams for capture |
| Others | Includes integrated gasification combined cycle and early-stage chemical looping concepts |
Supercritical technology remains the default choice for utilities balancing cost, reliability, and emission compliance, while ultra-supercritical units are gaining ground wherever policy and fuel economics justify the higher upfront investment.
By Component
| Sub-Segment | Key Trend |
| Equipment | Boiler-turbine-generator packages, emission-control systems, and CCUS modules drive the majority of capital expenditure |
| Clean Coal Technology Markets | Long-term service agreements, digital optimization platforms, and EPC contracts are expanding as the installed base grows |
Equipment spending continues to dominate during the current wave of fleet expansion and retrofit activity, but services are capturing an increasing share of total lifecycle value.
By End-User Industry
| Sub-Segment | Key Trend |
| Power Utilities | Largest end-user segment; baseload coal generation remains critical in Asia-Pacific and parts of Africa |
| Iron and Steel | Fastest-growing segment driven by CBAM compliance and blast-furnace decarbonization mandates |
| Cement | Clinker-kiln carbon capture demonstrations are scaling from pilot to commercial stage |
| Chemicals and Fertilizers | Coal-to-chemicals gasification projects are expanding in China and South Africa |
| District Heating | Combined heat-and-power clean coal systems are growing in Northern China and Eastern Europe |
Power utilities will continue to anchor demand, but industrial end-users — particularly steel and cement — represent the highest-growth frontier as carbon-intensity regulations tighten across manufacturing sectors.