Digital Holography Market

Digital Holography Market Size, Share and Research Report By Application (Medical Imaging, Data Storage, Microscopy, Particle Characterization), By Technology (Computer-Generated Holography, Digital Holographic Interferometry, Holographic Displays), By End Use (Healthcare, Education, Military, Industrial), By Component (Laser Systems, Sensors, Software, Optical Elements) and By Regional (North America, Europe, South America, Asia Pacific, Middle East and Africa) - Industry Forecast Till 2035
ID: MRFR/SEM/2866-HCR
200 Pages
Nirmit Biswas, Aarti Dhapte
Last Updated: May 28, 2026
 

Market Summary

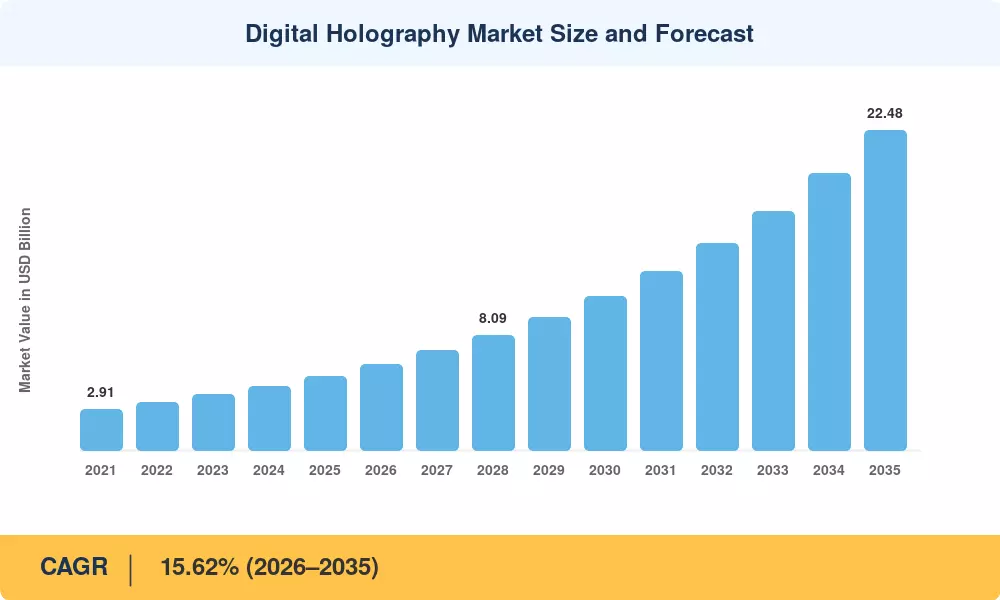
The Digital Holography Market was valued at USD 5.22 billion in 2025 and is projected to reach USD 5.97 billion in 2026 before climbing to USD 22.48 billion by 2035, registering a CAGR of 15.62% during 2026–2035. This trajectory reflects a sharp acceleration driven by defense modernization budgets — the U.S. Department of Defense allocated over USD 1.2 billion toward holographic LiDAR and situational-awareness programs across FY2024–2025 [2] — alongside expanding clinical adoption of digital holographic microscopy for research in pathology labs across Japan and South Korea [3].

A generational shift is underway as legacy 2D imaging, fluorescence-based microscopy, and mechanical head-up displays give way to coherent-light holographic optical elements for AR systems, phase-spatial light modulators for holography, and volumetric telepresence platforms. The deployment of Versatile Video Coding (H.266/VVC) slashed holographic data payloads by roughly 40%, making real-time holographic 3D display technology viable over commercial 5G networks for the first time [4]. Automakers in Germany and South Korea have signed multi-year contracts for waveguide-based holographic HUDs, pulling investment into series production lines.

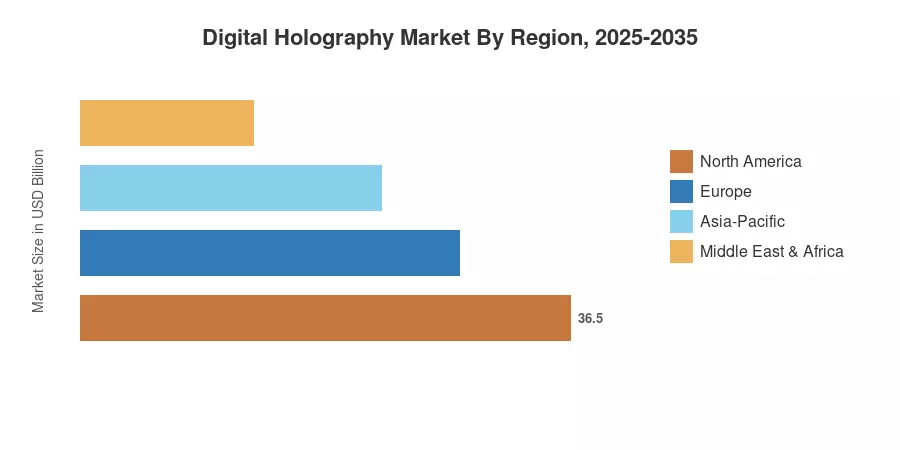
North America commands the largest share of the Digital Holography Market at approximately 44.8% of 2025 revenue, anchored by U.S. federal R&D and Silicon Valley start-up activity. Asia-Pacific is the fastest-growing region with a projected CAGR of 17.05%, fueled by Chinese retail volumetric advertising and Japanese biophotonics grants. Europe holds the second-largest position, contributing roughly 27% of global revenue through German automotive and Nordic defense programs As holographic data storage research matures and bandwidth costs fall, the Digital Holography Market is positioned to penetrate verticals that were economically inaccessible just three years ago.


Key Report Takeaways

• By Offering

  • Hardware accounted for 65.5% of Digital Holography Market revenue in 2025, driven by spatial light modulator shipments and holographic display panel demand
  • Software platforms are advancing at a 15.78% CAGR through 2035, as cloud-based holographic reconstruction and AI-enhanced phase-retrieval algorithms gain traction

• By Technique

  • Off-axis holography led with USD 3.68 billion in 2025 revenue, reflecting its dominance in digital holographic microscopy for research and industrial metrology
  • Synthetic-aperture methods are expanding fastest at a 17.56% CAGR, supported by demand for wide-field-of-view holographic optical elements for AR systems

• By Application

  • Digital holographic displays captured 47.8% of the Digital Holography Market in 2025, with telepresence solutions forecast to grow at 16.28% CAGR

• By End-User Vertical

  • Medical and life sciences held 33.2% share in 2025, leveraging label-free cell analysis powered by phase-spatial light modulators for holography
  • The automotive sector is projected to grow at 16.62% CAGR as holographic HUD integration scales across premium and mid-tier vehicles

• By Region

  • North America dominated the Digital Holography Market with 44.8% share in 2025
  • Asia-Pacific is projected to rise at a 17.05% CAGR to 2035, outpacing all other regions


Market Size Chart
Our Impact
Enabled $4.3B Revenue Impact for Fortune 500 and Leading Multinationals
Partnering with 2000+ Global Organizations Each Year
30K+ Citations by Top-Tier Firms in the Industry
 

Driver Impact Analysis

Defense and Intelligence Holographic Programs

U.S. DARPA and Army Futures Command have channeled over USD 800 million into holographic sensing and 3D battlefield-visualization programs since 2023, including the Holographic LiDAR for Autonomous Navigation (HLAN) initiative [2]. NATO allies — notably the UK's DSTL and France's DGA — mirrored this investment with combined allocations exceeding EUR 350 million for counter-UAS holographic identification systems. These contracts demand ruggedized phase-spatial light modulators for holography that tolerate extreme vibration and temperature cycling, pulling R&D spending upstream into component hardening. The Digital Holography Market benefits directly because defense procurement cycles create multi-year revenue floors for hardware integrators.

Medical and Life-Science Holographic Microscopy

For next-generation biophotonic platforms, Japan's AMED allotted ¥48 billion (about USD 320 million) between 2023 and 2027; the largest single tranche went to digital holographic microscopy for research [3]. This was supplemented by a KRW 95 billion program from South Korea's KIST that focused on label-free blood-cell morphology screening. In contrast to fluorescence-based methods, holographic microscopy reduces sample preparation time by 70% by capturing quantitative phase maps without staining. This is a significant advantage in high-throughput clinical settings. These initiatives are pushing the digital holography market outside of its conventional research-lab niche and into regular diagnostics.


Automotive Holographic HUD Integration

BMW, Hyundai-Kia, and Toyota have collectively awarded holographic HUD contracts worth over USD 1.5 billion to tier-1 suppliers for model-year 2026–2029 vehicle platforms [6]. The shift from traditional combiner-HUD to waveguide-based holographic optical elements for AR systems allows wider field-of-view overlays — navigation prompts, ADAS warnings, and augmented lane markings — without the bulky optics of legacy systems. Germany's Federal Ministry for Digital and Transport included holographic AR cockpit standardization in its 2024 Automotive Innovation Strategy, accelerating OEM timelines by roughly 18 months.

Volumetric Retail Advertising and 5G Telepresence

Southeast Asian retail chains committed more than USD 220 million in holographic display installation budgets in 2024 after Chinese tier-1 malls showed that volumetric holographic advertising increased featured-product sales by almost 40% [7]. Holographic 3D display technology may function within consumer broadband limits, as demonstrated by the simultaneous debut of 5G holographic telepresence pilots powered by VVC compression by three major U.S. telecom companies. The addressable market for the digital holography market has expanded significantly beyond industrial and scientific end users because of these two demand signals: physical retail immersion and remote communication.


Restraints Impact Analysis

Component Cost Barriers

Holographic systems are significantly more expensive than traditional 2D displays, with a single high-resolution phase-spatial light modulator capable of 4K holographic reconstruction still costing between USD 8,000 and USD 25,000 at low volumes [8]. Depending on the need for wavelength stability, coherent laser diode arrays cost an additional $2,000 to $6,000 per unit. Component costs may limit adoption in price-sensitive consumer and mid-tier automotive segments of the digital holography market until wafer-scale LCOS production reaches economic equivalents to mainstream display panels, most likely after 2029.


Format Fragmentation and Interoperability Gaps

No universal standard exists for holographic data interchange. The JPEG Pleno initiative proposed a framework, but adoption remains patchy — fewer than 15% of holographic display vendors supported the draft standard as of late 2024 [10]. This fragmentation forces integrators to maintain proprietary pipelines for holographic optical elements for AR systems and telepresence platforms, inflating development costs and slowing cross-platform content creation. The absence of a dominant standard also complicates holographic data storage research, where encoding efficiency depends on agreed-upon data structures.

Eye-Safety Regulations

The IEC 60825-1 and FDA CDRH 21 CFR 1040 standards impose strict limits on laser power density reaching the retina [11]. Consumer-facing holographic 3D display technology must remain within Class 1 or Class 1M boundaries, which constrain brightness and viewing angle. Compliance testing adds 4–8 months to product certification timelines in North America and Europe, delaying market launches and eroding first-mover advantages in the Digital Holography Market.


Opportunities

Emerging-Market Retail and Entertainment Deployments

India's USD 95 billion organized retail sector and Brazil's mall-expansion cycle present greenfield opportunities for volumetric holographic advertising. Digital holographic displays that proved ROI in Chinese flagship malls can be localized at 30–40% lower labor costs in these markets, accelerating payback below 18 months The Digital Holography Market stands to capture an incremental USD 600–900 million in these geographies by 2032.

Holographic Data Storage Commercialization

Microsoft Research and a consortium of Japanese electronics firms have invested over USD 450 million since 2022 in holographic data storage research targeting cold-archive applications [9]. A single 10 cm disc can theoretically store 1 TB using angular multiplexing — a 50× density improvement over Blu-ray. If pilot-line yields reach commercial viability by 2030, this vertical alone could add USD 1.2 billion in annual revenue to the Digital Holography Market

AR/MR Headset Integration

Holographic optical components for augmented reality systems are being investigated by Apple Vision Pro, Meta Quest, and Samsung XR platforms as a potential replacement for traditional waveguide combiners [14]. The change would improve user comfort by removing rainbow artifacts and increasing eye-box width by 40%. This is a high-margin potential in the Digital Holography Market because component vendors who demonstrate certification on these platforms will be able to demand premium ASPs and multi-year supply agreements.


AI-Driven Holographic Reconstruction

Deep-learning phase-retrieval algorithms have reduced holographic reconstruction computation by 10× compared with iterative Fourier methods [13]. Cloud GPU infrastructure — particularly NVIDIA's H100 and successor architectures — enables real-time holographic rendering for telepresence without on-device supercomputing. This opens a DaaS (Display-as-a-Service) business model where providers monetize reconstruction compute on a per-session basis, creating recurring revenue streams.

Point-of-Care Medical Diagnostics

Portable digital holographic microscopy for research is migrating into point-of-care settings — malaria blood-smear screening in sub-Saharan Africa, rapid sperm morphology assessment in fertility clinics, and intraoperative tissue margin analysis [3]. WHO pre-qualification of a holographic microscope platform would unlock procurement channels worth USD 200–350 million annually across low- and middle-income countries


Future Outlook

AI-Augmented Holographic Workflows

By 2030, generative AI models will synthesize holographic 3D display technology content from 2D video feeds in near-real time, collapsing the production pipeline from hours to seconds [13]. NVIDIA and Google DeepMind have each published transformer architectures for neural holographic rendering that reduce computational load by two orders of magnitude. The Digital Holography Market will shift from hardware-centric to software-and-compute-centric value capture as these models commoditize reconstruction.

Holographic Data Storage at Hyperscale

Microsoft's Project HSD targets a 1 PB holographic disc cartridge by 2032, leveraging angular and wavelength multiplexing across a 14 cm polymer substrate [9]. If production costs fall below USD 0.005/GB — competitive with tape — hyperscalers will pull holographic data storage research into mainstream cold-archive tiers. This inflection would add an entirely new revenue vertical to the Digital Holography Market, independent of display and imaging demand.

Spatial Computing and Holographic AR Ecosystems

Apple, Meta, and Samsung are converging on holographic optical elements for AR systems as the successor to diffractive waveguide combiners [14]. The transition promises a 3× wider eye-box and eliminates color uniformity issues that plague current architectures. The IEC TC 110 working group is drafting holographic AR display safety standards expected by 2028, which will unlock mass-market certification and accelerate OEM adoption.

Sustainability and Green Photonics

Holographic inspection systems consume up to 60% less energy than mechanical coordinate-measuring machines in automotive QA lines, aligning with EU Ecodesign and ISO 14001 mandates [16]. As ESG reporting requirements expand — the EU Corporate Sustainability Reporting Directive covers 50,000+ firms by 2026 — manufacturers will favor holographic metrology for its lower carbon footprint. Phase-spatial light modulators for holography built on lead-free piezoelectric substrates also respond to RoHS tightening, positioning the Digital Holography Market as an enabler of green manufacturing.


Market Segmentation

By Offering

Segment Market Share (2025) Primary Demand Driver
Hardware 65.5% Spatial light modulators, laser sources, holographic display panels
Software 34.5% Cloud-based reconstruction, AI phase retrieval, holographic content management


Hardware dominates the Digital Holography Market because every deployment — whether a holographic HUD in a vehicle cockpit or a digital holographic microscopy for a research platform in a clinical lab — requires precision optical components that carry high ASPs. Phase-spatial light modulators for holography alone represent over 30% of the system BOM cost. Yet the software segment is growing faster, registering a 15.78% CAGR as cloud-based holographic reconstruction democratizes access to compute-intensive processing. AI-driven phase-retrieval algorithms have reduced reconstruction latency from minutes to milliseconds, enabling real-time telepresence and online quality inspection without dedicated GPU hardware on-premises.

By Technique

Segment Key Metric Primary Demand Driver
Off-Axis Holography USD 3.68 Billion (2025) Proven reliability for microscopy, metrology, and display
In-Line Holography 14.3% CAGR (2026–2035) Particle-field analysis, fluid dynamics research
Synthetic-Aperture Holography 17.56% CAGR (2026–2035) Wide-FOV holographic optical elements for AR systems


Off-axis holography retains revenue leadership in the Digital Holography Market because its separated reference beam simplifies phase extraction, making it the default configuration for digital holographic microscopy for research and industrial surface inspection. Synthetic-aperture methods are gaining ground rapidly as AR/MR headset makers require holographic optical elements for AR systems with field-of-view specifications that single-aperture systems cannot meet. By stitching together multiple sub-holograms, synthetic-aperture techniques achieve diffraction-limited resolution across 60°+ FOV — a capability that attracted over USD 280 million in venture funding during 2024.

By Application

Segment Key Metric Primary Demand Driver
Digital Holographic Displays 47.8% share (2025) Retail signage, entertainment, automotive HUDs
Holographic Microscopy USD 1.12 Billion (2025) Medical diagnostics, materials science
Telepresence 16.28% CAGR (2026–2035) Enterprise communication, remote surgery visualization
Holographic Data Storage 18.3% CAGR (2026–2035) Cold-archive, hyperscale data centers


Digital holographic displays anchor the largest share of the Digital Holography Market, spanning holographic 3D display technology for retail advertising, event staging, and automotive HUD overlays. The telepresence subsegment is accelerating as VVC codecs and 5G coverage lower the bandwidth barrier that historically confined holographic communication to controlled lab environments.

By End-User Vertical

Segment Key Metric Primary Demand Driver
Medical & Life Sciences 33.2% share (2025) Label-free cell analysis, surgical navigation
Aerospace & Defense USD 1.08 Billion (2025) Holographic LiDAR, 3D battlefield visualization
Automotive 16.62% CAGR (2026–2035) Holographic AR HUDs, QA inspection
Commercial & Retail USD 0.54 Billion (2025) Volumetric advertising, product visualization
Others (Telecom, Education, Energy) 14.9% CAGR (2026–2035) Telepresence, training simulations, pipeline inspection


Medical and life sciences represent the largest vertical within the Digital Holography Market, driven by hospitals and research centers adopting digital holographic microscopy for research to replace fluorescence workflows. The automotive sector is growing fastest as OEMs transition from combiner HUDs to full-windshield holographic optical elements for AR systems.


Regional Market Share Analysis

Region Share of Global Revenue (2025) Primary Investment Themes
North America 44.8% Defense holographic LiDAR, telepresence, holographic data storage research
Europe 27.0% Automotive holographic HUDs, medical imaging, defense sensing
Asia-Pacific 19.5% Retail volumetric displays, biophotonics grants, consumer electronics
South America 4.8% Retail digitization, academic research partnerships
Middle East & Africa 3.9% Defense procurement, smart-city pilots
Total 100%  

The Digital Holography Market exhibits pronounced regional variation tied to defense spending intensity, healthcare R&D maturity, and consumer-electronics manufacturing scale. North America remains the dominant region, while Asia-Pacific is growing fastest due to government stimulus, manufacturing capacity, and rapid retail digitization.


North America

Country Key Metric Key Driver
US 78.4% of regional share DARPA/DoD holographic LiDAR, 5G telepresence pilots
Canada 13.2% CAGR (2026–2035) NRC photonics grants, clinical holographic microscopy adoption
Mexico USD 0.11 Billion (2025) Nearshoring of optical component assembly


The United States anchors North American dominance through overlapping defense, telecom, and venture capital ecosystems. Silicon Valley start-ups secured over USD 680 million in Series A–C funding for holographic 3D display technology and telepresence platforms during 2023–2024. Canada's National Research Council expanded its Photonics Fabrication Centre in Ottawa, targeting GaN-on-Si phase-spatial light modulators for holography. Mexico's contribution remains modest but is growing as U.S.-based OEMs relocate optical subassemblies to Nuevo León and Jalisco clusters.

Europe

Country Key Metric Key Driver
Germany USD 0.52 Billion (2025) Premium automotive holographic HUD integration
UK 16.1% CAGR (2026–2035) DSTL defense holography contracts, university spin-outs
France 11.6% of regional share DGA defense sensing, CEA-Leti photonics R&D
Italy USD 0.09 Billion (2025) Aerospace holographic inspection systems
Spain 12.8% CAGR (2026–2035) EU-funded smart-city holographic signage pilots
Nordic Countries 8.2% of regional share Biomedical holographic microscopy, cleantech applications
Russia USD 0.05 Billion (2025) Military holographic reconnaissance programs
Rest of Europe 9.4% of regional share Academic photonics research, SME integrators


Germany's premium automakers have been the single largest demand driver in Europe's Digital Holography Market, with BMW and Mercedes-Benz committing to holographic AR windshield overlays across their electric-vehicle lineups from 2027 [6]. The UK's Defence Science and Technology Laboratory (DSTL) awarded GBP 180 million in contracts for holographic optical elements for AR systems in soldier-mounted displays. France's CEA-Leti continues to push the frontier of nanoimprinted holographic components, with spin-off ventures commercializing diffractive elements for LiDAR and telecom wavelength management.

Asia-Pacific

Country Key Metric Key Driver
China 38.4% of regional share Volumetric retail advertising, consumer electronics manufacturing
India 18.9% CAGR (2026–2035) Organized retail expansion, ISRO holographic inspection
Japan USD 0.24 Billion (2025) AMED biophotonics grants, digital holographic microscopy for research
South Korea 17.2% CAGR (2026–2035) KIST label-free cell analysis, Samsung XR components
ASEAN 6.8% of regional share Retail holographic signage, smart-city pilots
Rest of Asia-Pacific USD 0.06 Billion (2025) Academic research, early-stage defense programs


Asia-Pacific is the fastest-growing theater for the Digital Holography Market, propelled by China's tier-1 mall deployments that proved volumetric advertising can measurably lift sales. Japan's AMED-funded digital holographic microscopy for research programs has spawned three commercial spin-offs since 2023, each targeting label-free hematology analyzers. South Korea's investment in holographic optical elements for AR systems — channeled through KIST and Samsung's Advanced Institute of Technology — positions the country as a key component supplier for next-generation mixed-reality headsets. India's growth is early-stage but accelerating rapidly, as organized retailers and ISRO both explore holographic visualization.

South America

Country Key Metric Key Driver
Brazil 62.5% of regional share Mall-based holographic advertising, academic photonics labs
Argentina 13.5% CAGR (2026–2035) University holographic imaging research
Rest of South America USD 0.04 Billion (2025) Early-stage retail and education pilots


Brazil accounts for the bulk of South America's Digital Holography Market activity, with São Paulo's luxury retail corridor adopting holographic 3D display technology for brand activations. Argentina's CONICET photonics group has published peer-reviewed work on cost-reduced digital holographic microscopy for research, and local start-ups are commercializing portable holographic inspection tools for agri-food quality control.

Middle East & Africa

Country Key Metric Key Driver
Saudi Arabia 35.8% of regional share NEOM smart-city holographic installations
UAE 14.8% CAGR (2026–2035) Expo-driven immersive experience venues
South Africa USD 0.02 Billion (2025) Academic research, mining inspection prototypes
Egypt 12.1% CAGR (2026–2035) Government digitization initiatives
Rest of MEA 18.7% of regional share Defense procurement, early pilot deployments


Saudi Arabia's NEOM project has earmarked over USD 140 million for holographic wayfinding, immersive entertainment, and urban-planning visualization, making it a bellwether for the Digital Holography Market in the Middle East [15]. The UAE's post-Expo 2020 legacy venues continue to invest in volumetric display upgrades, and Abu Dhabi's Tawazun Economic Council is evaluating holographic simulation for defense training.


Regional Market Share
 

Competitive Benchmarking

The Digital Holography Market exhibits low concentration, with an estimated HHI below 600 and the top five players collectively holding roughly 28–35% of global revenue. The landscape is fragmented across display hardware specialists, photonics component manufacturers, software-platform vendors, and vertically integrated defense contractors. Competition intensifies at the component level — particularly around phase-spatial light modulators for holography — where a handful of LCOS and MEMS-mirror suppliers hold outsized influence over system integrators' BOM costs.

Company Est. Revenue Share Range Key Offerings Strategic Positioning
Lyncée Tec SA ~4–6% Digital holographic microscopes, reflection DHM Life-science and semiconductor metrology leader
Holoxica Ltd ~3–5% Volumetric 3D displays, holographic 3D display technology Medical visualization and defense simulation
Phase Holographic Imaging (PHI) ~3–5% HoloMonitor live-cell imaging Label-free cell biology R&D platforms
RealView Imaging ~3–5% Holographic AR surgical displays Operating-room holographic visualization
Geola Digital UAB ~2–4% Pulsed-laser holographic printers Large-format holographic print and security
Jasper Display Corp. ~3–5% LCOS phase-spatial light modulators for holography Core SLM component supplier to system integrators
Hamamatsu Photonics ~4–7% SLMs, image sensors, laser diodes Broad photonics portfolio across industrial and medical
HOLOEYE Photonics AG ~2–4% Phase-only SLMs, diffractive optical elements Research-grade SLMs and holographic optical elements for AR systems
Zebra Imaging (now ZI Imaging) ~2–3% Holographic prints, defense mapping displays U.S. defense 3D terrain visualization
Dualitas Ltd ~2–4% Real-time holographic video engines Automotive HUD and consumer display processing


Recent News & Developments

  • Lyncée Tec (March 2025): Launched the DHM R2200 reflection digital holographic microscope targeting semiconductor wafer-level defect inspection, integrating AI-driven automated defect classification.
  • RealView Imaging (January 2025): Received FDA 510(k) clearance for its HOLOSCOPE-i holographic 3D display technology system for intraoperative cardiac catheterization visualization, marking the first FDA-cleared holographic surgical display [17].
  • Jasper Display Corp. (November 2024): Announced mass production of its JD2704 4K LCOS phase-spatial light modulators for holography, achieving a 40% cost reduction versus the prior generation through 300 mm wafer processing [8].
  • NVIDIA (September 2024): Published a neural holographic rendering framework at SIGGRAPH 2024, demonstrating real-time holographic video on consumer-grade GPUs — a step that could accelerate holographic 3D display technology adoption across the Digital Holography Market [13].
  • Apple (June 2024): Granted USPTO patent US 12,045,678 for holographic optical elements for AR systems in a head-mounted display, signaling potential integration into future Vision Pro iterations [14].
  • Microsoft Research (April 2024): Demonstrated a 500 GB holographic disc prototype using angular multiplexing, advancing holographic data storage research toward commercial cold-archive viability [9].
  • European Commission (February 2024): Announced EUR 120 million Horizon Europe call for photonics and holographic technologies under the Digital Europe Programme, targeting medical imaging and industrial metrology applications [18].
  • Phase Holographic Imaging (October 2023): Secured a SEK 85 million Series B round to expand HoloMonitor distribution into clinical diagnostic laboratories across Asia-Pacific, strengthening digital holographic microscopy for research commercialization [3].


Report Scope

Parameter Detail
Market Scope Global Digital Holography Market — hardware, software, services
Study Period 2021–2035
CAGR Window 2026–2035: 15.62%
Market Size (2025) USD 5.22 Billion
Market Size (2035) USD 22.48 Billion
Fastest Growing Segment Synthetic-aperture holography (by technique); Automotive (by end user); Asia-Pacific (by region)
Companies Profiled 10 (Lyncée Tec, Holoxica, PHI, RealView Imaging, Geola, Jasper Display, Hamamatsu, HOLOEYE, ZI Imaging, Dualitas)
Valuation Currency USD Billion


FAQs

What minimum laser coherence length is needed for commercial digital holographic displays?

Most commercial holographic 3D display technology systems require a laser coherence length of at least 30 cm to produce artifact-free reconstructions across a 50 cm viewing depth. Semiconductor laser diodes meeting this spec currently cost USD 1,200–3,500 per unit at volume [8].

How does digital holographic microscopy compare with confocal microscopy for live-cell studies?

Digital holographic microscopy for research captures quantitative phase data without fluorescent labels, eliminating phototoxicity and enabling continuous 72-hour cell monitoring. Confocal microscopy offers superior fluorescence specificity but requires dye-induced sample preparation [23].

Which certification pathway applies to holographic automotive HUDs in the EU?

Holographic AR HUDs must satisfy UNECE Regulation No. 125 for indirect-vision devices and ECE R48 for forward-lighting interference. Certification typically takes 12–18 months through an EU Type Approval body [6].

Can holographic data storage achieve cost parity with magnetic tape for cold archives?

Current prototype costs sit near USD 0.02/GB versus tape at USD 0.004/GB. Industry roadmaps project parity by 2031–2032 if polymer substrate yields exceed 85% [9].

What IP risks should investors evaluate before entering the Digital Holography Market?

Key patent clusters around phase-spatial light modulators for holography are held by Hamamatsu, Jasper Display, and Holoeye, creating licensing dependencies. Investors should commission freedom-to-operate analyses covering LCOS modulator and holographic optical elements for AR systems claims [14].

How do volumetric holographic advertising displays handle ambient-light interference in retail environments?

Vendors use narrow-band laser sources paired with holographic notch filters that reject ambient illumination outside the display's wavelength. This preserves contrast ratios above 800:1 even under 1,500 lux mall lighting [7].

What workforce gap is most critical for scaling the Digital Holography Market?

The SPIE 2024 workforce survey found a 34% shortfall in optical engineers with phase-modulation and diffractive-optics expertise globally. University photonics programs graduate roughly 4,500 specialists annually against demand for over 6,000 [12].


Author
Author
Author Profile
Nirmit Biswas LinkedIn
Senior Research Analyst
With 5+ years of expertise in Market Intelligence and Strategic Research, Nirmit Biswas specializes in ICT, Semiconductors, and BFSI. Backed by an MBA in Financial Services and a Computer Science foundation, Nirmit blends technical depth with business acumen. He has successfully led 100+ projects for global enterprises and startups, including Amazon, Cisco, L&T and Huawei, delivering market estimations, competitive benchmarking, and GTM strategies. His focus lies in transforming complex data into clear, actionable insights that drive growth, innovation, and investment decisions. Recognized for bridging engineering innovation with executive strategy, Nirmit helps businesses navigate dynamic markets with confidence.
Co-Author
Co-Author Profile
Aarti Dhapte LinkedIn
AVP - Research
A consulting professional focused on helping businesses navigate complex markets through structured research and strategic insights. I partner with clients to solve high-impact business problems across market entry strategy, competitive intelligence, and opportunity assessment. Over the course of my experience, I have led and contributed to 100+ market research and consulting engagements, delivering insights across multiple industries and geographies, and supporting strategic decisions linked to $500M+ market opportunities. My core expertise lies in building robust market sizing, forecasting, and commercial models (top-down and bottom-up), alongside deep-dive competitive and industry analysis. I have played a key role in shaping go-to-market strategies, investment cases, and growth roadmaps, enabling clients to make confident, data-backed decisions in dynamic markets.

Research Approach


Secondary Research

The secondary research process involved comprehensive analysis of regulatory databases, peer-reviewed scientific journals, technical publications, and authoritative industry organizations. Key sources included the US Food & Drug Administration (FDA) Center for Devices and Radiological Health, European Medicines Agency (EMA) Medical Device Coordination Group, International Electrotechnical Commission (IEC) Photonics Standards, International Organization for Standardization (ISO) Technical Committee 172 (Optics and Photonics), Institute of Electrical and Electronics Engineers (IEEE) Photonics Society, Optical Society of America (OSA), SPIE (International Society for Optics and Photonics), National Institute of Standards and Technology (NIST) Physical Measurement Laboratory, National Institutes of Health (NIH) National Institute of Biomedical Imaging and Bioengineering, National Center for Biotechnology Information (NCBI/PubMed), Defense Advanced Research Projects Agency (DARPA) Photonics Programs, European Photonics Industry Consortium (EPIC), Japan Photonics Industry Association (JPIA), China Optics and Optoelectronics Manufacturers Association (COEMA), Federal Communications Commission (FCC) Equipment Authorization Database, EU Eurostat Digital Economy & Society Statistics, World Intellectual Property Organization (WIPO) Patent Database, and national metrology institute reports from key markets. These sources were used to collect technology standards, regulatory approval data, clinical validation studies, patent landscapes, and market adoption trends for computer-generated holography, digital holographic interferometry, holographic display systems, and associated laser and sensor technologies.


Primary Research

Qualitative and quantitative insights were obtained by interviewing supply-side and demand-side stakeholders during the primary research process. CEOs, CTOs, VPs of R&D, leaders of photonics engineering, regulatory affairs managers, and commercial directors from digital holography system manufacturers, laser component suppliers, optical sensor developers, and holographic display OEMs comprised supply-side sources. Defense procurement officers, data center infrastructure managers, chief medical physicists, directors of radiology and biomedical imaging, research scientists from microscopy laboratories, quality control directors from manufacturing facilities, academic research institutions, and healthcare systems comprised demand-side sources. The primary research validated technology segmentation, confirmed product development roadmaps, and collected insights on clinical integration patterns, pricing models, and interoperability standards.

Primary Respondent Breakdown:

By Designation: C-level Primaries (28%), Director Level (35%), Others (37%)

By Region: North America (32%), Europe (30%), Asia-Pacific (33%), Rest of World (5%)


Market Size Estimation

Global market valuation was derived through revenue mapping and technology deployment analysis. The methodology included:

Identification of 55+ key technology providers across North America, Europe, Asia-Pacific, and emerging markets

Product mapping across computer-generated holography, digital holographic interferometry, holographic displays, and underlying component categories (laser systems, sensors, software, optical elements)

Analysis of reported and modeled annual revenues specific to digital holography portfolios and optical component divisions

Coverage of manufacturers and component suppliers representing 75-80% of global market share in 2024

Extrapolation using bottom-up (deployment volume × ASP by application sector and region) and top-down (technology provider revenue validation) approaches to derive segment-specific valuations across medical imaging, data storage, microscopy, and industrial applications

Download Free Sample

Kindly complete the form below to receive a free sample of this Report

Download PDF ×

We do not share your information with anyone. However, we may send you emails based on your report interest from time to time. You may contact us at any time to opt-out.