Request Free Sample ×

Kindly complete the form below to receive a free sample of this Report

* Please use a valid business email

Leading companies partner with us for data-driven Insights

clients tt-cursor
Hero Background

Digital Signage Market

ID: MRFR/SEM/0596-CR
200 Pages
Ankit Gupta
Last Updated: June 01, 2026
Digital Signage Market Size, Share and Research Report By Component Type (Hardware, Software, and Service), By Vertical (Commercial, Institutional, Infrastructure, and Institutional), And By Region (North America, Europe, Asia-Pacific, And Rest Of The World) – Industry Forecast Till 2035
Download PDF ×

We do not share your information with anyone. However, we may send you emails based on your report interest from time to time. You may contact us at any time to opt-out.


Digital Signage Market Summary

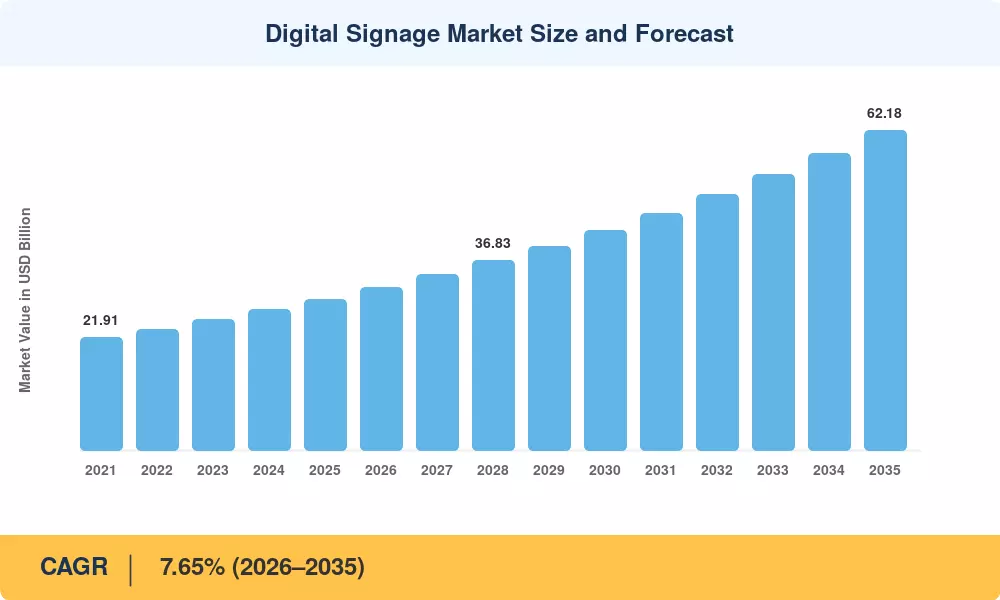
The Digital Signage Market was valued at USD 29.42 billion in 2025 and is projected to reach USD 31.85 billion in 2026 before climbing to USD 62.18 billion by 2035, registering a CAGR of 7.65% during 2026–2035. Accelerating smart-city budgets — the U.S. Bipartisan Infrastructure Law alone earmarked over USD 65 billion for broadband and digital infrastructure through 2026 — have made outdoor LED digital signage displays a core component of urban mobility and public-safety networks [2]. Retailers, meanwhile, are channeling capital into interactive touchscreen digital signage that doubles as a retail-media revenue stream, turning passive screens into programmatic content for digital signage ad exchanges [3].

The Digital Signage Market is being revolutionized by a technology pivot from hardware replacing static posters to AI-driven, cloud-managed digital signage networks. Legacy single-loop USB players are replaced with edge-compute media players with computer-vision analytics. MicroLED and fine-pitch LED panels replace LCD video walls in high-ambient-light corridors. Samsung’s USD 1.7 billion display-fab expansion in Vietnam highlights the supply-side commitment to next-gen panel capacity [4]. Direct-view LED arrays are now 40% more power-efficient than comparable LCD-backlit systems, enabling capital budgets to meet ESG reporting requirements.

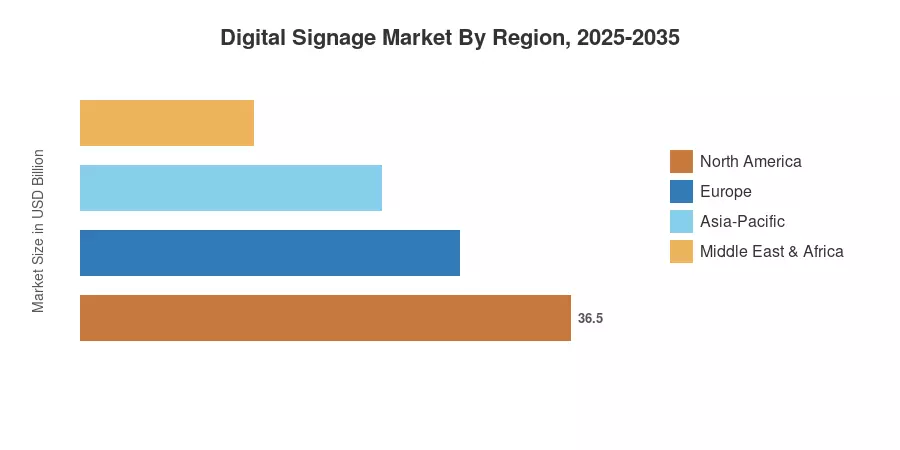
North America accounted for ~35% of the 2025 Digital Signage Market revenue, led by dense retail-media ecosystems and corporate workspace modernization Asia-Pacific is expected to witness the highest growth rate of 7.78% during the forecast period, owing to the national program of “Smart Transportation” in China and Digital India in India. Europe had the second greatest proportion, at over 26 %, driven by the EU’s Digital Decade ambitions for connected public places. The Digital Signage Market is set for continued double-digit investment inflows far into the 2030s, driven by the confluence of 5G rollout, AI-powered audience analytics, and sustainability regulation.


Key Report Takeaways

• By Component

  • Hardware accounted for roughly 64% of the 2025 Digital Signage Market revenue, reflecting the capital intensity of outdoor LED digital signage displays and large-format video walls
  • Software platforms — including cloud-managed digital signage networks and CMS suites — are expanding at a 9.58% CAGR through 2035, the fastest among component segments

• By Type

  • Video walls represented approximately USD 8.12 billion in 2025, while kiosks featuring interactive touchscreen digital signage are tracking a 8.42% annual growth rate

• By Deployment

  • On-premise deployments led the Digital Signage Market with a 73% revenue share in 2025. Yet, cloud-based platforms are registering a 11.58% CAGR as operators shift to programmatic content for digital signage delivery


• By End-Use

  • Retail remained the top end-use vertical at roughly 23% of 2025 revenue, leveraging digital signage for retail wayfinding and promotions
  • Transportation displays are growing at a 8.49% CAGR, fueled by real-time passenger-information mandates across metro systems worldwide

• By Regional

  • North America generated approximately USD 10.30 billion in 2025 Digital Signage Market spend
  • Asia-Pacific leads growth at a 7.78% CAGR, with China and India collectively accounting for over 55% of regional revenue
  • The Middle East & Africa represent the smallest share but are expanding rapidly as Gulf states invest in smart-tourism signage infrastructure


Market Size and Forecast (2021–2035)

The market-size series below combines MRFR primary surveys, vendor revenue disclosures, and secondary validation against industry association shipment data. Historical figures (2021–2024) reflect actual reported values; 2025 is the base year; 2026–2035 values are forecast using a calibrated compound growth model at a 7.65% CAGR.

Digital Signage Market Size and Forecast
Our Impact
Enabled $4.3B Revenue Impact for Fortune 500 and Leading Multinationals
Partnering with 2000+ Global Organizations Each Year
30K+ Citations by Top-Tier Firms in the Industry
 

Driver Impact Analysis

Driver ~% Impact on CAGR Geographic Relevance Impact Timeline
AI-driven audience analytics & personalization ~18% Global Short-term (≤2 yr)
5G & edge-compute network buildout ~16% North America, Asia-Pacific Medium-term (2–4 yr)
Retail-media monetization of in-store screens ~15% North America, Europe Short-term (≤2 yr)
Smart-city & transit-authority modernization ~14% Asia-Pacific, Europe Long-term (≥4 yr)
MicroLED & energy-efficient display technology ~13% Global Medium-term (2–4 yr)
Corporate hybrid-workplace communication needs ~12% North America, Europe Short-term (≤2 yr)
Programmatic DOOH advertising growth ~12% Global Medium-term (2–4 yr)


AI-Driven Audience Analytics

Computer-vision cameras paired with on-device inference chips enable real-time demographic profiling, dwell-time measurement, and gaze tracking without transmitting personally identifiable data off-premises. According to industry intelligence reports from MRFR, the computer vision segment within retail environments remains a primary driver of operational visibility, particularly as cloud-managed digital signage networks increasingly bundle these analytical modules as standard features. Brands deploying AI-triggered programmatic content for digital signage observe substantial engagement gains compared to static scheduling. This creates a direct revenue feedback loop that accelerates hardware refresh cycles and expands the addressable digital signage ecosystem.

5G & Edge-Compute Enablement

Low-latency 5G connectivity removes the bandwidth bottleneck that historically constrained outdoor LED digital signage displays to pre-cached content loops. Infrastructure benchmarks in highly connected regions like South Korea demonstrate that nationwide high-density deployments can reliably stream high-fidelity content to remote screens in real time with minimal latency. Edge-compute gateways co-located at network nodes allow content-decision algorithms to execute closer to the point of display. This structural shift optimizes cloud egress economics and makes interactive touchscreen digital signage commercially viable even in rapid transit environments with intermittent network backhaul.

Retail-Media Monetization

Retail-media networks have emerged as a dominant force in global advertising revenue, with in-store digital screens establishing themselves as a rapidly growing format within omnichannel marketing strategies. Major retail networks—including Walmart Connect, Kroger Precision Marketing, and Tesco Media & Insight—are actively scaling their in-store physical digital footprints to unify in-venue promotions with their first-party shopper data. This commercial convergence effectively transforms traditional capital-expenditure signage displays into direct profit centers, fundamentally altering the return-on-investment calculus for stakeholders across the digital signage market.


Restraints Impact Analysis

Restraint impact percentages follow the same directional methodology as Section 4. They represent estimated headwinds that collectively temper growth below what pure demand-side drivers would otherwise produce.

Restraint ~% Drag on CAGR Geographic Relevance Impact Timeline
High upfront capital & installation costs ~–20% Emerging markets Long-term (≥4 yr)
Content-creation complexity & talent gap ~–18% Global Medium-term (2–4 yr)
Data privacy regulations are limiting audience analytics ~–15% Europe, North America Short-term (≤2 yr)
Display vandalism & harsh-environment durability ~–12% MEA, South America Long-term (≥4 yr)
Fragmented CMS interoperability standards ~–10% Global Medium-term (2–4 yr)


High Upfront Capital Costs

Commercial-grade outdoor digital signage configurations engineered with high-brightness LCD panel architectures and weatherized, high-ingress protection housing require substantial initial investments before accounting for site installation, network connectivity, and content management system (CMS) licensing. For independent and mid-sized retail operators globally, this initial capital requirement represents a primary structural barrier to wider market adoption. While equipment leasing structures and digital-signage-as-a-service (DSaaS) operating models are emerging to help spread these initial expenses, restricted commercial credit availability across developing economic territories continues to constrain total addressable network expansion throughout Latin America and parts of the African continent.

Content-Creation Complexity

The operational return on a cloud-managed digital signage framework is intrinsically linked to the relevance and dynamic cadence of the media it displays. A significant proportion of screen deployers experience localized network fatigue post-installation, typically stemming from a lack of specialized in-house creative resources capable of producing high-impact, programmatic content at scale. Although template-based CMS ecosystems are helping to bridge basic publishing requirements, the talent shortage for sophisticated, data-driven, dynamic assets remains acute. This structural challenge is especially pronounced for interactive touchscreen implementations, which demand advanced user experience (UX) and interface design expertise far beyond traditional static graphic production.

Data-Privacy Headwinds

Evolving regulatory environments pose complex integration challenges for smart digital signage architecture. Under the European Union Artificial Intelligence Act, strict regulatory frameworks target real-time remote biometric monitoring in publicly accessible venues, introducing rigid compliance protocols for operators utilizing camera-equipped networks for audience profiling or proximity-triggered retail promotions.


Digital Signage Market Opportunities

Programmatic DOOH Advertising Expansion

The global digital out-of-home (DOOH) advertising landscape is expanding rapidly, with market intelligence indicating steady, long-term multi-billion-dollar revenue growth. Programmatic automated transactions now account for an increasing share of overall DOOH media spend as cloud-managed digital signage networks integrate supply-side and demand-side software. Operators enabling real-time bidding, unified inventory access, and transparent impression verification can successfully unlock sustainable recurring software-as-a-service revenues and improve hardware capital payback periods.

Emerging-Market Smart-City Deployments

India's Smart Cities Mission has committed INR 2.05 lakh crore (approximately USD 25 billion) across 100 cities, with digital kiosks, interactive touchscreen digital signage wayfinding stations, and transit-information boards specified as core deliverables [8]. Similar programs in Saudi Arabia (NEOM, The Line) and Brazil (SP Inteligente) create greenfield demand for outdoor LED digital signage displays at price points that local system integrators can fulfill through modular LED assemblies manufactured in China and Vietnam

Retail-Media Data Monetization

In-store digital signage networks capture highly valuable, transaction-level shopper insights that standard online platforms cannot natively duplicate. By commercializing closed-loop attribution models, physical retail-media displays allow consumer packaged goods brands to bridge the gap between initial customer impressions and point-of-sale conversions. Because these targeted setups deliver verifiable purchasing intent, media networks can command premium inventory pricing and higher cost-per-thousand-impression margins over standard, non-targeted public displays. [7]

MicroLED & Transparent Display Integration

Advancements in micro-LED fabrication techniques are lowering display production costs, gradually positioning them as premium alternatives to high-end fine-pitch LCD video walls. Concurrently, transparent LED modules engineered into commercial glass storefronts open pristine installation surfaces across urban commercial hubs without exhausting interior floor layouts. Luxury retailers are actively deploying these see-through glass facades, establishing clear growth pathways for the total addressable commercial site footprint worldwide.


Digital Signage Market Future Outlook

AI-Autonomous Content Orchestration

Generative artificial intelligence engines are projected to produce a substantial share of outbound enterprise marketing materials, effectively resolving the manual creative bottlenecks that historically limited network utilization across the digital signage market. For screen operators, this systemic transition enables always-on, context-aware content streams that dynamically adapt to localized weather shifts, localized inventory fluctuations, and real-time foot-traffic patterns without requiring manual human intervention or continuous creative oversight.

Platform Economics & SaaS Consolidation

The structural shift toward recurring-revenue software-as-a-service models will accelerate across the display ecosystem as commercial operators increasingly prioritize operating expenditures over large capital-intensive investments. The cloud-managed digital signage software layer is anticipated to undergo significant industry consolidation, coalescing around a small cohort of dominant enterprise platforms. This platform-level consolidation will compress standalone hardware manufacturing margins further, compelling display OEMs to bundle deep analytics and software layers to preserve profitability.

Sustainability & Circular-Display Initiatives

Evolving regulatory frameworks, such as the European Union's updated ecodesign and circular economy mandates, are establishing strict global standards regarding physical product durability, material recyclability, and comprehensive repairability scores. These long-term environmental guidelines compel display engineers to transition away from power-intensive configurations. Emerging energy-efficient visual panels are rapidly becoming the preferred baseline for regulated municipal and outdoor signage setups. At the same time, corporate circular-economy programs reduce raw-material dependencies through formalized end-of-life recycling infrastructure.

Convergence with IoT & Spatial Computing

Digital signage screens are actively evolving into intelligent, ambient nodes embedded within broader enterprise Internet of Things networks. Deep integration with next-generation spatial computing architectures and mixed-reality enterprise applications allows physical interactive touchscreens to serve as anchor points across retail, hospitality, and corporate campuses. This unique display-layer positioning allows digital signage manufacturers and software providers to capture massive downstream opportunities as physical real estate merges with immersive digital layers..


Digital Signage Market Segmentation

By Component

Segment Key Metric Primary Demand Driver
Hardware ~64% of 2025 revenue LED panel upgrades, outdoor installations
Software 9.58% CAGR (2026–2035) Cloud CMS adoption, AI analytics
Services USD 3.24 Billion (2025) Installation, managed services and content creation


Hardware continues to anchor the Digital Signage Market, driven by ongoing transitions from LCD to direct-view LED and MicroLED panels. Display manufacturers are competing on pixel pitch — sub-1.0 mm fine-pitch products now address indoor corporate and control-room applications that previously relied on projection or LCD video walls. Software is the standout growth segment as cloud-managed digital signage networks replace on-premise servers, enabling centralized programmatic content for digital signage management across thousands of endpoints from a single dashboard.

By Type

Segment Key Metric Primary Demand Driver
Video Wall USD 8.12 Billion (2025) Control rooms, corporate lobbies, retail flagships
Video Screen ~38% of 2025 share General-purpose indoor signage
Kiosk 8.42% CAGR (2026–2035) Self-service, wayfinding, order entry
Others USD 1.76 Billion (2025) Menu boards, shelf-edge displays


The Digital Signage Market's kiosk segment is experiencing rapid expansion as quick-service restaurants, airports, and healthcare facilities adopt interactive touchscreen digital signage for self-service workflows. McDonald's, for example, has deployed over 80,000 self-order kiosks globally, with plans to add digital signage for retail wayfinding and promotions in adjacent lobby screens [22].

By Deployment

Segment Key Metric Primary Demand Driver
On-Premise ~73% of 2025 share Data-sensitive industries, legacy infrastructure
Cloud-Based 11.58% CAGR (2026–2035) SaaS economics, remote fleet management
Hybrid USD 2.06 Billion (2025) Transition architectures, retail chains


Cloud-based deployment is the fastest-growing model in the Digital Signage Market, supported by declining bandwidth costs and enterprise comfort with multi-tenant SaaS architectures. Hybrid deployments serve as a transitional step for organizations migrating legacy on-premise systems to cloud-managed digital signage networks without disrupting existing content workflows.

By End-Use Industry

Segment Key Metric Primary Demand Driver
Retail ~23% of 2025 revenue In-store media, wayfinding, promotions
Transportation 8.49% CAGR (2026–2035) Passenger information, schedule boards
Hospitality USD 3.53 Billion (2025) Guest communication, lobby experience
Corporate 7.88% CAGR (2026–2035) Hybrid workplace, meeting-room signage
Others ~14% of 2025 share Healthcare, education, government


Retail's prominence in the Digital Signage Market reflects the sector's dual motivation — enhancing customer experience and generating advertising revenue through digital signage for retail wayfinding and promotions. Transportation is closing the gap quickly; transit authorities from London to Shanghai are mandating real-time outdoor LED digital signage displays that integrate programmatic content for digital signage with live service-disruption alerts.


Regional Market Share Analysis

Region Key Metric Primary Investment Themes
North America ~35% of 2025 revenue Retail media, corporate AV, transit modernization
Europe ~26% share GDPR-compliant analytics, smart tourism, green buildings
Asia-Pacific 7.78% CAGR (2026–2035) Smart cities, 5G infrastructure, transit information
South America USD 1.47 Billion (2025) Retail chains, stadium & event venues
Middle East & Africa 8.15% CAGR (2026–2035) Mega-project developments, airport expansion
Total USD 29.42 Billion (2025)

The Digital Signage Market exhibits distinct regional dynamics shaped by advertising maturity, infrastructure investment, and regulatory frameworks. North America and Europe together account for over 61% of global revenue, while Asia-Pacific's rapid urbanization is redrawing the growth map.


North America

Country Key Metric Key Driver
United States ~78% of regional revenue Retail-media networks, programmatic DOOH
Canada 7.22% CAGR Transit authority screen rollouts
Mexico USD 0.51 Billion (2025) Organized retail expansion, airport upgrades


The United States drives the North American Digital Signage Market through its mature retail-media ecosystem — Walmart, Target, and Kroger collectively operate over 100,000 in-store screens running programmatic content for digital signage [7]. Canada's Metrolinx and TransLink agencies have tendered multi-year contracts for cloud-managed digital signage networks across subway and bus-rapid-transit stations. Mexico's organized retail penetration, growing at approximately 5% annually, is pulling demand for digital signage for retail wayfinding and promotions in new shopping-mall developments across Guadalajara and Monterrey.

Europe

Country Key Metric Key Driver
Germany ~22% of regional share Industry 4.0 factory displays, transit hubs
United Kingdom 7.35% CAGR High-street retail media, Transport for London
France USD 1.22 Billion (2025) Luxury retail, Paris Metro modernization
Italy 6.88% CAGR Tourism wayfinding, hospitality
Spain ~8% of regional share Airport & tourism signage
Nordic Countries 7.48% CAGR Smart-building integration, sustainability focus
Russia USD 0.38 Billion (2025) Domestic manufacturing substitution
Rest of Europe ~12% of regional share Eastern EU cohesion-fund projects


Europe's Digital Signage Market is shaped by the EU Digital Decade initiative targeting 75% of enterprises using cloud services by 2030, which directly accelerates the adoption of cloud-managed digital signage networks [17]. The UK's JCDecuax partnership with Transport for London has deployed over 12,000 outdoor LED digital signage displays across the Underground network. Germany's factory-floor digital signage adoption — driven by Industrie 4.0 grants — positions the country as the region's largest single market.

Asia-Pacific

Country Key Metric Key Driver
China ~42% of regional revenue Smart Transport program, domestic LED manufacturing
India 8.95% CAGR Smart Cities Mission, metro rail expansion
Japan USD 2.18 Billion (2025) Retail innovation, Expo 2025 legacy installations
South Korea 7.62% CAGR 5G-enabled real-time signage, K-culture exports
ASEAN ~11% of regional share Airport modernization, tourism recovery
Rest of Asia-Pacific 7.15% CAGR ANZ corporate AV, emerging-market retail


Asia-Pacific represents the growth engine of the Digital Signage Market. China's dominance stems from both demand-side smart-city mandates and supply-side LED manufacturing capacity — Shenzhen-based firms produce over 60% of global LED modules by volume [8]. India's Delhi Metro Rail Corporation recently awarded a USD 120 million contract for real-time passenger information displays featuring interactive touchscreen digital signage across 285 stations. Japan's Expo 2025 in Osaka is catalyzing a USD 400 million wave of outdoor LED digital signage displays across the Kansai region.

South America

Country Key Metric Key Driver
Brazil ~58% of regional revenue Shopping-center chains, São Paulo transit
Argentina 6.45% CAGR Currency-driven digital ad shift
Rest of South America USD 0.29 Billion (2025) Stadium & event-venue signage


Brazil's Grupo Pão de Açúcar and Magazine Luiza are leading adopters of digital signage for retail wayfinding and promotions, deploying interactive touchscreen digital signage kiosks across flagship stores. Economic volatility in Argentina paradoxically drives advertisers toward programmatic content for digital signage, which offers flexible, short-cycle campaign management compared to print.

Middle East & Africa

Country Key Metric Key Driver
Saudi Arabia ~32% of regional share NEOM, Riyadh Metro, Vision 2030
UAE 8.52% CAGR Dubai airports, Expo City legacy
South Africa USD 0.19 Billion (2025) Retail chains, mining-sector safety displays
Egypt 7.38% CAGR New Administrative Capital infrastructure
Rest of MEA ~18% of regional share Airport & hospitality greenfield projects


The Middle East & Africa Digital Signage Market benefits from mega-project capital flows that dwarf comparable spending in mature economies. Saudi Arabia's Riyadh Metro — a USD 23 billion project — specifies cloud-managed digital signage networks for all 85 stations [18]. Dubai's expansion of Al Maktoum International Airport will add over 5,000 outdoor LED digital signage displays, creating one of the world's largest single-site digital signage deployments.


Digital Signage Market By Region, 2025-2035
 

Competitive Benchmarking

The Digital Signage Market exhibits medium concentration, with the top five vendors estimated to hold 35–42% combined revenue share. The competitive field spans display hardware OEMs, software-platform specialists, and full-stack system integrators. HHI is estimated at approximately 650–800, indicating a moderately fragmented landscape where regional specialists coexist with global conglomerates.

Company Est. Revenue Share Range Key Offerings for the Digital Signage Market Strategic Positioning
Samsung Electronics ~8–12% Smart Signage displays, MagicINFO CMS and outdoor LED Full-stack hardware + software leader
LG Electronics ~7–10% webOS signage, OLED transparent displays, LED Premium display & transparent-screen innovator
Sony Group ~4–6% Crystal LED (CLEDIS), BRAVIA professional displays Ultra-premium visual fidelity
NEC Display Solutions (Sharp NEC) ~3–5% MultiSync displays, NaViSet management Enterprise & control-room specialist
Daktronics ~3–5% Large-format outdoor LED, sports venue displays Outdoor & stadium signage leader
BrightSign ~2–4% Media players, BrightSign Network CMS Dedicated media-player ecosystem
Scala (STRATACACHE) ~2–4% Scala Enterprise CMS, audience analytics Software-centric, retail analytics focus
Panasonic Connect ~2–3% LinkRay, high-brightness projectors, LCDs Projection-hybrid signage solutions
Leyard / Planar ~2–3% Fine-pitch LED, video wall processors LED video-wall specialist
Broadsign ~1–3% Programmatic DOOH platform, Broadsign Control Programmatic content for a digital signage leader


Recent News & Developments

  • Samsung Electronics (March 2025): Launched the "Samsung Signage 2025" lineup featuring embedded Edge AI processors for real-time audience measurement, targeting cloud-managed digital signage networks in retail and QSR [23].
  • LG Electronics (January 2025): Unveiled a 77-inch Transparent OLED signage panel at CES 2025, designed for luxury-retail storefronts and museum installations across the Digital Signage Market [24].
  • Broadsign (November 2024): Acquired Campsite — a Nordic programmatic DOOH platform — to expand programmatic content for digital signage capabilities across European transit networks [10].
  • BrightSign (September 2024): Released the XC5 media player with native 8K output and on-device computer-vision inferencing, addressing the interactive touchscreen digital signage segment [25].
  • Daktronics (June 2024): Won a USD 48 million contract to supply outdoor LED digital signage displays for the Las Vegas Convention Center expansion ahead of the 2028 World Cup [14].
  • European Commission (April 2024): Published the Digital Services Act's advertising-transparency guidelines, requiring all programmatic content for digital signage in public spaces to carry real-time disclosure labels [13].
  • NEC / Sharp (February 2024): Merged display divisions under the "Sharp NEC Display Solutions" brand, consolidating R&D for the corporate and control-room segments of the Digital Signage Market [15].
  • Panasonic Connect (December 2023): Partnered with Tokyo Metro to deploy 3,500 interactive touchscreen digital signage kiosks across 180 stations, integrating multilingual wayfinding with ad-funded content [8].


Digital Signage Market Report Scope

Parameter Detail
Market Scope Global Digital Signage Market covering hardware, software, services, and all end-use verticals
Study Period 2021–2035
CAGR (Forecast Period) 7.65% (2026–2035)
Base-Year Market Size USD 29.42 Billion (2025)
2035 Market Size USD 62.18 Billion
Fastest Growing Segment Cloud-based deployment (11.58% CAGR)
Companies Profiled Samsung, LG, Sony, Sharp, NEC, Daktronics, BrightSign, Scala, Panasonic, Leyard/Planar, Broadsign
Valuation Currency USD Billion


FAQs

How does the total cost of ownership for LED video walls compare with LCD alternatives over a five-year horizon?

LED video walls typically achieve 20–30% lower five-year TCO than equivalent LCD arrays because of longer panel lifespan and reduced maintenance. Energy savings from direct-emission LED further widen the gap in 24/7 outdoor deployments [11].

What cybersecurity risks should operators address when deploying cloud-managed digital signage networks?

Unsecured media players are common attack vectors for botnet recruitment and content hijacking. Operators should enforce encrypted device-to-cloud tunnels, certificate-based authentication, and firmware-signing protocols [12].

How does the Digital Signage Market differentiate between SoC-integrated displays and external media players?

System-on-chip displays embed the media player inside the panel, lowering hardware count but limiting upgrade flexibility. External players offer superior processing headroom for interactive touchscreen digital signage applications requiring real-time analytics [25].

What role do carbon-offset programs play in large-scale outdoor LED digital signage displays procurement?

Multinational advertisers increasingly require verified carbon-neutral media placements. Display vendors that provide Scope 3 emissions data and renewable-energy-powered screen networks gain preferential access to ESG-conscious ad budgets [20].

How are quick-service restaurants measuring ROI from in-store Digital Signage Market investments?

QSR chains track uplift through A/B menu-board testing, measuring average order value increases of 3–8% attributable to dynamic pricing and suggestive-sell content. Integration with POS data closes the attribution loop [22].

What interoperability standards should buyers evaluate when selecting a Digital Signage Market CMS platform?

SMIL (Synchronized Multimedia Integration Language) and the Open Signage Platform Alliance's draft protocol are the leading interoperability frameworks. Buyers should verify CMS support for both to avoid vendor lock-in [15].

How does programmatic content for digital signage differ from standard programmatic display advertising?

DOOH programmatic uses impression multipliers based on audience-measurement data rather than cookie-based tracking. Transactions clear through specialized SSPs with proof-of-play verification, distinct from web-display RTB mechanics [10].


Author
Author
Author Profile
Ankit Gupta LinkedIn
Team Lead - Research
Ankit Gupta is a seasoned market intelligence and strategic research professional with over six plus years of experience in the ICT and Semiconductor industries. With academic roots in Telecom, Marketing, and Electronics, he blends technical insight with business strategy. Ankit has led 200+ projects, including work for Fortune 500 clients like Microsoft and Rio Tinto, covering market sizing, tech forecasting, and go-to-market strategies. Known for bridging engineering and enterprise decision-making, his insights support growth, innovation, and investment planning across diverse technology markets.

Research Approach


Secondary Research

The secondary research process involved comprehensive analysis of industry databases, market research publications, technology journals, and authoritative government and industry organizations. Key sources included the US Department of Commerce (DOC), European Commission Digital Economy Reports, National Institute of Standards and Technology (NIST), International Electrotechnical Commission (IEC), Institute of Electrical and Electronics Engineers (IEEE), Consumer Technology Association (CTA), Digital Signage Federation (DSF), Interactive Advertising Bureau (IAB), International Digital Signage Alliance (IDSA), US Bureau of Labor Statistics (BLS), Eurostat ICT Statistics, World Intellectual Property Organization (WIPO) Patent Database, Organisation for Economic Co-operation and Development (OECD) Digital Economy Outlook, United Nations Conference on Trade and Development (UNCTAD) Technology and Innovation Reports, International Telecommunication Union (ITU) ICT Statistics, and national telecommunications authority reports from key markets. These sources were used to collect technology adoption statistics, regulatory compliance data, patent landscape analysis, deployment trends, and market landscape analysis for hardware components (displays, media players, controllers), software platforms (content management systems, analytics), and service categories (installation, maintenance, managed services).


Primary Research

To gather both qualitative and quantitative information, the primary research process involved interviewing players from both the supply and demand sides. Digital signage hardware, software, and system integrator CEOs, VPs, CTOs, and directors of commercial strategy were among the supply-side sources. Members on the demand side included chief information officers (CIOs), directors of information technology (IT), marketing (IM), procurement (PM), and operations (OS) from various sectors such as retail, hotel, corporate, healthcare, education, and transportation. Market segmentation, product development roadmaps, pricing strategies, deployment schedules, and return on investment indicators were all bolstered by primary research.

Primary Respondent Breakdown:

By Designation: C-level Primaries (32%), Director Level (30%), Others (38%)

By Region: North America (38%), Europe (25%), Asia-Pacific (28%), Rest of World (9%)


Market Size Estimation

Global market valuation was derived through revenue mapping and deployment volume analysis. The methodology included:

Identification of 50+ key manufacturers and solution providers across North America, Europe, Asia-Pacific, and Latin America

Product mapping across hardware (LED/LCD displays, OLED screens, media players, controllers), software (content management systems, digital signage analytics, audience measurement tools), and services (professional services, managed services, maintenance & support)

Analysis of reported and modeled annual revenues specific to digital signage portfolios

Coverage of manufacturers representing 65-70% of global market share in 2024

Extrapolation using bottom-up (deployment volume × ASP by country/vertical) and top-down (manufacturer revenue validation) approaches to derive segment-specific valuations

Download Free Sample

Kindly complete the form below to receive a free sample of this Report