Segmentation Quick Reference
| Dimension | Sub-Segments | Dominant Segment | Fastest Growing Segment |
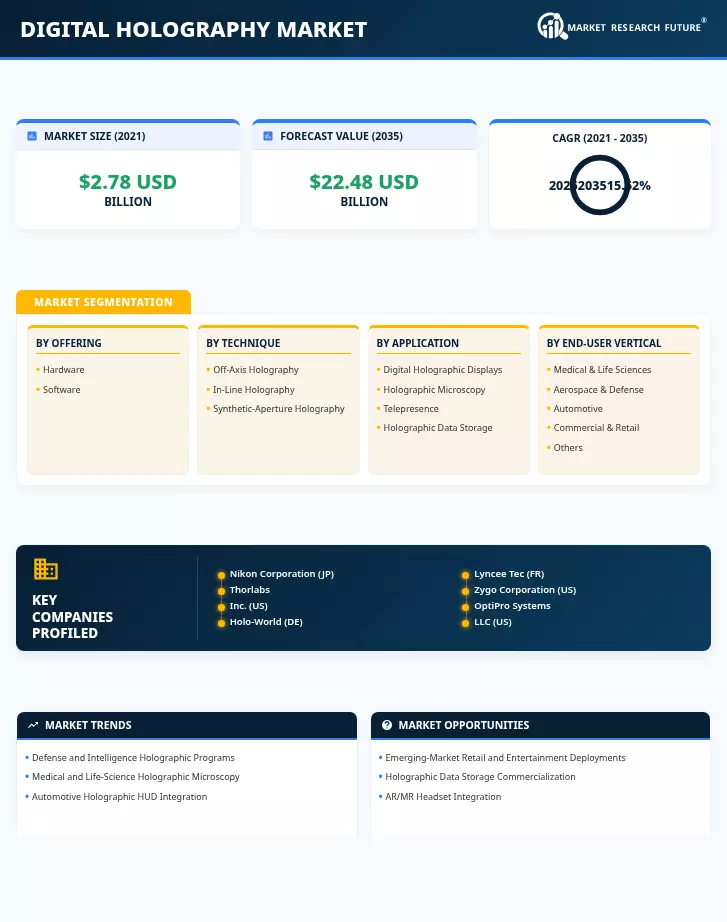
| By Offering | Hardware, Software | Hardware (65.5% share, 2025) | Software (15.78% CAGR) |
| By Technique | Off-Axis Holography, In-Line Holography, Synthetic-Aperture Holography | Off-Axis Holography (USD 3.68B, 2025) | Synthetic-Aperture Holography (17.56% CAGR) |
| By Application | Digital Holographic Displays, Holographic Microscopy, Telepresence, Holographic Data Storage | Digital Holographic Displays (47.8% share, 2025) | Holographic Data Storage (18.3% CAGR) |
| By End-User Vertical | Medical & Life Sciences, Digital Holography Market, Automotive, Commercial & Retail, Others | Medical & Life Sciences (33.2% share, 2025) | Automotive (16.62% CAGR) |
| By Region | North America, Europe, Asia-Pacific, South America, Middle East & Africa | North America (44.8% share, 2025) | Asia-Pacific (17.05% CAGR) |
Market Segmentation Overview
By Offering
| Sub-Segment | Key Trend |
| Hardware | Phase-spatial light modulators transitioning to 300 mm wafer fabrication, driving 30–40% unit cost reduction; holographic display panel demand rising from automotive and retail verticals |
| Software | Cloud-based holographic reconstruction platforms are emerging as SaaS offerings; AI-driven phase retrieval is reducing computational latency from minutes to milliseconds |
Hardware remains the revenue foundation of the Digital Holography Market, but software platforms are capturing a growing share of value as reconstruction, content management, and analytics move to cloud-native architectures.
By Technique
| Sub-Segment | Key Trend |
| Off-Axis Holography | Established standard for microscopy and metrology; mature supply chain with high reliability |
| In-Line Holography | Growing adoption in particle-field analysis and fluid dynamics research; simpler optical setup, but requires computational phase recovery |
| Synthetic-Aperture Holography | Fastest-growing technique; enables wide-field-of-view reconstructions critical for AR/MR headsets and large-format display systems |
Off-axis holography dominates due to its straightforward phase separation, while synthetic-aperture methods are seeing rapid venture-backed investment tied to AR headset component qualification.
By Application
| Sub-Segment | Key Trend |
| Digital Holographic Displays | Largest application segment; expanding from niche entertainment into automotive HUDs and mainstream retail advertising |
| Holographic Microscopy | Strong growth in clinical diagnostics as label-free imaging replaces fluorescence-based workflows |
| Telepresence | VVC codecs and 5G infrastructure are unlocking consumer-grade holographic communication |
| Holographic Data Storage | Pre-commercial phase; hyperscaler interest in cold-archive polymer disc technology is accelerating R&D investment |
Display applications dominate current revenue, but holographic data storage represents the highest long-term growth potential as cost-per-GB approaches parity with magnetic tape.
By End-User Vertical
| Sub-Segment | Key Trend |
| Medical & Life Sciences | Label-free cell analysis, surgical navigation, and point-of-care diagnostics in emerging markets |
| Digital Holography Market | Holographic LiDAR for ISR, 3D terrain visualization, soldier-mounted AR displays |
| Automotive | Holographic AR HUDs scaling from luxury to mid-tier platforms; QA inspection replacing coordinate-measuring machines |
| Commercial & Retail | Volumetric advertising proving ROI in tier-1 malls; event staging and brand activations |
| Others (Telecom, Education, Energy) | Telepresence for enterprise collaboration; holographic training simulations; pipeline and infrastructure inspection |
Medical and life sciences hold the largest end-user share, while automotive is the fastest-growing vertical, driven by OEM holographic HUD commitments across 2027–2030 model-year platforms.