Digital Power Utility Market (2026 - 2035)

Digital Power Utility Market Size, Share & Growth Analysis Report By Technology (Integrated Solutions, Hardware), By Sector (Power Generation, Transmission & Distribution, Energy Storage, Energy Trading & Retail) and By Regional (North America, Europe, South America, Asia Pacific, Middle East and Africa) – Industry Growth & Forecast to 2035
ID: MRFR/EnP/33143-HCR
100 Pages
Chitranshi Jaiswal
Last Updated: July 10, 2026
Digital Power Utility Market
Market Size
Forecast Period2026-2035
CAGR (2026-2035)9.10%
2025 Market SizeUSD 140.80 Billion
2035 Market SizeUSD 334.40 Billion
Key Players
Siemens AG
GE Vernova
Schneider Electric
ABB Ltd
Honeywell International
Oracle Corporation
Opportunities
  • Grid-Edge Intelligence and Distributed Automation
  • Utility Data Monetization and New Business Models
  • Emerging-Market Leapfrog Deployments

Digital Power Utility Market Summary

The digital power utility market was valued at USD 140.80 billion in 2025 and is projected to reach USD 152.70 billion in 2026 before climbing to USD 334.40 billion by 2035, registering a CAGR of 9.10% across the 2026–2035 forecast window. Two catalysts anchor this trajectory: the U.S. Department of Energy's USD 20.5 billion Grid Resilience and Innovation Partnerships program, which is channeling federal dollars into digitized distribution networks, and the EU's revised Energy Efficiency Directive mandating real-time consumption transparency for all member-state utilities by 2030 [1][2]. Together, these policy frameworks are converting what was once discretionary IT spending into compliance-driven capital expenditure across the digital power utility market.

Legacy SCADA architectures and manual meter-reading workflows are giving way to cloud-native platforms that fuse artificial intelligence with high-density IoT sensor arrays. Utilities that once budgeted 2–3% of revenue for technology now allocate 6–8%, a shift validated by the International Energy Agency's 2024 estimate that global grid digitalization investment surpassed USD 48 billion for the first time [3]. The result is a sector-wide pivot from reactive maintenance to predictive, data-driven operations.

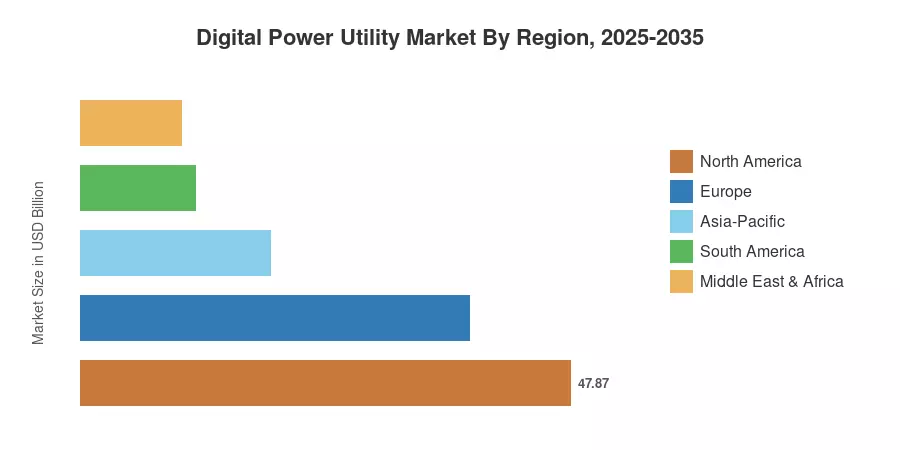
North America commands roughly 34% of the digital power utility market, supported by decades of regulatory mandates around advanced metering. Asia-Pacific is the fastest-growing region at a projected 13.20% CAGR, fueled by India's Revamped Distribution Sector Scheme and China's aggressive state-grid modernization campaigns [4]. Europe holds the second-largest share at approximately 27%, anchored by the Nordic region's near-complete rollout of second-generation smart meters. As electrification accelerates globally, the digital power utility market stands to absorb a disproportionate share of infrastructure investment through 2035.


Key Report Takeaways

• By Technology

  • Integrated solutions held the leading position in the digital power utility market in 2025, commanding approximately 55% of total revenue, driven by utility demand for unified analytics-and-control platforms.
  • Hardware components are expected to register a CAGR of 12.0% through 2035, propelled by mass deployments of intelligent electronic devices and communication gateways.

• By Sector

  • Power generation represented roughly 43% of the digital power utility market in 2025, reflecting heavy investment in plant-level digital twins and predictive maintenance suites.
  • Energy storage is poised for the fastest sectoral growth at a projected 15.30% CAGR through 2035, as battery-management software becomes integral to grid balancing.

• By Region

  • North America remained the dominant geography in the digital power utility market, supported by FERC Order 2222 and state-level performance-based ratemaking incentives.
  • Asia-Pacific is forecast to advance at a 13.20% CAGR between 2026 and 2035, making it the fastest-growing regional market.


Digital Power Utility Market Size and Forecast (2021–2035)

Market Research Future's sizing model triangulates bottom-up revenue estimates from utility IT/OT budgets, vendor financial disclosures, and top-down macro indicators such as grid investment intensity ratios published by the IEA. Historical values (2021–2024) are reconciled against audited annual reports of the top-20 vendors, while forecast values (2026–2035) apply a calibrated compound growth rate validated against independent econometric models.
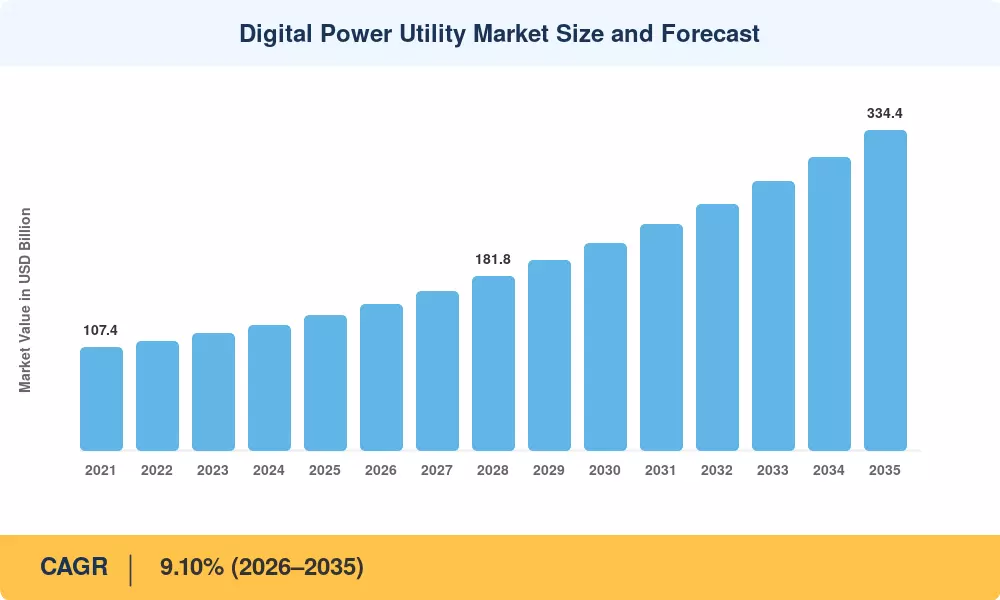
Digital Power Utility Market Size and Forecast
Our Impact
Enabled $4.3B Revenue Impact for Fortune 500 and Leading Multinationals
Partnering with 2000+ Global Organizations Each Year
30K+ Citations by Top-Tier Firms in the Industry

Driver Impact Analysis

Driver ~% Impact on CAGR Geographic Relevance Impact Timeline
Grid-resilience mandates & federal funding ~22% North America Short-term (≤2 yr)
Renewable-energy integration requirements ~18% Global Medium-term (2–4 yr)
Hyperscale data-center electricity demand ~15% North America, APAC Short-term (≤2 yr)
AI-driven predictive maintenance adoption ~14% Europe, North America Medium-term (2–4 yr)
Second-generation smart meter replacement cycles ~12% Europe, APAC Short-term (≤2 yr)
Distributed energy resource management ~10% Global Long-term (≥4 yr)
Electrification of transport & heating ~9% Europe, China Long-term (≥4 yr)


Grid-Resilience Mandates and Federal Funding

The U.S. Bipartisan Infrastructure Law allocated USD 65 billion to power-sector modernization, with USD 20.5 billion explicitly targeting digital grid technologies such as dynamic line rating, automated fault isolation, and distribution-management systems [1]. State public-utility commissions in Texas, California, and New York have tied rate-case approvals to measurable digitization milestones, compelling investor-owned utilities to accelerate procurement cycles. This regulatory pressure creates a captive demand floor for the digital power utility market that persists regardless of economic cycles.

Renewable-Energy Integration Requirements

The IEA's 2024 World Energy Outlook projected that renewables will supply over 50% of global electricity by 2030, requiring real-time balancing capabilities that analog control rooms cannot deliver [3]. Curtailment costs in Germany alone exceeded EUR 2.3 billion in 2023, a figure that digital forecasting and dispatch optimization platforms can reduce by 30–40% according to EPRI field trials [6]. Every percentage point of renewable penetration added to a national grid increases demand for digital orchestration tools.

Hyperscale Data-Center Electricity Demand

Global data-center power consumption is on track to double from 460 TWh in 2024 to over 945 TWh by 2030, per the IEA [13]. This load growth forces utilities to upgrade both generation dispatch logic and distribution feeder management simultaneously. The digital power utility market captures spending on both fronts — upstream AI-based load forecasting and downstream automated voltage regulation — making data-center demand one of the most concentrated growth vectors.

AI-Driven Predictive Maintenance

According to a 2024 DOE-funded pilot across six U.S. cooperatives, utilities using machine-learning algorithms on transformer vibration, dissolved-gas, and thermal imaging data have shown 25–35% savings in unscheduled outage hours [11]. The financial justification is strong: even a small improvement in failure prediction results in multimillion-dollar savings because replacing a single large power transformer costs USD 3–8 million. Transmission operators, whose asset criticality warrants the analytics expenditure, are seeing the fastest adoption.


Restraints Impact Analysis

The restraint-impact percentages below reflect estimated drag on the overall CAGR. These figures are directional and derived from sensitivity analysis of deployment-barrier surveys and cost-modeling exercises conducted by Market Research Future.

Restraint ~% Impact on CAGR Geographic Relevance Impact Timeline
Cybersecurity risk and compliance burden ~−8% Global Short-term (≤2 yr)
Legacy IT/OT integration complexity ~−6% North America, Europe Medium-term (2–4 yr)
Skilled workforce shortages ~−5% Global Long-term (≥4 yr)
Regulatory fragmentation across jurisdictions ~−4% Europe, South America Medium-term (2–4 yr)
High upfront capital requirements for smaller utilities ~−3% MEA, South America Short-term (≤2 yr)


Cybersecurity Risk and Compliance Burden

The North American Electric Reliability Corporation's CIP standards mandate continuous monitoring, vulnerability patching, and incident-response readiness for every digitally connected grid asset [16]. Compliance costs can reach USD 12–18 million annually for a mid-sized utility. These expenditures absorb budget that would otherwise fund new digital capabilities, creating a drag on the digital power utility market that disproportionately affects utilities with fewer than 500,000 customer connections.

Legacy IT/OT Integration Complexity

Many utilities run distribution-management and SCADA systems that are 15–25 years old and based on proprietary protocols that are incompatible with contemporary cloud platforms [17]. Boards are cautious due to the possibility of operational disruption during cutover, and migration projects frequently exceed schedules by thirty to fifty percent. This complexity will continue to be a structural obstacle for the digital power utility business until middleware solutions are developed enough to bridge legacy and next-generation stacks affordably.


Skilled Workforce Shortages

The U.S. Bureau of Labor Statistics projects a 15% shortfall in power-systems engineers and data scientists qualified for utility analytics roles by 2028 [18]. In Asia-Pacific, the talent gap is even wider, with India's Central Electricity Authority estimating it needs 40,000 additional digital-skilled workers across state distribution companies. Without these professionals, purchased software licenses sit underutilized, dampening realized ROI and slowing reorder cycles.


Digital Power Utility Market Opportunities

Grid-Edge Intelligence and Distributed Automation

Millions of controlled endpoints that need localized intelligence are being created by the growth of behind-the-meter solar, battery storage, and EV chargers. By processing 80% of operational decisions without round-tripping to the cloud, edge-computing nodes co-located at substations can reduce latency from seconds to milliseconds. In the digital power utility market, which is predicted to develop at double-digit rates until 2035, vendors who package edge technology with pre-trained optimization algorithms will grab a greenfield portion [10].


Utility Data Monetization and New Business Models

Digitized utilities sit on terabytes of granular consumption, power-quality, and asset-health data that hold commercial value for insurers, real-estate platforms, and EV-charging network operators. Progressive regulators in the UK and Australia have already approved anonymized data-sharing frameworks that create new, non-tariff revenue streams. This business-model shift represents one of the highest-margin growth vectors in the digital power utility market.

Emerging-Market Leapfrog Deployments

Utilities in Sub-Saharan Africa and Southeast Asia are bypassing legacy copper-wire metering entirely, deploying cellular-connected prepaid smart meters from day one. The World Bank's USD 5.5 billion ESMAP program is co-financing digital distribution infrastructure in 30 countries, creating addressable demand that did not exist five years ago [20]. Vendors offering low-cost, solar-powered communication gateways are best positioned in these markets.

Energy-Storage Digital Management Platforms

Battery-storage capacity is expected to exceed 1,200 GWh globally by 2030, per BloombergNEF, and every installed megawatt-hour requires software for state-of-charge optimization, degradation modeling, and market-dispatch automation [9]. This creates a software-attach opportunity within the digital power utility market that compounds as storage fleets age and require increasingly sophisticated analytics.

Regulatory Sandbox and Performance-Based Ratemaking

The UK's Ofgem and a number of US jurisdictions, including Hawaii, New York, and Minnesota, have implemented outcome-based regulations that compensate utilities for quantifiable digitalization results rather than capital expenditures. These sandbox frameworks speed up time-to-contract for technology providers in the digital power utility business and reduce adoption risk for novel platforms.


Digital Power Utility Market Future Outlook

Autonomous Grid Operations

By the early 2030s, leading utilities will operate self-healing distribution networks that detect, isolate, and reroute around faults within seconds — without human intervention. The U.S. DOE's Grid Modernization Laboratory Consortium has already demonstrated autonomous fault-location, isolation, and service-restoration (FLISR) across 14 pilot feeders, reducing average outage duration by 60% [11]. As these capabilities scale, the digital power utility market will shift from selling monitoring tools to selling closed-loop autonomous platforms.

Platform Economics and Ecosystem Lock-In

The market is gravitating toward a platform model where a single vendor provides the data layer, analytics engine, and application marketplace. Utilities that commit to a platform reduce integration costs by 25–30%, but they also face switching costs that entrench vendor relationships for a decade or more [17]. This dynamic will concentrate long-term revenue among the three or four vendors that establish dominant platform ecosystems within the digital power utility market.

Electrification Supercycle

IRENA projects that global electricity demand will rise 65% between 2025 and 2050, driven by EV adoption, heat-pump deployment, and industrial electrification [15]. Every incremental terawatt-hour of demand requires digital infrastructure for load forecasting, congestion management, and dynamic pricing. The digital power utility market is therefore structurally correlated with electrification intensity, a macro tailwind that persists well beyond the forecast horizon.

ESG Reporting and Carbon-Tracking Integration

The EU's Corporate Sustainability Reporting Directive and the SEC's climate-disclosure rules require utilities to report Scope 1, 2, and 3 emissions with auditable granularity [2]. Meeting these obligations demands the same sensor-to-cloud data pipelines that underpin operational optimization, creating a compliance-driven spending layer on top of existing digital investments. Utilities that integrate carbon-tracking into their digital platforms will satisfy regulators and investors simultaneously, adding a valuation premium within the digital power utility market.


Digital Power Utility Market Segmentation

By Technology

Segment Key Metric Primary Demand Driver
Integrated Solutions 55% revenue share (2025) Unified platform demand
Hardware 12.0% CAGR (2026–2035) Meter and sensor deployments


Integrated solutions dominate the digital power utility market because utilities increasingly reject point products in favor of platforms that combine SCADA, ADMS, OMS, and analytics in a single environment. Vendors like Siemens and Schneider Electric have restructured their portfolios around integrated suites, bundling software licenses with long-term service contracts that generate recurring revenue. This segment's share is expected to remain above 50% through 2035, although its growth rate is moderate because much of the installed base is already digitized at the platform level.

Hardware components — smart meters, phasor measurement units, intelligent electronic devices, and communication gateways — drive the volume layer of the digital power utility market. Second-generation meter replacement cycles in Europe and greenfield deployments across Asia-Pacific and Africa sustain double-digit growth. The hardware segment's CAGR of 12.0% outpaces integrated solutions because each software platform requires a proportionally larger sensor and device footprint to function effectively.

By Sector

Segment Key Metric Primary Demand Driver
Power Generation 43% revenue share (2025) Plant-level digital twins
Transmission & Distribution USD 48.20 Billion (2025) Outage management, FLISR
Energy Storage 15.30% CAGR (2026–2035) Battery management software
Energy Trading & Retail CAGR of 10.50% (2026–2035) Dynamic pricing engines


Power generation commands the largest sectoral share in the digital power utility market thanks to capital-intensive digital-twin and condition-monitoring deployments at thermal and renewable plants. Transmission and distribution is the second-largest segment by revenue, fueled by regulatory mandates for outage-management systems and automated fault restoration. Energy storage is the fastest-growing sector, as every new battery installation requires digital management for dispatch optimization, warranty compliance, and market participation.

By Geography

Regional segmentation analysis is detailed in Section 7. Asia-Pacific's 13.20% CAGR makes it the standout growth geography in the digital power utility market, while North America's 34% share reflects the deepest digital penetration among incumbent utilities.


Regional Market Share Analysis

Region Key Metric Primary Investment Themes
North America 34.0% revenue share (2025) Grid resilience, AMI 2.0, DER integration
Europe 27.0% revenue share (2025) Smart meter rollouts, renewable balancing
Asia-Pacific 13.20% CAGR (2026–2035) Leapfrog metering, T&D buildout
South America USD 11.26 Billion (2025) Distribution-loss reduction, prepaid metering
Middle East & Africa USD 9.86 Billion (2025) Generation digitization, greenfield grids
Total USD 140.80 Billion (2025)

The digital power utility market spans five major regions, each at a distinct stage of digital maturity. North America leads in absolute spend, while Asia-Pacific exhibits the steepest growth trajectory.


North America

Country Key Metric Key Driver
US 72% of regional share Federal grid-resilience funding [1]
Canada CAGR of 8.80% Provincial clean-energy mandates
Mexico USD 3.40 Billion (2025) CFE distribution modernization


The United States alone accounts for nearly three-quarters of North American spending in the digital power utility market, driven by FERC-jurisdictional transmission owners upgrading outage-management and energy-management systems. Canada's digital utility adoption accelerates under provincial mandates — Ontario's IESO and British Columbia's BC Hydro have each committed over CAD 1.5 billion to metering and analytics through 2030 [7]. Mexico's state-owned CFE is piloting distribution-automation corridors in Monterrey and Guadalajara with Inter-American Development Bank financing.

Europe

Country Key Metric Key Driver
Germany 28% of the regional share Energiewende digital transition
UK CAGR of 9.40% Ofgem RIIO-3 performance targets
France USD 5.70 Billion (2025) Enedis Linky 2.0 program
Italy 12% of regional share E-distribuzione platform upgrade
Spain CAGR of 8.90% Renewable curtailment reduction
Nordic Countries USD 4.10 Billion (2025) Second-generation meter replacements
Russia 4% of regional share Grid reliability compliance
Rest of Europe CAGR of 8.50% EU Energy Efficiency Directive


Europe's digital power utility market is shaped by the EU's Clean Energy Package, which requires member states to deploy interoperable metering infrastructure by 2030 [2]. The UK leads on innovation through Ofgem's RIIO-3 framework, which ties utility returns directly to measurable digital-performance indicators. Nordic utilities, having completed first-generation smart-meter rollouts a decade ago, are now replacing aging devices with communication-rich second-generation units that support 15-minute settlement intervals.

Asia-Pacific

Country Key Metric Key Driver
China 38% of regional share State Grid Corporation digitization
India CAGR of 15.10% RDSS scheme for discom reform
Japan USD 5.80 Billion (2025) Post-Fukushima grid-resilience push
South Korea 14% of regional share KEPCO smart-grid road map
ASEAN CAGR of 14.50% ADB-backed rural electrification
Rest of Asia-Pacific USD 2.60 Billion (2025) Telecom-utility convergence


Asia-Pacific represents the most dynamic growth corridor in the digital power utility market, underpinned by India's RDSS program that earmarks INR 3.03 trillion for distribution-company digitization through 2026 [4]. China's State Grid Corporation has deployed over 660 million smart meters and is now layering analytics platforms on top of that installed base. Southeast Asian markets benefit from Asian Development Bank co-financing that de-risks digital infrastructure investments in the Philippines, Vietnam, and Indonesia.

South America

Country Key Metric Key Driver
Brazil 55% of regional share ANEEL Regulation 1,000 modernization
Argentina CAGR of 10.20% ENARSA distribution reform
Rest of South America USD 2.80 Billion (2025) Multilateral bank financing


Brazil anchors the South American digital power utility market, with ANEEL's regulatory reset compelling distributors like Enel and CPFL to digitize feeder automation and loss-detection systems. Non-technical losses — essentially energy theft — exceed 15% of generated power in several Brazilian concession areas, and digital metering is the primary mitigation tool. Argentina's newly privatized distribution companies are investing in prepaid metering platforms to stabilize cash flows.

Middle East & Africa

Country Key Metric Key Driver
Saudi Arabia 32% of regional share Vision 2030 utility privatization
UAE CAGR of 11.30% DEWA/ADDC digital-utility mandates
South Africa USD 1.90 Billion (2025) Eskom unbundling and metering
Egypt 14% of regional share EETC transmission digitization
Rest of MEA CAGR of 9.80% Off-grid digital metering expansion


Saudi Arabia's NEOM and Red Sea Development projects are embedding digital utility infrastructure from inception, creating showcase deployments for the digital power utility market in the region. The UAE's Dubai Electricity and Water Authority has committed to full AI-driven grid operations by 2030, while South Africa's Eskom restructuring is unlocking previously frozen digital-procurement budgets.


Digital Power Utility Market By Region, 2025-2035

Competitive Benchmarking

The digital power utility market exhibits low concentration, with an estimated HHI below 800 and the top five vendors collectively holding approximately 30–36% of global revenue. Competition is fragmented because the market spans hardware, software, and services — no single company dominates all three. Industrial incumbents with deep utility relationships compete against enterprise-software majors and a growing tier of cloud-native specialists.

Company Est. Revenue Share Range Key Offerings Strategic Positioning
Siemens AG ~7–10% Grid software suite, Xcelerator platform Full-stack digital utility platform
GE Vernova ~6–9% GridOS, ADMS, asset performance management Generation-to-distribution analytics
Schneider Electric ~5–8% EcoStruxure Grid, DERMS Edge-to-cloud energy management
ABB Ltd ~4–7% Ability platform, network management T&D automation and protection
Honeywell International ~3–5% Forge platform, grid-edge intelligence Building-to-grid convergence
Oracle Corporation ~3–5% Oracle Utilities Cloud, CIS, MDM Customer and meter data management
Itron Inc. ~3–5% Riva IoT platform, smart endpoints Metering hardware-software integration
Landis+Gyr Group ~2–4% Revelo platform, smart meters Utility-dedicated metering ecosystem
Cisco Systems ~2–3% IoT networking, grid security Communication infrastructure layer
SAP SE ~2–3% S/4HANA Utilities, analytics cloud Enterprise resource planning for utilities


Recent News & Developments


  • GE Vernova (July 2024): Signed a USD 320 million, ten-year digital-services agreement with Duke Energy covering ADMS, OMS, and predictive analytics for 7.8 million customer endpoints [11].
  • U.S. Department of Energy (March 2024): Awarded USD 3.46 billion in Grid Resilience and Innovation Partnership grants to 58 projects spanning 44 states, with mandatory digital-monitoring components [1].
  • Itron Inc. (September 2023): Deployed 2.4 million Gen-5 smart meters for Southern California Edison as part of a USD 450 million infrastructure-modernization contract [7].
  • Oracle Corporation (June 2023): Released Oracle Utilities Cloud Service with native integration to hyperscaler environments, reducing deployment timelines from 18 months to under 6 months for mid-tier utilities [17].
  • India Ministry of Power (April 2023): Sanctioned INR 1.06 trillion under the RDSS program for smart-metering and distribution-automation across 15 states, benefiting the digital power utility market in Asia-Pacific [4].


Digital Power Utility Market Report Scope

Parameter Detail
Market Scope Global digital power utility market covering integrated solutions, hardware, generation, T&D, storage, and trading/retail
Study Period 2021–2035
CAGR (Forecast) 9.10% (2026–2035)
Market Size — Base Year (2025) USD 140.80 Billion
Market Size — Forecast End (2035) USD 334.40 Billion
Fastest Growing Segment Energy Storage (by sector); Hardware (by technology)
Companies Profiled 10 (Siemens, GE Vernova, Schneider Electric, ABB, Honeywell, Oracle, Itron, Landis+Gyr, Cisco, SAP)
Valuation Currency USD Billion


FAQs

How should utilities prioritize digital investments when budgets are constrained?
Start with outage-management and fault-detection systems because they deliver measurable reliability gains within 12 months, satisfying regulators and generating internal ROI evidence for subsequent investments [10]. Defer enterprise analytics platforms until foundational sensor density is adequate.
What cybersecurity framework best fits a mid-size utility entering the digital power utility market?
NIST CSF 2.0, aligned with NERC CIP standards, provides the most practical compliance-plus-security balance for utilities with under one million connections [16]. Most vendors now offer pre-mapped compliance modules that accelerate implementation.
How do performance-based ratemaking models change vendor selection in the digital power utility market?
They shift procurement criteria from lowest capital cost to demonstrated outcome delivery, favoring vendors that offer guaranteed performance contracts with shared-savings mechanisms [19]. Utilities under such frameworks increasingly prefer platform-as-a-service arrangements.
What integration risks arise when layering digital platforms onto legacy SCADA systems?
Protocol translation between DNP3/IEC-61850 legacy environments and modern APIs creates latency and data-fidelity risks that require dedicated middleware investment [17]. Phased migration with parallel-run validation periods of 6–12 months mitigates operational disruption.
Which financing structures are emerging for digital utility projects in developing economies?
Multilateral blended-finance models — combining World Bank concessional loans with private-equity co-investment — dominate because they de-risk currency and demand uncertainty [20]. Pay-as-you-save structures tied to loss-reduction outcomes are also gaining traction.
How does the digital power utility market address utility data-sovereignty concerns across jurisdictions?
Leading vendors now offer sovereign-cloud deployment options that keep operational data within national borders while enabling anonymized analytics at the global level [16]. Regulatory sandbox approvals in the UK and Singapore have validated these architectures.
What role will quantum computing play in the digital power utility market over the next decade?
Near-term impact is limited to optimization research, with practical grid-scheduling applications unlikely before 2032 [12]. Utilities should monitor quantum-safe encryption readiness rather than quantum-computing adoption for the next five years.    
Author
Author
Author Profile
Chitranshi Jaiswal LinkedIn
Team Lead - Research
Chitranshi is a Team Leader in the Chemicals & Materials (CnM) and Energy & Power (EnP) domains, with 6+ years of experience in market research. She leads and mentors teams to deliver cross-domain projects that equip clients with actionable insights and growth strategies. She is skilled in market estimation, forecasting, competitive benchmarking, and both primary & secondary research, enabling her to turn complex data into decision-ready insights. An engineer and MBA professional, she combines technical expertise with strategic acumen to solve dynamic market challenges. Chitranshi has successfully managed projects that support market entry, investment planning, and competitive positioning, while building strong client relationships. Certified in Advanced Excel & Power BI she leverages data-driven approaches to ensure accuracy, clarity, and impactful outcomes.
Download Free Sample

Kindly complete the form below to receive a free sample of this Report

Download PDF ×

We do not share your information with anyone. However, we may send you emails based on your report interest from time to time. You may contact us at any time to opt-out.

















