Segmentation Quick Reference
| Dimension | Sub-Segments | Dominant Segment | Fastest Growing Segment |
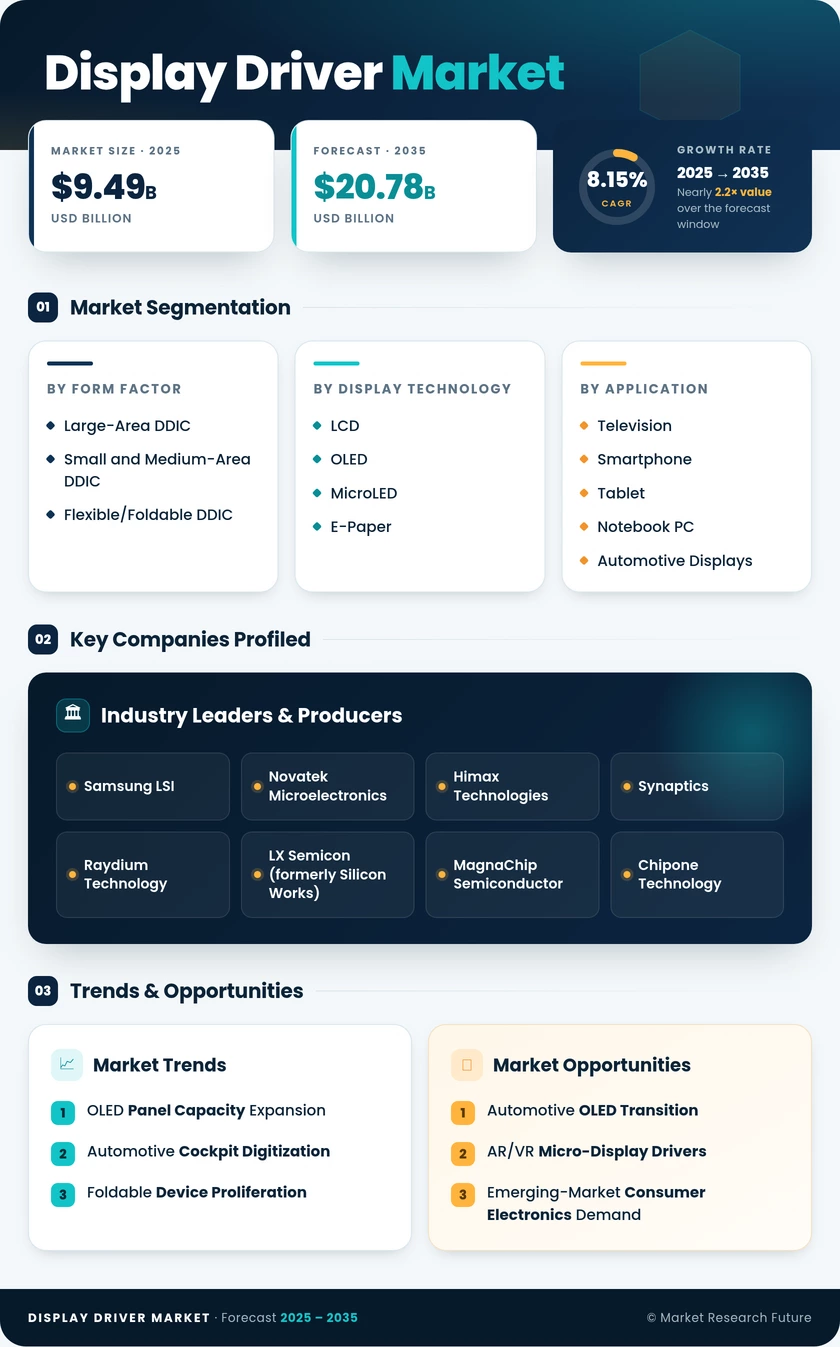
| Form Factor | Large-Area DDIC, Small and Medium-Area DDIC, Flexible/Foldable DDIC | Small and Medium-Area DDIC | Flexible/Foldable DDIC |
| Display Driver Market | LCD, OLED, MicroLED, E-Paper | LCD | MicroLED |
| Application | Television, Smartphone, Tablet, Notebook PC, Automotive Displays, Others | Smartphone | Automotive Displays |
| End-Use Industry | Consumer Electronics, Automotive, Industrial, Others | Consumer Electronics | Automotive |
Market Segmentation Overview
By Form Factor
| Sub-Segment | Key Trend |
| Large-Area DDIC | Stable demand from TV and monitor panels; slow migration toward OLED large-area drivers |
| Small and Medium-Area DDIC | OLED penetration in mid-range smartphones is lifting driver IC ASP and silicon content |
| Flexible/Foldable DDIC | Foldable smartphone and rollable display adoption are driving chip-on-plastic bonding innovation |
Small and medium-area DDICs remain the revenue backbone of the global display driver IC landscape, tracking smartphone and tablet shipment volumes that collectively exceed 1.4 billion units annually. The flexible/foldable segment, while still a fraction of total revenue, is growing at more than double the overall market rate as foldable phone designs standardize and rollable prototypes advance toward commercial launch.
By Display Driver Market
| Sub-Segment | Key Trend |
| LCD | Legacy installed base sustains volume; pricing pressure from commoditization |
| OLED | Rapid mid-range smartphone adoption; IT-OLED panel launches for laptops and monitors |
| MicroLED | Premium consumer and AR/VR adoption; yield improvement as a critical cost-reduction lever |
| E-Paper | Electronic shelf labels and e-reader refresh; low-power driver IC specialization |
LCD technology continues to account for the majority of display driver IC revenue globally, though its share contracts annually as OLED takes hold in smartphone and IT-panel segments. MicroLED represents the most disruptive technology vector, with driver IC architectures diverging significantly from OLED and LCD conventions due to current-mode pixel driving requirements.
By Application
| Sub-Segment | Key Trend |
| Television | Large-panel DDIC demand tied to LCD-to-OLED migration in premium TV lines |
| Smartphone | OLED transition driving a higher pin count and ASP per driver IC unit |
| Tablet | Premium OLED tablets from Apple and Samsung are expanding the addressable DDIC base |
| Notebook PC | OLED laptop adoption is accelerating; TDDI integration is reducing the discrete component count |
| Automotive Displays | Cockpit digitization is multiplying driver IC content per vehicle across multiple screens |
| Others | Industrial HMI, medical monitors, and digital signage are contributing to incremental demand |
Smartphones and televisions together account for the majority of display driver IC shipments by unit volume. Automotive displays, while smaller in absolute terms, represent the fastest-growing Application due to the multiplication of screens per vehicle and stringent qualification requirements that support premium ASPs.
By End-Use Industry
| Sub-Segment | Key Trend |
| Consumer Electronics | Dominant segment encompassing TVs, smartphones, tablets, wearables, and PC monitors |
| Automotive | Fastest-growing end-use driven by EV cockpit electronics and ADAS display integration |
| Industrial | Factory automation HMI panels and medical-grade display monitors |
| Others | Retail signage, aerospace cockpit displays, and defense systems |
Consumer electronics remains the overwhelming demand center for display driver ICs, though the automotive segment is rapidly closing the growth-rate gap as electric vehicle platforms mandate multiple high-resolution screens per vehicle. Industrial applications provide a stable, premium-priced niche where ruggedized driver IC specifications create barriers to entry for commodity-focused suppliers.