

Segmentation Quick Reference
| Dimension | Sub-Segments | Dominant Segment | Fastest Growing Segment |
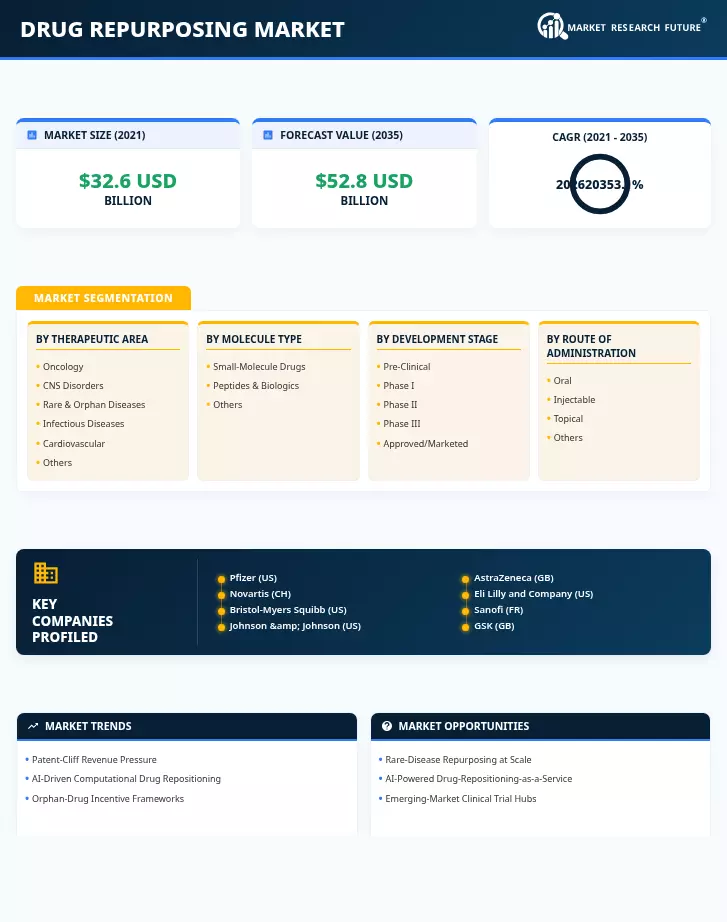
| Therapeutic Area | Oncology, CNS Disorders, Rare & Orphan Diseases, Infectious Diseases, Cardiovascular, Others | Oncology | Rare & Orphan Diseases |
| Molecule Type | Small-Molecule Drugs, Peptides & Biologics, Others | Small-Molecule Drugs | Peptides & Biologics |
| Development Stage | Pre-Clinical, Phase I, Phase II, Phase III, Approved/Marketed | Phase II | Pre-Clinical |
| Route of Administration | Oral, Injectable, Topical, Others | Oral | Injectable |
| End User | Pharmaceutical & Biotechnology Companies, CROs, Academic & Research Institutes, Others | Pharmaceutical & Biotechnology Companies | Contract Research Organizations |
Market Segmentation Overview
By Therapeutic Area
| Sub-Segment | Key Trend |
| Oncology | Combination therapy and immuno-oncology repositioning dominate pipeline activity |
| CNS Disorders | Alzheimer's and Parkinson's candidates drive the largest share of CNS repurposing trials |
| Rare & Orphan Diseases | Orphan-drug incentives and AI screening fuel rapid expansion in rare-disease repositioning |
| Infectious Diseases | Antimicrobial-resistance concerns and pandemic preparedness sustain repositioning investment |
| Cardiovascular | Off-patent statins and antihypertensives are being re-evaluated for anti-inflammatory indications |
| Others | Autoimmune and metabolic conditions represent emerging therapeutic reprofiling opportunities |
Oncology retains the largest revenue share across the Drug Repurposing Market, driven by high unmet need and premium pricing for repurposed combination regimens. Rare and orphan diseases are accelerating fastest as regulatory incentives and venture capital converge on underserved patient populations.
By Molecule Type
| Sub-Segment | Key Trend |
| Small-Molecule Drugs | Deep safety databases and low reformulation costs sustain dominance |
| Peptides & Biologics | Biosimilar capacity and falling manufacturing costs enable biologic repurposing |
| Others (Nucleic Acids, Cell Therapies) | Early-stage exploration of advanced-modality repositioning strategies |
Small molecules account for the majority of the Drug Repurposing Market due to their well-characterized pharmacokinetic profiles and regulatory familiarity. Peptides and biologics are the fastest-growing segment as manufacturing economics improve and computational tools extend to protein-level analysis.
By Development Stage
| Sub-Segment | Key Trend |
| Pre-Clinical | AI-driven screening compresses early-stage timelines |
| Phase I | Safety re-characterization for dose-finding in new indications |
| Phase II | Largest segment; proof-of-concept trials validate repositioning hypotheses |
| Phase III | Pivotal efficacy studies required for label-expansion approvals |
| Approved/Marketed | Post-approval studies and real-world evidence support indication expansion |
Phase II dominates the Drug Repurposing Market by development stage, as this represents the critical go/no-go decision point for therapeutic reprofiling candidates. Pre-clinical activity is surging as computational tools enable rapid identification and prioritization of repositioning candidates.
By Route of Administration
| Sub-Segment | Key Trend |
| Oral | Patient compliance and established formulation technology maintain dominance |
| Injectable | Biologics repurposing and hospital-setting administration drive growth |
| Topical | Dermatology and wound-care repositioning represent niche but stable demand |
| Others | Inhalation and transdermal delivery for repurposed respiratory and CNS compounds |
Oral formulations lead the Drug Repurposing Market, reflecting the small-molecule dominance of the repurposing pipeline. Injectable routes are growing fastest as peptide and biologic repurposing activity expands.
By End User
| Sub-Segment | Key Trend |
| Pharmaceutical & Biotechnology Companies | Internal repurposing programs offset patent-cliff revenue losses |
| Contract Research Organizations | End-to-end repurposing service platforms gain traction |
| Academic & Research Institutes | Government-funded translational research drives early-stage repositioning |
| Others | Nonprofit and global-health organizations fund access-oriented repurposing |
Pharmaceutical and biotechnology companies dominate the Drug Repurposing Market as end users, leveraging existing drug portfolios for lifecycle extension. CROs are growing fastest as outsourced repositioning models gain acceptance across mid-tier pharma companies.


