Segmentation Quick Reference
| Dimension | Sub-Segments | Dominant Segment | Fastest Growing Segment |
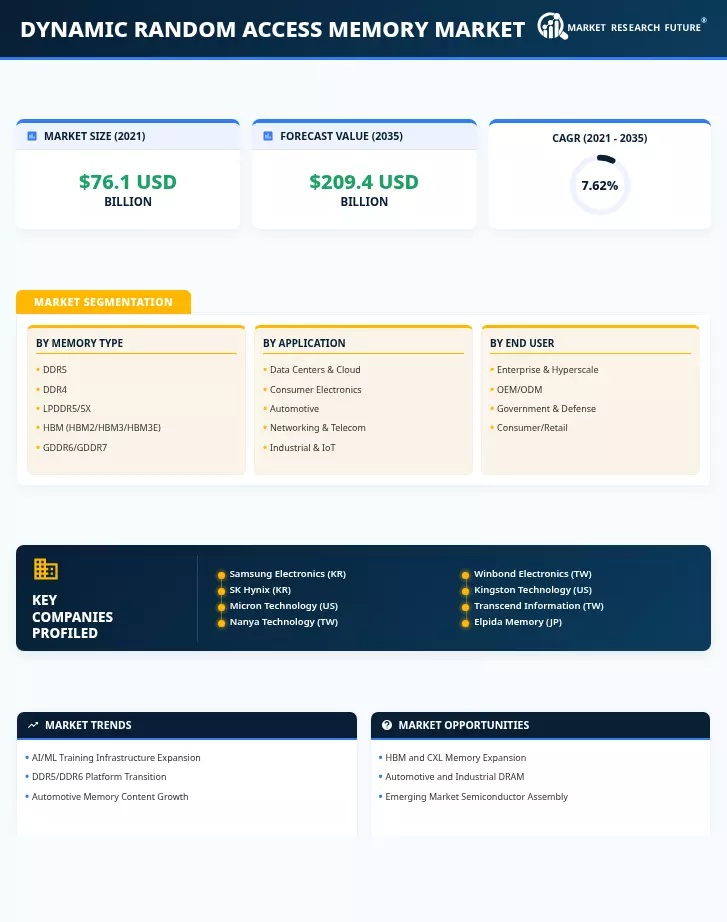
| By Memory Type | DDR5, DDR4, LPDDR5/5X, HBM (HBM2/HBM3/HBM3E), GDDR6/GDDR7 | DDR5 (~38% share) | HBM (18.5% CAGR) |
| By Application | Data Centers & Dynamic Random Access Memory Market, Consumer Electronics, Automotive, Networking & Telecom, Industrial & IoT | Data Centers & Dynamic Random Access Memory Market (~35% share) | Automotive (11.2% CAGR) |
| By End User | Enterprise & Hyperscale, OEM/ODM, Government & Defense, Consumer/Retail | Enterprise & Hyperscale (~44% share) | OEM/ODM (6.9% CAGR) |
Market Segmentation Overview
By Memory Type
| Sub-Segment | Key Trend |
| DDR5 | Server platform mandates from Intel/AMD are driving a rapid DDR4-to-DDR5 transition. |
| DDR4 | Legacy installed base declines; budget PCs and older servers sustain residual demand. |
| LPDDR5/5X | Smartphone SoC integration is increasing average content per device to 10–16 GB |
| HBM (HBM2/HBM3/HBM3E) | AI GPU co-packaging demand is creating multi-year supply constraints |
| GDDR6/GDDR7 | Gaming GPU refresh cycles and JEDEC GDDR7 ratification fueling bandwidth upgrades |
The memory type segmentation reflects DRAM's diversification from a commodity PC component into a portfolio of specialized products serving distinct bandwidth, power, and density requirements across servers, mobile devices, GPUs, and AI accelerators.
By Application
| Sub-Segment | Key Trend |
| Data Centers & Dynamic Random Access Memory Market | Hyperscaler AI infrastructure is driving 1 TB+ memory per server configurations. |
| Consumer Electronics | LPDDR5 adoption in flagship smartphones and thin-and-light laptops |
| Automotive | ADAS and centralized compute architectures requiring automotive-grade ECC DRAM |
| Networking & Telecom | 5G RAN and edge routing equipment increasing per-node memory content |
| Industrial & IoT | Factory automation and smart meters are creating incremental low-power DRAM demand. |
Application segmentation highlights the shift in DRAM demand gravity from consumer PCs toward enterprise data centers and automotive electronics, with the latter category exhibiting the strongest CAGR through the forecast period.
By End User
| Sub-Segment | Key Trend |
| Enterprise & Hyperscale | Dynamic Random Access Memory Market CAPEX budgets growing 25–30% annually; procurement increasingly centralized |
| OEM/ODM | PC, server, and smartphone manufacturers are integrating DRAM earlier in design cycles. |
| Government & Defense | Secure computing and space-grade memory requirements supporting premium pricing |
| Consumer/Retail | DIY PC builds and gaming peripheral upgrades are sustaining aftermarket module sales |
End-user segmentation captures the purchasing dynamics across the DRAM value chain, from direct hyperscaler procurement to retail channel distribution, reflecting how buying power concentration among three to five cloud customers is reshaping supplier negotiations.