Segmentation Quick Reference
| Dimension | Sub-Segments | Dominant Segment | Fastest Growing Segment |
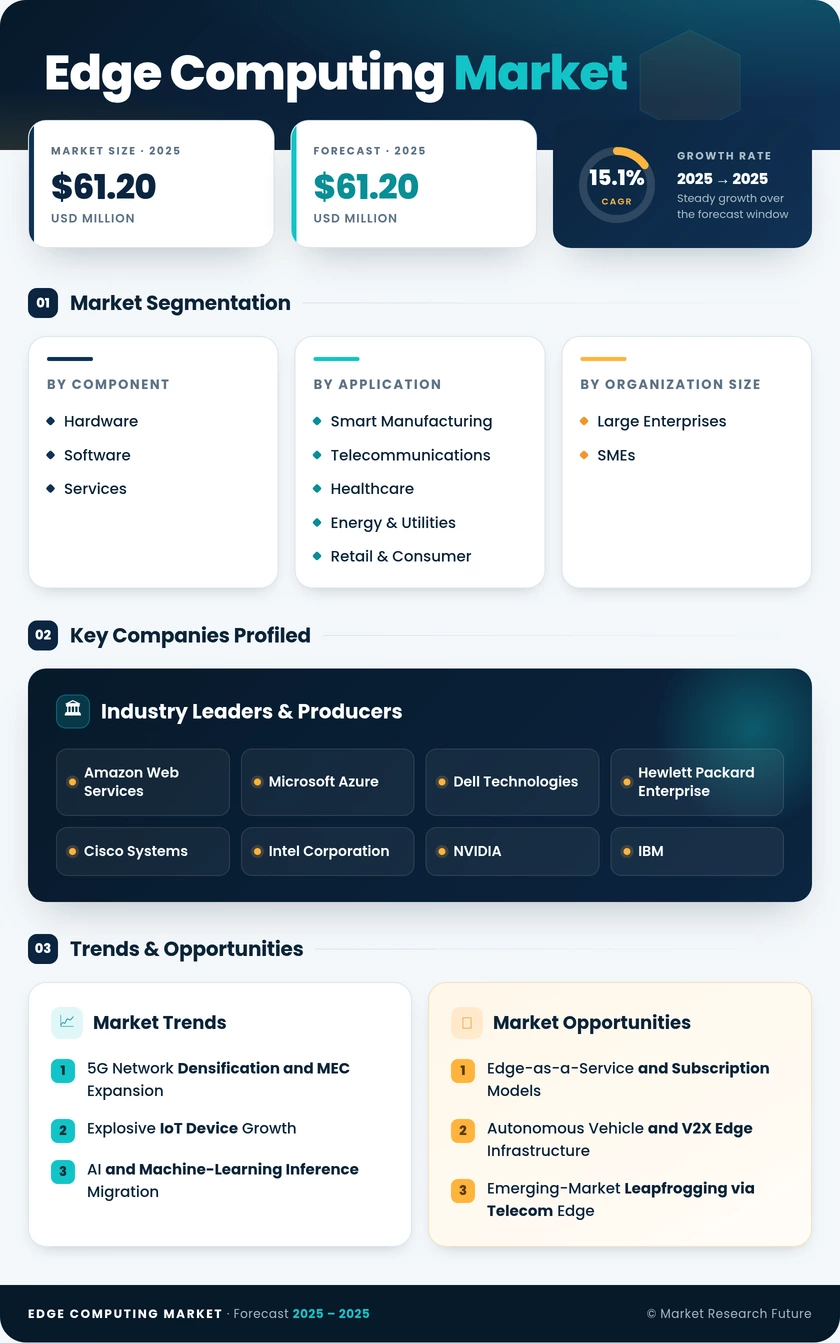
| By Component | Hardware, Software, Services | Hardware (~45% share, 2025) | Software (CAGR 17.2%) |
| By Application | Smart Manufacturing, Telecommunications, Healthcare, Energy & Utilities, Retail & Consumer, Transportation & Logistics, BFSI, Others | Smart Manufacturing (~22% share, 2025) | Telecommunications (CAGR 16.5%) |
| By Organization Size | Large Enterprises, SMEs | Large Enterprises (~68% share, 2025) | SMEs (CAGR 18.6%) |
| By Region | North America, Europe, Asia-Pacific, South America, Middle East & Africa | North America (~38% share, 2025) | Asia-Pacific (CAGR 17.8%) |
Market Segmentation Overview
By Component
| Sub-Segment | Key Trend |
| Hardware | AI-accelerator-equipped edge servers replacing legacy gateway appliances |
| Software | Kubernetes-native orchestration platforms (K3s, KubeEdge) gaining enterprise traction |
| Services | Edge-as-a-service subscription models replacing CapEx-heavy procurement |
Hardware investment remains anchored in the refresh cycle from first-generation edge nodes to AI-capable servers equipped with GPUs or dedicated inference chips. Software platforms are converging around container orchestration, enabling workload portability across heterogeneous edge sites. Services growth reflects enterprise preference for managed deployment models that bundle hardware, connectivity, and ongoing operations under a single SLA.
By Application
| Sub-Segment | Key Trend |
| Smart Manufacturing | Digital-twin integration and predictive-maintenance inference at the shop floor |
| Telecommunications | Multi-access edge computing enabling 5G network slicing and private-network services |
| Healthcare | Real-time medical imaging AI and remote patient monitoring at hospital edge |
| Energy & Utilities | Grid-edge analytics for renewable integration and demand-response optimization |
| Retail & Consumer | In-store computer vision, cashierless checkout, and personalized AR experiences |
| Transportation & Logistics | V2X communication, fleet telematics, and autonomous-vehicle roadside compute |
| BFSI | Low-latency trading, fraud detection at point-of-sale, and ATM analytics |
| Others | Edge Computing Market, defense, education, and smart-building management |
Manufacturing and telecommunications together account for over 38% of total edge computing spending, driven by the convergence of operational technology and information technology at the network's periphery. Healthcare is emerging as a high-growth vertical as regulatory bodies approve AI-assisted diagnostics that require on-premises data processing for patient privacy compliance.
By Organization Size
| Sub-Segment | Key Trend |
| Large Enterprises | Multi-site hybrid-cloud edge strategies integrated with existing AWS/Azure/GCP contracts |
| SMEs | Adoption accelerating via edge-as-a-service, managed solutions, and pay-per-use pricing |
Large enterprises lead current deployment volumes, but SMEs represent the next growth frontier as subscription-based edge services democratize access to distributed compute capabilities previously reserved for organizations with dedicated infrastructure teams.