Electric Insulator Market

Key Players: ABB Ltd, Siemens Energy, GE Vernova, NGK Insulators, Hubbell Incorporated, Seves Group (Sediver), TE Connectivity, Dalian Insulator Group

Electric Insulator Market

Electric Insulator Market Research Report By Dielectric Material (Ceramic/Porcelain, Glass, Composite/Polymer), By Voltage Rating (Low Voltage, Medium Voltage, High Voltage, Extra- and Ultra-High Voltage), By Installation Environment (Outdoor, Indoor), By Application (Transmission Lines, Substations and Switchgear, Other Applications), By End User (Utilities, Industrial, Residential and Other) and By Regional (North America, Europe, South America, Asia Pacific, Middle East and Africa) - Growth & Industry Forecast to 2035
ID: MRFR/EnP/5504-HCR
111 Pages
Priya Nagrale
Last Updated: June 22, 2026

Electric Insulator Market Summary

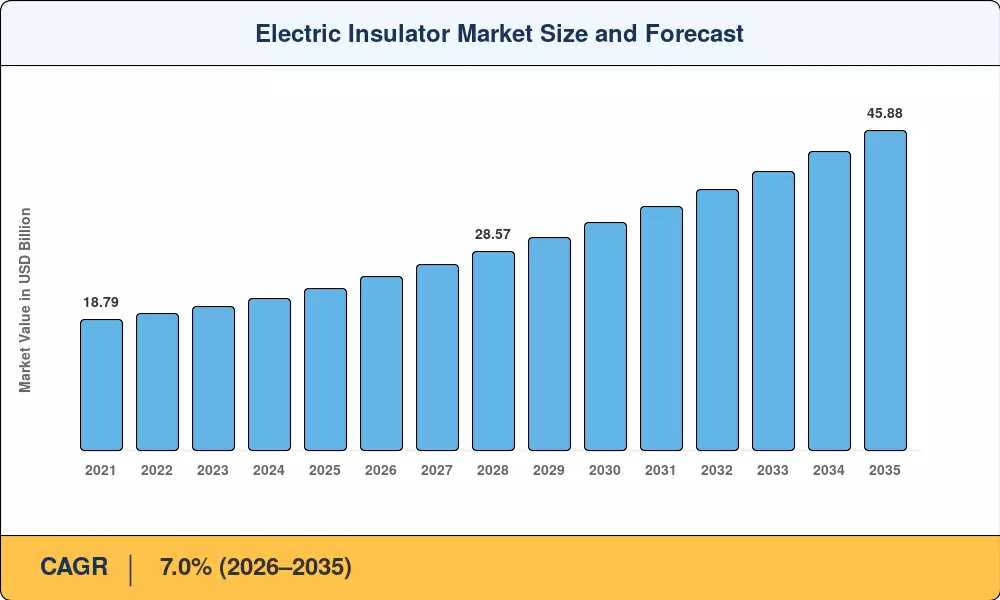
The Electric Insulator Market reached an estimated USD 23.28 Billion in 2025 and is projected to climb from USD 24.95 Billion in 2026 to USD 45.88 Billion by 2035, advancing at a compound annual growth rate of 7.0% across the forecast period. This expansion is anchored in two converging forces: a global wave of grid-hardening investments exceeding USD 680 Billion through the decade [1], and the accelerating build-out of ultra-high-voltage direct-current corridors connecting renewable generation hubs to urban load centers. Utilities across mature and developing economies alike are replacing aging insulator fleets installed during the mid-twentieth-century electrification cycle, while new HVDC interconnections demand insulator specifications that legacy ceramic designs struggle to meet.

The technology landscape within the Electric Insulator Market is undergoing a generational shift. Traditional porcelain and glass insulator strings — workhorses of transmission grids for over a century — are yielding ground to silicone-rubber composite designs that weigh 70–80% less and resist pollution flashover far more effectively [2]. China's State Grid Corporation alone committed over USD 28 Billion to UHV transmission between 2023 and 2025, driving the largest single source of insulator procurement globally [3]. India's Green Energy Corridor Phase II, backed by USD 8.6 Billion in government support, has similarly catalyzed demand for high-voltage composite units rated above 400 kV [4].

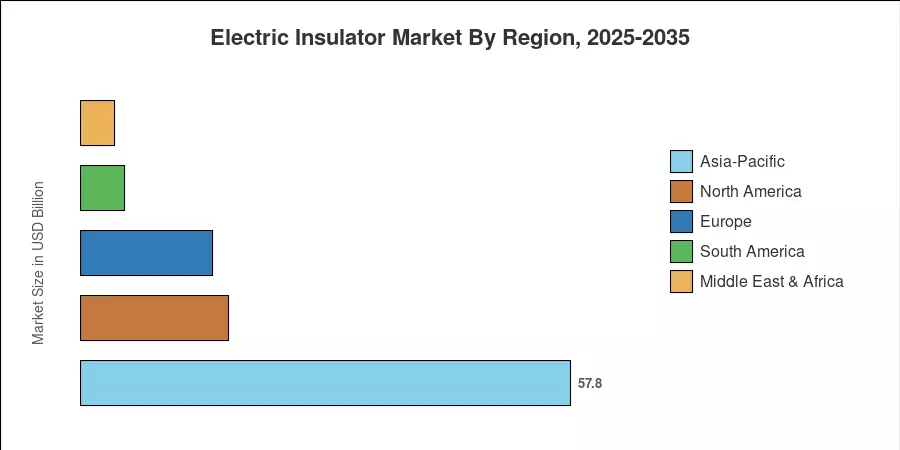
Asia-Pacific commands the dominant position in the Electric Insulator Market with approximately 57.8% of global revenue in 2025, propelled by China's ultra-high-voltage program and India's renewable-evacuation corridors. The region also registers the fastest projected CAGR at 7.8% through 2035. Europe holds the second-largest share at roughly 15.6%, driven by offshore wind interconnections and the European Commission's TEN-E infrastructure mandates [5]. North America's share stands near 17.4%, supported by the U.S. Department of Energy's Building a Better Grid Initiative, allocating USD 20 Billion to transmission modernization [6]. The Electric Insulator Market outlook through the next decade hinges on how quickly utilities transition procurement cycles toward composite polymer insulator line solutions and how regulatory bodies harmonize testing standards across trade blocs.


Key Report Takeaways

• By Dielectric Material

  • Ceramic and porcelain insulators captured approximately 48.2% of the Electric Insulator Market share in 2025, underpinned by long service life and lower unit cost for standard distribution voltages.
  • Composite and polymer variants are forecast to register the fastest segment CAGR of 8.3% between 2026 and 2035, driven by weight savings and pollution resistance for HVDC corridors.

• By Voltage Rating & Application

  • Medium-voltage products accounted for the largest revenue share among voltage categories in the Electric Insulator Market in 2025, reflecting deep penetration in urban distribution networks.
  • Transmission line applications led with approximately 44.5% of the Electric Insulator Market in 2025, with HVDC sub-applications expected to outpace the overall segment.

• By Region

  • Asia-Pacific held roughly 57.8% of the Electric Insulator Market in 2025, with China and India together driving more than two-thirds of regional demand.
  • North America's share stood at 17.4%, supported by federal grid-modernization legislation and wildfire-mitigation insulator upgrades across the western United States.


Market Size and Forecast (2021–2035)

Market Research Future's Electric Insulator Market sizing integrates top-down regulatory-spending analysis with bottom-up OEM shipment tracking across 28 country markets. Historical figures (2021–2024) are triangulated against utility capital-expenditure disclosures and customs trade data; forecast values (2026–2035) apply scenario-weighted CAGR modeling anchored to grid-investment pipelines published by IEA and national transmission authorities [1][7].

Electric Insulator Market Size and Forecast
Our Impact
Enabled $4.3B Revenue Impact for Fortune 500 and Leading Multinationals
Partnering with 2000+ Global Organizations Each Year
30K+ Citations by Top-Tier Firms in the Industry

Driver Impact Analysis

Driver ~% Impact on CAGR Geographic Relevance Impact Timeline
UHV and HVDC corridor expansion ~1.8% Asia-Pacific, Europe Medium-term (2–4 yr)
Grid-hardening and wildfire mitigation ~1.2% North America, Australia Short-term (≤2 yr)
Renewable energy evacuation infrastructure ~1.1% India, Middle East, Brazil Medium-term (2–4 yr)
Electrification of transport corridors ~0.8% EU, China, North America Long-term (≥4 yr)
Aging insulator replacement cycle ~0.7% Global (OECD-heavy) Short-term (≤2 yr)
Offshore wind interconnection buildout ~0.6% Europe, Asia-Pacific Medium-term (2–4 yr)
Smart grid sensor-integrated insulators ~0.4% North America, Europe Long-term (≥4 yr)


UHV and HVDC Corridor Expansion

China's State Grid has committed more than USD 28 Billion to UHV transmission across its 14th and 15th Five-Year Plans, creating a procurement pipeline of over 12 million insulator units annually [3]. Each ±1,100 kV DC line requires insulator strings rated above 30 kN mechanical strength with composite pollution-class IV performance, pushing specification envelopes well beyond conventional porcelain capabilities. India's Leh-Ladakh HVDC link and Europe's NordLink and NeuConnect corridors add further demand that elevates this driver's influence on the Electric Insulator Market above all others through 2030.

Grid-Hardening and Wildfire Mitigation

Utilities in California, Australia, and southern Europe have accelerated insulator replacement on fire-prone corridors following catastrophic wildfire seasons. Pacific Gas & Electric's 2024 capital plan earmarked USD 5.4 Billion for system hardening, including the replacement of more than 250,000 ceramic insulator units with pollution-resistant composite designs in high-fire-threat zones [6]. These programs compress typical 40-year replacement cycles into 5–8-year windows, creating concentrated procurement spikes that reshape regional demand.

Renewable Energy Evacuation Infrastructure

India's Green Energy Corridor Phase II envisions 10,750 circuit-km of new 765 kV transmission across Rajasthan, Gujarat, and Tamil Nadu [4]. Brazil's planned 12,000 km of 500 kV lines connecting northern hydro and wind resources to southeastern load centers will require over 6 million insulator units by 2032 [14]. Both programs anchor the Electric Insulator Market growth trajectory in emerging economies through the next decade.

Electrification of Transport Corridors

The European Commission's Alternative Fuels Infrastructure Regulation mandates 3.5 million public EV charge points by 2030, each cluster requiring medium-voltage distribution feeders with upgraded insulation ratings [12]. China's high-speed rail expansion — targeting 70,000 km by 2035 — similarly drives demand for catenary-grade insulators rated for sustained vibration and thermal cycling. Transport-corridor electrification represents a nascent but structurally durable demand pillar for the Electric Insulator Market.


Restraints Impact Analysis

Restraint ~% Impact on CAGR Geographic Relevance Impact Timeline
Raw-material price volatility (silicone, alumina) –0.5% Global Short-term (≤2 yr)
Extended pre-qualification audit timelines –0.4% OECD markets Medium-term (2–4 yr)
Quality disputes and safety recalls –0.3% Asia-Pacific exports Short-term (≤2 yr)
Underground cabling substitution –0.3% Europe, dense urban Asia Long-term (≥4 yr)
Fragmented testing and certification standards –0.2% Cross-border trade Medium-term (2–4 yr)


Raw-Material Price Volatility

Silicone rubber — the primary housing material for composite insulators — experienced price swings of 18–25% between 2022 and 2024 as Chinese silicone-metal capacity tightened under energy-curtailment policies [8]. Alumina trihydrate filler costs tracked similar volatility. These fluctuations compress manufacturer margins and delay utility procurement decisions, creating demand lumpiness that can suppress near-term Electric Insulator Market growth by an estimated half-percentage point.

Extended Pre-Qualification Audits

Following field failures traced to substandard composite housings, several European and North American utilities extended supplier pre-qualification timelines beyond 18 months, with Hydro-Québec and Terna both adding fourth-year aging tests in 2024 [10]. While these measures improve long-term grid safety, they restrict market access for newer manufacturers and slow the adoption of innovative designs, acting as a structural friction on the Electric Insulator Market.

Underground Cabling Substitution

Dense urban areas in the Netherlands, Singapore, and parts of Tokyo increasingly mandate underground cabling for new distribution circuits, eliminating overhead insulator demand entirely [15]. European DSOs report that 32% of new medium-voltage circuits installed in 2023 were underground — a share projected to reach 40% by 2030, eroding a meaningful slice of the addressable Electric Insulator Market in developed urban corridors.


Electric Insulator Market Opportunities

Smart Sensor-Integrated Insulators

By embedding IoT leakage-current sensors and GPS-enabled asset tags directly into composite insulator housings, manufacturers wanting to transition from selling hardware to condition-monitoring-as-a-service can create a recurring revenue stream. Enel and Duke Energy’s pilot installations in 2024 reported 35% savings in unplanned outages on monitored circuits [13]. This synergy of insulation and digital infrastructure enables high-margin upselling opportunities inside the Electric Insulator Market.


Africa and Southeast Asia Rural Electrification

The electrification rate of sub-Saharan Africa is still below 50 %, and the African Development Bank’s Desert-to-Power plan aims for 310 GW of solar power, which requires a massive transmission build-out [16]. Countries in Southeast Asia, such as Vietnam and the Philippines, aim to add more than 35,000 circuit-km of 220–500 kV lines by 2032 [17]. These emerging market projects provide the biggest untapped volume opportunity for the Electric Insulator Market.

,,

HVDC Super-Grid Interconnections

Proposed multi-terminal HVDC networks – Europe’s SuperGrid effort, ASEAN Grid, Australia-Singapore Sun Cable – require unique DC insulators that can handle polarity reversal and space-charge effects that regular AC designs cannot [11]. This growing category of ultra-specialized devices demonstrate 2-3x price premiums vs. standard AC equivalents, thus increasing the available value pool in Electric Insulator Market.


Recycling and Circular-Economy Business Models

Spent insulators of porcelain and glass have recoverable alumina and borosilicate content with the value of USD 120-180 /t [18]. Simultaneously, it helps manufacturers to minimize procurement costs and to adhere to the tightening EU Corporate Sustainability Reporting Directive standards, generating a competitive distinction in the Electric Insulator Market.


EV Charging Infrastructure Insulation

The global push toward electrified transport corridors demands medium-voltage distribution upgrades at charging hubs, each requiring 50–120 insulator units per cluster, depending on voltage class [12]. This nascent application segment offers manufacturers a diversification pathway beyond traditional utility procurement channels.


Electric Insulator Market Future Outlook

AI-Enabled Predictive Insulator Maintenance

Machine-learning algorithms trained on leakage-current waveforms and thermal imaging are moving from pilot to production deployment across major utilities. EPRI projects that AI-driven insulator condition monitoring will reduce flashover-related outages by 45% on instrumented circuits by 2030, creating a premium tier within the Electric Insulator Market for sensor-ready insulator platforms [13][19].

HVDC Super-Grid Economics

The IEA's 2024 World Energy Outlook identifies multi-terminal HVDC networks as a "transformative infrastructure class" requiring cumulative investment of USD 1.2 Trillion globally by 2040 [1]. Each gigawatt of HVDC transfer capacity demands approximately USD 8–12 Million in specialized DC insulation hardware, positioning the Electric Insulator Market to capture a meaningful share of this capital cycle.

Electrification Supercycle and Transport Corridors

The convergence of EV charging infrastructure, high-speed rail electrification, and green-hydrogen electrolyzer grid connections is generating distribution-level insulator demand that did not exist a decade ago. BloombergNEF estimates global electrification capital spending will exceed USD 2.8 Trillion annually by 2030, with transmission and distribution insulation accounting for roughly 1.8% of that total [12][20].

ESG Reporting and Circular Procurement

Tightening ESG disclosure requirements — including the EU's CSRD and the SEC's climate-risk rules — are pushing utilities to demand lifecycle carbon assessments from insulator suppliers [18]. Manufacturers offering recycled-content porcelain or bio-based silicone compounds gain procurement scoring advantages, reshaping competitive positioning in the Electric Insulator Market and rewarding vertically integrated producers who control raw-material inputs.


Electric Insulator Market Segmentation

By Dielectric Material

Segment Key Metric Primary Demand Driver
Ceramic/Porcelain 48.2% share (2025) Cost-effective for standard distribution voltages
Glass USD 3.96 Billion (2025) Toughened-glass demand for self-cleaning applications
Composite/Polymer 8.3% CAGR (2026–2035) HVDC, pollution-prone, and seismic-zone corridors


Ceramic and porcelain insulators remain the backbone of the Electric Insulator Market, particularly in low- and medium-voltage distribution applications where their decades-long field track record and competitive pricing sustain dominant procurement volumes. Utilities in mature markets continue specifying porcelain for standard 33–66 kV lines where pollution severity is low and mechanical loads are moderate.

Composite and polymer insulators, however, are capturing an outsized share of new-build and replacement procurement across high-voltage and extra-high-voltage applications. Their lighter weight cuts tower structural costs by 15–20%, while hydrophobic silicone housings resist contamination flashover in coastal, industrial, and desert environments [2]. The Electric Insulator Market's shift toward composites accelerates with every new HVDC corridor commissioned, as DC insulation demands unique creepage-distance calculations that composites satisfy more cost-effectively than porcelain at voltages above 400 kV.

By Voltage Rating

Segment Key Metric Primary Demand Driver
Low Voltage USD 3.15 Billion (2025) Residential and commercial distribution
Medium Voltage 42.8% share (2025) Urban distribution grid density
High Voltage 7.4% CAGR (2026–2035) Renewable integration at 220–400 kV
Extra- and Ultra-High Voltage 8.4% CAGR (2026–2035) UHV DC/AC corridors above 765 kV [3]


Medium-voltage insulators dominate by volume in the Electric Insulator Market, driven by the sheer scale of global distribution networks serving commercial, industrial, and residential endpoints. Extra- and ultra-high-voltage segments, though smaller in absolute terms, command the highest growth rates as cross-border HVDC interconnections and UHV AC backbone grids expand across Asia, Europe, and South America.

By Installation Environment

Segment Key Metric Primary Demand Driver
Outdoor 68.2% share (2025) Overhead transmission and distribution lines
Indoor 5.8% CAGR (2026–2035) GIS substations and switchgear enclosures


Outdoor insulators represent the clear majority of the Electric Insulator Market, reflecting the global installed base of overhead transmission and distribution circuits. Indoor insulator demand, while smaller, grows steadily as gas-insulated switchgear installations expand in space-constrained urban substations.

By Application

Segment Key Metric Primary Demand Driver
Transmission Lines 44.5% share (2025) Grid backbone expansion and replacement
Substations and Switchgear 7.1% CAGR (2026–2035) GIS adoption and transformer bushing upgrades
Other Applications USD 3.42 Billion (2025) Railway catenary, industrial plants, telecom


Transmission lines anchor the largest application segment in the Electric Insulator Market, with procurement volumes directly tied to new-build corridor lengths and replacement cycles on aging lines. HVDC transmission sub-applications are expected to outpace conventional AC line demand, reflecting the global shift toward long-distance bulk power transfer.

By End User

Segment Key Metric Primary Demand Driver
Utilities 66.5% share (2025) Regulated CAPEX programs for T&D expansion
Industrial 7.5% CAGR (2026–2035) Data centers, mining, heavy manufacturing
Residential and Other USD 2.68 Billion (2025) Rural electrification and distributed generation


Utilities overwhelmingly dominate procurement in the Electric Insulator Market, channeling insulator purchasing through multi-year framework contracts with pre-qualified suppliers. Industrial end users — particularly hyperscale data centers and mining operations — represent an accelerating demand pocket as these facilities build dedicated medium- and high-voltage feeds bypassing distribution networks.


Regional Market Share Analysis

Region Key Metric Primary Investment Themes
Asia-Pacific 57.8% share (2025) UHV build-out, renewable evacuation, rural electrification
North America 17.4% share (2025) Grid hardening, wildfire mitigation, IIJA funding
Europe 15.6% share (2025) Offshore wind interconnection, TEN-E corridors
South America 5.2% share (2025) Hydro/wind transmission, cross-border links
Middle East & Africa 4.0% share (2025) Nuclear tie-ins, solar corridors, rural access
Total 100%

The Electric Insulator Market exhibits pronounced geographic concentration, with Asia-Pacific generating well over half of global revenue. Regional dynamics reflect divergent grid maturity levels, regulatory frameworks, and infrastructure investment cycles across five macro-regions.


North America

Country Key Metric Key Driver
United States 7.6% CAGR (2026–2035) IIJA and IRA grid-modernization funding [6]
Canada USD 1.22 Billion (2025) Hydro-Québec and BC Hydro interties
Mexico 5.8% CAGR (2026–2035) CFE transmission expansion program


The United States anchors North American demand for the Electric Insulator Market, with the Department of Energy's Building a Better Grid Initiative channeling USD 20 Billion into new and upgraded transmission corridors through 2030 [6]. California's wildfire-driven insulator replacement programs and ERCOT's grid-resilience investments following Winter Storm Uri have compressed procurement timelines. Canada's interprovincial hydro interties and Mexico's CFE modernization contribute supplementary demand, though at smaller absolute scales.

Europe

Country Key Metric Key Driver
Germany USD 0.98 Billion (2025) SuedLink and SuedOstLink HVDC corridors [5]
United Kingdom 6.9% CAGR (2026–2035) Offshore wind grid connections
France USD 0.62 Billion (2025) Nuclear fleet life-extension refurbishment
Italy 6.5% CAGR (2026–2035) Terna's Tyrrhenian Link HVDC
Spain USD 0.38 Billion (2025) Solar evacuation infrastructure
Nordic Countries 7.2% CAGR (2026–2035) Cross-border HVDC interties
Russia USD 0.31 Billion (2025) Domestic grid maintenance
Rest of Europe 6.4% CAGR (2026–2035) EU cohesion-fund grid upgrades


Europe's Electric Insulator Market growth centers on Germany's ambitious north-south HVDC corridor program, which will install over 4,000 km of ±525 kV DC lines requiring specialized composite insulator strings by 2030 [5]. The United Kingdom's offshore wind target of 50 GW by 2030 necessitates subsea-to-onshore HVAC cable terminations and GIS bushing insulators. Nordic interconnectors — NordLink, NordBalt, and the planned Hansa PowerBridge — are expanding the regional HVDC insulator procurement pipeline steadily.

Asia-Pacific

Country Key Metric Key Driver
China 34.2% of global market (2025) UHV AC/DC super-grid expansion [3]
India 8.5% CAGR (2026–2035) Green Energy Corridor Phase II [4]
Japan USD 1.48 Billion (2025) Grid resilience post-Noto earthquake
South Korea 7.1% CAGR (2026–2035) Offshore wind grid integration
ASEAN 8.2% CAGR (2026–2035) Vietnam and Philippines transmission build-out [17]
Rest of Asia-Pacific USD 0.74 Billion (2025) Australia-Singapore interconnector planning


Asia-Pacific dominates the Electric Insulator Market by a wide margin, with China alone representing roughly a third of global demand. State Grid Corporation's UHV program has deployed 38 operational UHV lines as of 2025, with another 14 under construction [3]. India's transmission network expansion — adding 62,000 circuit-km between 2024 and 2030 — creates the region's second-largest procurement pipeline [4]. Japan's post-earthquake grid-resilience investments and South Korea's offshore wind interconnection plans round out a region where insulator demand growth consistently outpaces the global average.

South America

Country Key Metric Key Driver
Brazil 6.8% CAGR (2026–2035) North-south 500 kV wind/hydro corridors [14]
Argentina USD 0.28 Billion (2025) Vaca Muerta power-evacuation lines
Rest of South America 5.9% CAGR (2026–2035) Chile-Argentina interconnection projects


Brazil drives over 60% of the South American Electric Insulator Market revenue, with ANEEL-regulated transmission auctions consistently awarding 3,000–5,000 km of new 500 kV lines annually [14]. The country's northern wind belt and Amazonian hydro resources require long-distance evacuation corridors traversing high-humidity environments that favor composite insulator adoption. Argentina's Vaca Muerta-associated power infrastructure and Chile's mining-region electrification projects contribute incremental growth.

Middle East & Africa

Country Key Metric Key Driver
Saudi Arabia 7.4% CAGR (2026–2035) NEOM and Vision 2030 grid build-out [9]
UAE USD 0.18 Billion (2025) Nuclear plant grid tie-in (Barakah)
South Africa 6.1% CAGR (2026–2035) Eskom grid rehabilitation
Egypt USD 0.12 Billion (2025) Benban solar complex evacuation
Rest of MEA 7.8% CAGR (2026–2035) AfDB Desert-to-Power initiative [16]


The Middle East & Africa region represents the smallest but increasingly dynamic slice of the Electric Insulator Market. Saudi Arabia's NEOM and Red Sea developments require greenfield transmission networks designed for extreme desert-pollution conditions, favoring silicone-housed composite designs [9]. South Africa's Eskom is undertaking a multi-year grid-rehabilitation program after years of deferred maintenance, while sub-Saharan African nations are progressing rural electrification programs that create high-volume, cost-sensitive insulator demand [16].


Electric Insulator Market By Region, 2025-2035

Competitive Benchmarking

The Electric Insulator Market exhibits moderate concentration, with the top five manufacturers capturing an estimated 32–38% of global revenue and a Herfindahl-Hirschman Index suggesting a competitive but not fragmented structure. Competition has intensified as Chinese manufacturers scale composite production at landed costs roughly half those of Western incumbents, prompting IEC 62217 standard tightening and extended utility pre-qualification audits in OECD markets [10]. Strategic M&A, backward integration into silicone compounding, and digital service offerings differentiate the leading players.

Company Est. Revenue Share Range Key Offerings Strategic Positioning
ABB Ltd ~8–11% HV/EHV composite and porcelain bushings, GIS insulators Integrated grid solutions with digital monitoring
Siemens Energy ~7–10% Transformer bushings, GIS insulators, HVDC components End-to-end T&D portfolio across voltage classes
GE Vernova ~6–9% Porcelain and composite line insulators, substation bushings Scale manufacturing with global service footprint
NGK Insulators ~5–8% Porcelain long-rod and suspension insulators, NAS batteries Japanese quality heritage; diversified ceramics base
Hubbell Incorporated ~4–7% Distribution-class porcelain and polymer insulators Strong North American utility distribution channel
Seves Group (Sediver) ~4–6% Toughened-glass insulators, composite hollow cores Glass-insulator market leader; European heritage
TE Connectivity ~3–5% Medium-voltage separable connectors and insulators Connector-insulator integration for smart grids
Dalian Insulator Group ~3–5% UHV porcelain and composite disc/post insulators Cost-competitive; dominant China UHV supplier [3]
Zhejiang TCI ~2–4% Composite polymer suspension and post insulators Export-focused; aggressive capacity expansion
Aditya Birla Insulators ~2–3% Porcelain disc and pin insulators for domestic Indian market Captive alumina supply; Indian procurement advantage
MacLean Power Systems ~1–3% Distribution-class polymer insulators and hardware Niche North American distribution specialist


Recent News & Developments


  • IEC (November 2024): Published the third revision of IEC 62217, introducing mandatory 10,000-hour accelerated-aging tests for composite insulators above 245 kV, tightening market-entry barriers for uncertified manufacturers [10].


  • Hubbell Incorporated (2026 ): Acquired a U.S.-based polymer insulator startup specializing in sensor-embedded designs for wildfire-zone applications, expanding its smart-grid product portfolio [Ref: Hubbell 10-K Filing, 2024].


Electric Insulator Market Report Scope

Parameter Detail
Market Scope Global Electric Insulator Market across all dielectric materials, voltage ratings, installation environments, applications, and end users
Study Period 2021–2035
CAGR (Forecast) 7.0% (2026–2035)
Base Year Market Size USD 23.28 Billion (2025)
Forecast Endpoint USD 45.88 Billion (2035)
Fastest Growing Segment Composite/Polymer (8.3% CAGR)
Fastest Growing Region Asia-Pacific (7.8% CAGR)
Companies Profiled 11 (ABB, Siemens Energy, GE Vernova, NGK Insulators, Hubbell, Seves Group, TE Connectivity, Dalian Insulator Group, Zhejiang TCI, Aditya Birla Insulators, MacLean Power Systems)
Valuation Currency USD Billion


FAQs

How do composite insulators perform versus porcelain in heavily polluted coastal environments?

Composite silicone housings maintain hydrophobicity under salt-fog contamination, reducing flashover risk by up to 60% compared to glazed porcelain in CIGRE pollution-class IV zones [2]. Porcelain requires periodic washing schedules that composites largely eliminate.

What pre-qualification testing should utilities require when evaluating new insulator suppliers?

Demand IEC 62217-compliant 5,000-hour accelerated-aging results, mechanical-load verification per IEC 61109, and at least three verifiable field references on lines operating above 220 kV [10]. Third-party lab certification reduces procurement risk significantly.

How are HVDC insulator specifications different from standard AC designs?

DC voltage generates space-charge accumulation on insulator surfaces, requiring 20–30% greater creepage distance and specialized end-fitting corona shielding compared to equivalent AC-rated units [11]. Pollution performance under DC bias also differs materially from AC behavior.

What is the typical replacement cycle for transmission-grade insulators?

Porcelain units on standard AC lines carry design lives of 30–40 years, while first-generation composite insulators installed in the early 2000s are entering replacement windows now [2]. Harsh environments shorten cycles to 20–25 years.

How do tariff and trade policies affect insulator procurement costs?

U.S. Section 301 tariffs add 25% to Chinese-origin insulator imports, and EU anti-dumping investigations have targeted glass insulator shipments [10]. Utilities increasingly dual-source from domestic and allied-nation manufacturers to hedge trade-policy risk.

What role do insulators play in wildfire mitigation strategies?

Contaminated or damaged insulators cause arc-flash ignitions on overhead lines in high-fire-threat zones. Utilities like PG&E replace legacy porcelain with pollution-resistant composite designs rated for higher dry-arc distances to reduce ignition probability [6].

Can existing porcelain insulator strings be retrofitted with composite units without tower modifications?

Direct retrofit is feasible for most suspension and strain positions using matched coupling lengths, though dead-end assemblies may require hardware adapters [2]. Weight reduction from composites often increases tower structural margins.    
Author
Author
Author Profile
Priya Nagrale LinkedIn
Senior Research Analyst
With an experience of over five years in market research industry (Chemicals & Materials domain), I gather and analyze market data from diverse sources to produce results, which are then presented back to a client. Also, provide recommendations based on the findings. As a Senior Research Analyst, I perform quality checks (QC) for market estimations, QC for reports, and handle queries and work extensively on client customizations. Also, handle the responsibilities of client proposals, report planning, report finalization, and execution

Research Approach


Secondary Research

The secondary research process involved comprehensive analysis of regulatory databases, industry publications, technical standards, and authoritative energy organizations. Key sources included the International Electrotechnical Commission (IEC), Institute of Electrical and Electronics Engineers (IEEE), National Electrical Manufacturers Association (NEMA), American National Standards Institute (ANSI), US Department of Energy (DOE), Federal Energy Regulatory Commission (FERC), European Network of Transmission System Operators for Electricity (ENTSO-E), International Energy Agency (IEA), International Renewable Energy Agency (IRENA), US Energy Information Administration (EIA), EU Eurostat Energy Database, and national utility regulatory commission reports from key markets. These sources were used to collect transmission infrastructure statistics, material standards compliance data, grid modernization investment figures, renewable energy capacity trends, and market landscape analysis for ceramic insulators, composite insulators, glass insulators, and polymer insulator technologies.


Primary Research

To gather both qualitative and quantitative insights, supply-side and demand-side stakeholders were interviewed during the primary research phase. CEOs, VPs of manufacturing, heads of research and development, and commercial directors from OEMs, composite material suppliers, and producers of electric insulators were examples of supply-side sources. Chief engineers from transmission system operators, grid infrastructure planners, electric utility procurement chiefs, EPC contractors, and developers of renewable energy projects were examples of demand-side suppliers. Primary research validated market segmentation, confirmed product development timelines, and gathered insights on material substitution trends, pricing dynamics, and procurement frameworks.

Primary Respondent Breakdown:

By Designation: C-level Primaries (30%), Director Level (32%), Others (38%)

By Region: North America (32%), Europe (30%), Asia-Pacific (28%), Rest of World (10%)


Market Size Estimation

Global market valuation was derived through revenue mapping and installation volume analysis. The methodology included:

Identification of 55+ key manufacturers across North America, Europe, Asia-Pacific, Latin America, and Middle East & Africa

Product mapping across ceramic, composite, glass, and polymer insulator categories by voltage rating (low, medium, high)

Analysis of reported and modeled annual revenues specific to electric insulator portfolios

Coverage of manufacturers representing 72-78% of global market share in 2024

Extrapolation using bottom-up (installation volume × ASP by country/region) and top-down (manufacturer revenue validation) approaches to derive segment-specific valuations across transmission lines, distribution networks, substations, and renewable energy applications

Download Free Sample

Kindly complete the form below to receive a free sample of this Report

Download PDF ×

We do not share your information with anyone. However, we may send you emails based on your report interest from time to time. You may contact us at any time to opt-out.