Segmentation Quick Reference
| Dimension | Sub-Segments | Dominant Segment | Fastest Growing Segment |
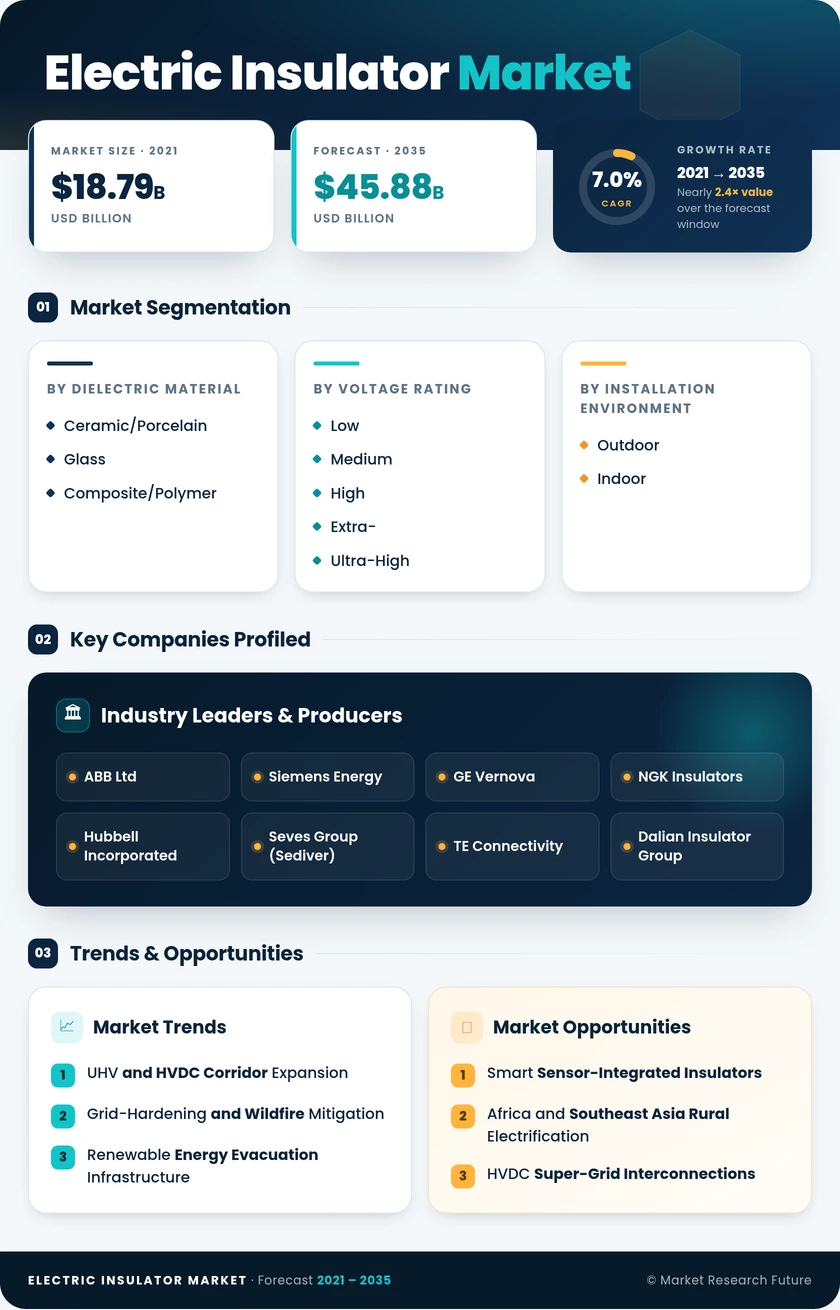
| Dielectric Material | Ceramic/Porcelain, Glass, Composite/Polymer | Ceramic/Porcelain (48.2% share, 2025) | Composite/Polymer (8.3% CAGR) |
| Voltage Rating | Low, Medium, High, Extra- and Ultra-High | Medium Voltage (42.8% share, 2025) | Extra- and Ultra-High (8.4% CAGR) |
| Installation Environment | Outdoor, Indoor | Outdoor (68.2% share, 2025) | Outdoor (7.5% CAGR) |
| Application | Transmission Lines, Substations and Switchgear, Other | Transmission Lines (44.5% share, 2025) | Substations and Switchgear (7.1% CAGR) |
| End User | Utilities, Industrial, Residential and Other | Utilities (66.5% share, 2025) | Industrial (7.5% CAGR) |
Market Segmentation Overview
By Dielectric Material
| Sub-Segment | Key Trend |
| Ceramic/Porcelain | Remains cost-effective for standard distribution; gradual share erosion in HV/EHV segments |
| Glass | Toughened-glass designs gain traction in self-cleaning and pollution-monitoring applications |
| Composite/Polymer | Fastest-growing material driven by HVDC, wildfire mitigation, and weight-reduction requirements |
Ceramic and porcelain continue to dominate procurement volumes in distribution and sub-transmission applications, where their proven track record and competitive unit pricing sustain utility preference. Composite and polymer insulators are capturing an accelerating share of new-build high-voltage and HVDC projects as utilities prioritize pollution performance, seismic resilience, and reduced tower loading.
By Voltage Rating
| Sub-Segment | Key Trend |
| Low Voltage | Stable demand tied to residential and commercial building electrification |
| Medium Voltage | Largest segment by volume, driven by urban distribution grid density and renewal programs |
| High Voltage | Growth aligned with renewable-energy evacuation at 220–400 kV transmission levels |
| Extra- and Ultra-High Voltage | Fastest growth from UHV AC/DC super-grid and cross-border HVDC corridor expansion |
Medium-voltage insulators represent the highest-volume category, reflecting the immense scale of global distribution infrastructure. Extra- and ultra-high-voltage units, though niche by volume, command the fastest growth and the highest per-unit values as utilities invest in long-distance bulk power transfer.
By Installation Environment
| Sub-Segment | Key Trend |
| Outdoor | Dominant share from overhead T&D lines; composite adoption rising in pollution-prone regions |
| Indoor | Steady growth from GIS substation installations in space-constrained urban environments |
Outdoor insulators reflect the global preference for overhead transmission and distribution circuits, particularly in developing economies with abundant right-of-way corridors. Indoor applications grow as gas-insulated switchgear penetration deepens in dense urban substations across Europe, Japan, and Southeast Asia.
By Application
| Sub-Segment | Key Trend |
| Transmission Lines | Largest application; HVDC sub-segment drives above-average growth |
| Substations and Switchgear | Expanding with GIS adoption and transformer bushing upgrade cycles |
| Other Applications | Electric Insulator Market catenary, industrial plant electrification, and telecom tower insulation |
Transmission line insulators constitute the core of the market, with procurement volumes directly tied to new corridor construction and aging-infrastructure replacement. Substation and switchgear insulation demand accelerates as utilities upgrade from air-insulated to gas-insulated configurations.
By End User
| Sub-Segment | Key Trend |
| Utilities | Overwhelmingly dominant via regulated CAPEX programs; framework contracts favor pre-qualified suppliers |
| Industrial | Growing from hyperscale data centers, mining, and heavy-manufacturing dedicated feeds |
| Residential and Other | Incremental growth from rural electrification and distributed-generation interconnection |
Utilities drive the majority of global insulator procurement through multi-year capital programs managed by transmission and distribution system operators. Industrial end users represent the fastest-expanding buyer segment, led by data center operators constructing dedicated medium- and high-voltage feeds to support AI and cloud-computing infrastructure loads.