EV Powertrain Market (2026 - 2035)

EV Powertrain Market Research Report By Component (Battery Packs, Electric Motors, Power Electronics, Transmission / Reducer, Thermal Management), By Propulsion Type (Battery Electric Vehicle (BEV), Plug-in Hybrid Electric Vehicle (PHEV), Fuel Cell Electric Vehicle (FCEV)), By Vehicle Class (Passenger Cars, Light Commercial Vehicles, Heavy Commercial Vehicles, Two/Three-Wheelers), By Voltage Architecture (≤400 V Systems, 800 V Systems), By Sales Channel (OEM-Fitted Powertrains, Aftermarket Retrofit) and By Regional (North America, Europe, South America, Asia Pacific, Middle East and Africa) - Forecast to 2035
ID: MRFR/AT/6804-HCR
185 Pages
Shubham Munde, Swapnil Palwe
Last Updated: August 24, 2026
EV Powertrain Market
Market Size
Forecast Period2026-2035
CAGR (2026-2035)19.3%
2025 Market SizeUSD 232.0 Billion
2035 Market SizeUSD 1,355.0 Billion
Key Players
BorgWarner
Continental AG
Nidec Corporation
ZF Friedrichshafen
Robert Bosch
Dana Incorporated
Opportunities
  • Solid-State Battery Commercialization
  • Commercial Fleet Electrification in Emerging Markets
  • Vehicle-to-Grid and Bidirectional Charging Services

EV Powertrain Market Summary

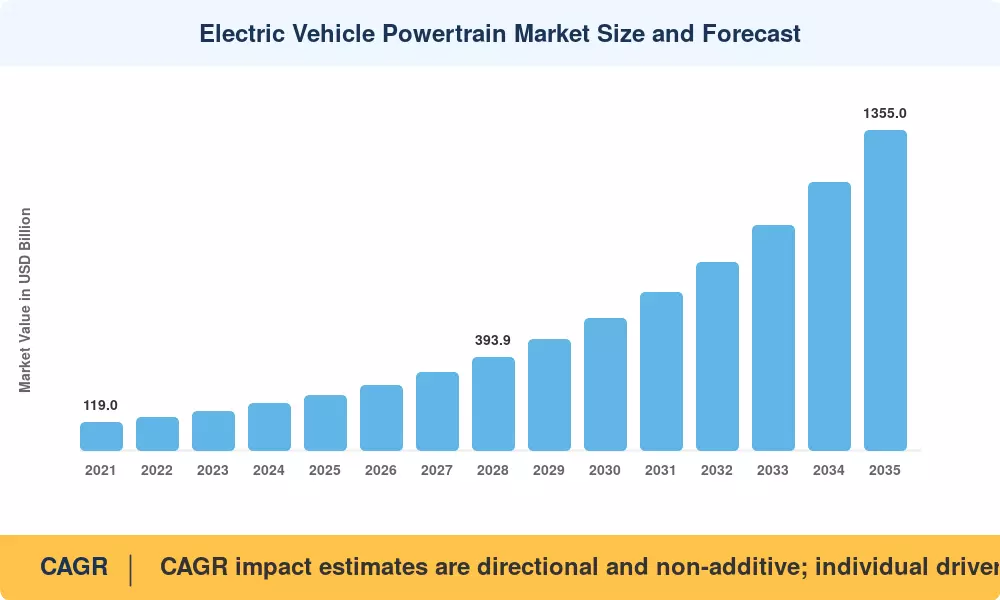
The Electric Vehicle Powertrain Market was valued at USD 232.0 billion in 2025 and is projected to grow from USD 276.8 billion in 2026 to USD 1,355.0 billion by 2035, registering a CAGR of 19.3% during the forecast period (2026–2035). This growth trajectory reflects aggressive zero-emission vehicle mandates — including the EU's 2035 ICE ban and the U.S. EPA's finalized multi-pollutant standards — combined with battery pack costs falling below USD 100/kWh at the cell level by late 2024 [1]. The convergence of policy pressure and cost competitiveness has shifted powertrain electrification from a niche ambition to an industrial imperative.

A fundamental technology transformation is reshaping the Electric Vehicle Powertrain Market. Legacy internal-combustion drivetrains — comprising engines, multi-speed transmissions, exhaust aftertreatment, and fuel delivery systems — are being replaced by integrated electric drive units that combine motors, inverters, and reduction gears into compact assemblies. Automakers committed over USD 615 billion in announced EV and battery investments through 2030, according to the International Energy Agency's Global EV Outlook 2024 [2]. Silicon-carbide power modules are displacing silicon IGBTs in inverter designs, cutting switching losses by up to 50% and enabling higher-voltage architectures.

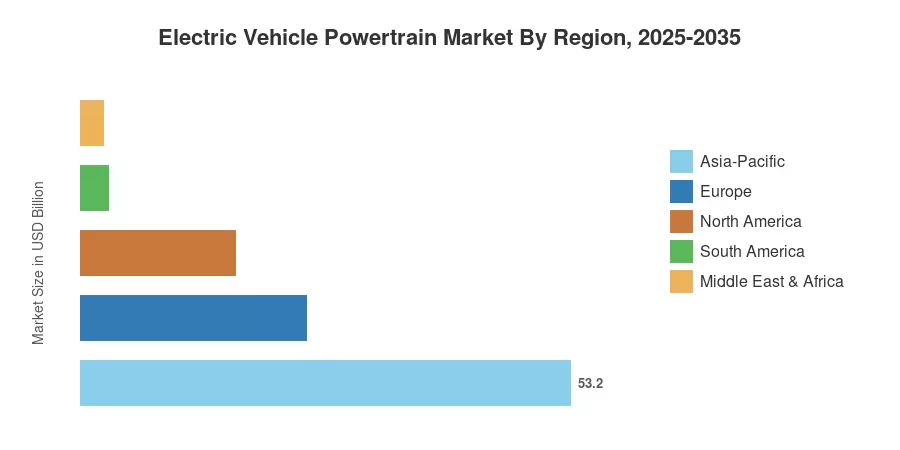
Asia-Pacific dominates the Electric Vehicle Powertrain Market with approximately 53.2% of global revenue in 2025, driven by China's vertically integrated supply chain from cathode materials to finished vehicles. The region is also the fastest-growing market, expanding at a 24.3% CAGR through 2035. Europe holds the second-largest share at roughly 24.5%, underpinned by stringent Euro 7 emission norms and generous purchase subsidies in Germany, France, and the Nordic countries. North America is accelerating rapidly, with the Inflation Reduction Act's domestic content requirements pulling powertrain manufacturing onshore. The decade ahead will be defined by localization battles, supply-chain resilience strategies, and the race to commercialize solid-state battery technology.

Key Report Takeaways

• By Component

  • Battery packs accounted for 35.5% of Electric Vehicle Powertrain Market revenue in 2025, remaining the single largest cost component across all vehicle classes.
  • Power electronics — including inverters, onboard chargers, and DC-DC converters — is the fastest-growing component segment, expanding at a 26.8% CAGR through 2035.

• By Propulsion Type & Vehicle Class

  • Battery electric vehicles (BEVs) commanded a 65.8% share of the Electric Vehicle Powertrain Market in 2025, outpacing plug-in hybrids by a widening margin.
  • Light commercial vehicles represent the fastest-growing vehicle class, posting a 24.0% CAGR as last-mile delivery fleets electrify at scale.

• By Geography

  • Asia-Pacific generated USD 123.4 billion in powertrain revenue in 2025, led by China, Japan, and South Korea.
  • North America is the third-largest regional market, benefiting from IRA-linked manufacturing credits and rising consumer EV adoption.

Market Size and Forecast (2021–2035)

Market sizing relies on a bottom-up methodology that aggregates OEM production volumes, average powertrain bill-of-materials values, and aftermarket retrofit activity across 28 countries. Historical data (2021–2024) draws on OEM financial disclosures and customs trade databases, while the forecast (2026–2035) applies regression-adjusted growth curves calibrated to announced capacity expansions and policy timelines.
Electric Vehicle Powertrain Market Size and Forecast
Our Impact
Enabled $4.3B Revenue Impact for Fortune 500 and Leading Multinationals
Partnering with 2000+ Global Organizations Each Year
30K+ Citations by Top-Tier Firms in the Industry

Driver Impact Analysis

Driver ~% Impact on CAGR Geographic Relevance Impact Timeline
Zero-emission vehicle mandates 25–30% Global Long-term (≥4 yr)
Battery cost compression 20–25% Global Medium-term (2–4 yr)
Charging infrastructure build-out 15–18% North America, Europe Medium-term (2–4 yr)
Fleet electrification economics 10–14% North America, Asia-Pacific Short-term (≤2 yr)
SiC and GaN power semiconductor adoption 8–10% Global Medium-term (2–4 yr)
Consumer incentive and subsidy programs 7–9% Europe, China, US Short-term (≤2 yr)
High-voltage platform migration 5–8% Global Long-term (≥4 yr)


Zero-Emission Vehicle Mandates

The EU's Fit for 55 package effectively bans new ICE passenger car sales from 2035, while California's Advanced Clean Cars II rule requires 100% zero-emission new-vehicle sales by the same year — a standard adopted by 12 additional U.S. states covering over 40% of the domestic car market [5]. These mandates create a regulatory floor beneath Electric Vehicle Powertrain Market demand that insulates growth from short-term consumer sentiment shifts.

Battery Cost Compression

BloombergNEF's 2024 Battery Price Survey reported volume-weighted average lithium-ion pack prices of USD 115/kWh, a 14% year-over-year decline driven by falling lithium carbonate prices and manufacturing scale in China [1]. This cost trajectory is compressing the total-cost-of-ownership gap between BEVs and ICE vehicles to under two years of payback for high-mileage fleets.

Charging Infrastructure Build-Out

The U.S. National Electric Vehicle Infrastructure (NEVI) program is deploying USD 7.5 billion to install 500,000 public chargers by 2030, while Europe's Alternative Fuels Infrastructure Regulation mandates fast-charging stations every 60 km along TEN-T corridors by 2025 [14]. Expanded charging access directly reduces range anxiety — the single most-cited barrier to EV purchase intent in consumer surveys.

SiC Power Semiconductor Adoption

Silicon-carbide MOSFETs deliver 5–8% improvement in powertrain efficiency compared with silicon IGBTs, translating into measurable range gains per kilowatt-hour of battery capacity [10]. Wolfspeed, STMicroelectronics, and Infineon have collectively announced over USD 14 billion in SiC fab expansions through 2028, signaling that supply is scaling to meet EV demand.

Restraints Impact Analysis

Restraint impact percentages represent estimated drag on the Electric Vehicle Powertrain Market growth trajectory. These figures are directional and non-additive.

Restraint ~% Impact on CAGR Geographic Relevance Impact Timeline
Critical mineral supply concentration –4 to –6% Global Long-term (≥4 yr)
Grid capacity and electricity pricing –3 to –5% Emerging markets Medium-term (2–4 yr)
Skilled workforce shortages –2 to –4% North America, Europe Short-term (≤2 yr)
Tariff and trade policy uncertainty –2 to –3% US, EU, China Short-term (≤2 yr)
Consumer range and resale anxiety –1 to –3% Global Medium-term (2–4 yr)


Critical Mineral Supply Concentration

Approximately 70% of global cobalt refining and 60% of lithium processing capacity is concentrated in China, creating a geopolitical chokepoint that can amplify raw-material price volatility [15]. The Democratic Republic of the Congo supplies over 70% of mined cobalt, and artisanal-mining governance risks have triggered due-diligence compliance costs that cascade through the Electric Vehicle Powertrain Market supply chain.

Grid Capacity Constraints

Mass EV adoption places incremental load on electrical grids that many emerging markets are ill-equipped to absorb. India's Central Electricity Authority estimates the country will need 80 GW of additional generation capacity by 2030 just to meet projected EV charging demand [16]. Without concurrent grid modernization investment, electricity price spikes could erode the operating-cost advantage that underpins EV fleet economics.

Tariff and Trade Policy Uncertainty

The EU's provisional anti-subsidy tariffs on Chinese-built EVs — ranging from 17% to 38% — and the U.S. Section 301 tariff increase on Chinese EV imports to 100% have introduced pricing uncertainty that complicates supply-chain planning [18]. These measures protect domestic industries but risk slowing global Electric Vehicle Powertrain Market adoption by raising vehicle prices in import-dependent segments.

EV Powertrain Market Opportunities

Solid-State Battery Commercialization

Toyota, Samsung SDI, and QuantumScape have each announced pilot-line timelines targeting 2027–2028 for solid-state cells offering energy densities above 400 Wh/kg — roughly double today's NMC pouch cells [8]. Successful commercialization would reshape the Electric Vehicle Powertrain Market by enabling lighter, smaller battery packs that free up packaging space for vehicle designers.

Commercial Fleet Electrification in Emerging Markets

India's FAME III scheme allocates INR 10,000 crore (approximately USD 1.2 billion) toward electric two-wheelers, three-wheelers, and light commercial vehicles, creating a high-volume entry point for powertrain suppliers in price-sensitive segments. Southeast Asian markets — particularly Indonesia and Thailand — are attracting Chinese and Japanese OEM investments in local EV assembly, opening new demand corridors.

Vehicle-to-Grid and Bidirectional Charging Services

Bidirectional powertrain architectures enable EVs to export stored energy back to the grid during peak demand periods, creating a recurring revenue stream valued at USD 200–400 per vehicle annually in pilot programs across California and the Netherlands [20]. This data-monetization opportunity transforms the powertrain from a depreciating asset into an active grid resource.

Integrated E-Axle Platforms

Consolidating motor, inverter, and reducer into a single integrated unit reduces component count by up to 30% and cuts powertrain weight by 15–20 kg compared with discrete architectures [10]. Tier-1 suppliers such as Nidec, BorgWarner, and ZF are investing heavily in modular platforms that serve multiple OEM customers from shared production lines.

Aftermarket Retrofit and Repowering

Legacy commercial fleets — particularly urban buses and medium-duty delivery trucks — face tightening urban-access emission zones in over 320 cities worldwide [21]. The aftermarket retrofit segment of the Electric Vehicle Powertrain Market is projected to grow at a 24.7% CAGR through 2035, driven by operators seeking to extend vehicle life while meeting regulatory deadlines without purchasing entirely new vehicles.

EV Powertrain Market Future Outlook

Software-Defined Powertrain and OTA Optimization

Over-the-air software updates are transforming the Electric Vehicle Powertrain Market from a hardware-centric industry into a software-defined platform. Tesla already pushes quarterly powertrain calibration updates that can improve efficiency by 2–3% without any physical modification, and legacy OEMs are building similar capabilities into next-generation architectures [13]. By 2030, the software layer of the powertrain could represent 15–20% of total system value.

Circular Economy and Battery Second Life

The IEA estimates that by 2030, over 1.5 million tonnes of lithium-ion batteries will reach end-of-first-life globally, creating both an environmental obligation and an economic opportunity [12]. Second-life applications in stationary energy storage can extract an additional 5–8 years of useful capacity from retired EV packs, while hydrometallurgical recycling recovers over 95% of nickel, cobalt, and lithium content.

Autonomous Fleet Powertrain Requirements

Autonomous ride-hail and goods-delivery fleets impose unique powertrain demands — continuous duty cycles, redundant drive systems, and thermal management optimized for 18-hour daily operation rather than consumer driving patterns [13]. The Electric Vehicle Powertrain Market will increasingly bifurcate between consumer-optimized platforms prioritizing range and cost, and fleet-optimized platforms prioritizing durability and uptime.

ESG Reporting and Supply-Chain Transparency

The EU Corporate Sustainability Reporting Directive (CSRD) and the proposed SEC climate-disclosure rule are compelling powertrain OEMs and Tier-1 suppliers to quantify Scope 3 emissions across their component supply chains [24]. Battery passport requirements taking effect in 2027 will mandate cradle-to-gate carbon-intensity disclosures for every cell entering the European Electric Vehicle Powertrain Market, favoring suppliers with verifiable low-carbon manufacturing footprints.

EV Powertrain Market Segmentation

By Component

Segment Key Metric Primary Demand Driver
Battery Packs 35.5% revenue share (2025) Cell cost reduction; energy density improvements
Electric Motors USD 48.6 billion (2025) Permanent magnet and induction motor demand
Power Electronics 26.8% CAGR (2026–2035) SiC inverter adoption; onboard charger integration
Transmission / Reducer USD 19.2 billion (2025) Single- and two-speed reducer designs for BEVs
Thermal Management 21.4% CAGR (2026–2035) Heat pump and liquid-cooling system proliferation


Battery packs remain the dominant cost element in the Electric Vehicle Powertrain Market, typically representing 35–40% of the total powertrain bill of materials. Lithium iron phosphate (LFP) chemistry has gained significant share in standard-range vehicles due to its lower cost and superior thermal stability, while nickel-manganese-cobalt (NMC) formulations continue to lead in premium, long-range applications.

Power electronics is the segment to watch. The migration from 400 V to higher-voltage platforms is driving demand for silicon-carbide inverters that can operate at switching frequencies above 20 kHz with minimal thermal derating. Integrated power modules that combine the traction inverter, onboard charger, and DC-DC converter into a single housing are reducing assembly complexity and cost for OEMs.

By Propulsion Type

Segment Key Metric Primary Demand Driver
Battery Electric Vehicle (BEV) 65.8% market share (2025) Regulatory mandates; TCO parity with ICE
Plug-in Hybrid Electric Vehicle (PHEV) USD 64.2 billion (2025) Bridge technology in markets with limited charging
Fuel Cell Electric Vehicle (FCEV) 32.5% CAGR (2026–2035) Heavy-duty trucking; hydrogen corridor programs


BEVs command the largest share of the Electric Vehicle Powertrain Market and are extending their lead as battery costs decline and charging networks expand. PHEVs serve as a transitional technology in regions where charging infrastructure lags, but their share is expected to contract as regulatory incentives increasingly favor fully electric architectures.

By Vehicle Class

Segment Key Metric Primary Demand Driver
Passenger Cars 58.6% market share (2025) Mass-market BEV launches; SUV electrification
Light Commercial Vehicles 24.0% CAGR (2026–2035) Last-mile delivery fleet mandates
Heavy Commercial Vehicles USD 22.4 billion (2025) Megawatt charging; depot-based operations
Two/Three-Wheelers 27.8% CAGR (2026–2035) Asia emerging-market volume


Passenger cars account for the majority of the Electric Vehicle Powertrain Market by value, but the fastest growth is occurring in commercial segments where intensive utilization patterns compress payback periods. Light commercial vehicles used for last-mile parcel delivery can achieve total-cost-of-ownership breakeven within 18–24 months in high-mileage urban routes.

By Voltage Architecture

Segment Key Metric Primary Demand Driver
≤400 V Systems 81.5% market share (2025) Incumbent architecture; broad OEM adoption
800 V Systems 35.4% CAGR (2026–2035) Ultra-fast charging; reduced cable weight


By Sales Channel

Segment Key Metric Primary Demand Driver
OEM-Fitted Powertrains 85.4% revenue share (2025) Factory-integrated systems; warranty coverage
Aftermarket Retrofit 24.7% CAGR (2026–2035) Urban emission zones; fleet repowering economics


Regional Market Share Analysis

Region Key Metric Primary Investment Themes
Asia-Pacific 53.2% revenue share (2025) Vertical integration; battery megafactories; export-led growth
Europe 24.5% revenue share (2025) Regulatory compliance; localization mandates; SiC supply chain
North America 16.8% revenue share (2025) IRA incentives; reshoring; pickup/SUV electrification
South America 3.0% revenue share (2025) Two/three-wheeler electrification; mining supply chain
Middle East & Africa 2.5% revenue share (2025) Pilot fleet programs; green hydrogen synergies
**Total** **100%**

The Electric Vehicle Powertrain Market exhibits pronounced regional concentration, with three regions — Asia-Pacific, Europe, and North America — collectively accounting for over 94% of global revenue in 2025.


North America

Country Key Metric Key Driver
US 78.4% of regional share IRA manufacturing credits; OEM plant announcements
Canada 12.6% of regional share Critical mineral processing; Ontario assembly corridor
Mexico 9.0% of regional share USMCA content rules; nearshoring from Asian suppliers


The U.S. dominates the North American Electric Vehicle Powertrain Market, anchored by the Inflation Reduction Act's USD 7,500 consumer tax credit and 45X advanced manufacturing production credits that incentivize domestic battery and powertrain component production [7]. Ford, GM, and Stellantis have collectively committed over USD 120 billion in EV-related capital expenditure through 2030, with gigafactory investments in Tennessee, Michigan, and Georgia reshaping the region's automotive manufacturing map.

Europe

Country Key Metric Key Driver
Germany 27.2% of regional share OEM R&D concentration; Tier-1 supplier density
UK 18.3% of regional share Zero-emission vehicle mandate 2035; Gigafactory Sunderland
France 15.8% of regional share Renault-Ampere spin-off; EV leasing subsidies
Italy 9.4% of regional share Stellantis Melfi platform; Enel X charging
Spain 8.1% of regional share PERTE VEC program; SEAT/CUPRA electrification
Nordic Countries 7.6% of regional share Highest per-capita BEV penetration globally
Russia 3.2% of regional share Import substitution from Chinese OEMs
Rest of Europe 10.4% of regional share Eastern European assembly expansion


Europe's Electric Vehicle Powertrain Market is shaped by the EU's binding 2035 ICE sales ban and the European Battery Regulation requiring carbon-footprint declarations and recycled-content minimums for all batteries placed on the market from 2027 [5]. Germany remains the regional powerhouse, hosting R&D centers for Bosch, Continental, ZF, and Vitesco that collectively employ over 45,000 engineers focused on electrified drivetrain development.

Asia-Pacific

Country Key Metric Key Driver
China 24.3% CAGR (2026–2035) World's largest BEV market; CATL, BYD vertical integration
India 28.1% CAGR (2026–2035) FAME III subsidies; two/three-wheeler electrification
Japan USD 18.9 billion (2025) Toyota solid-state push; keicar segment electrification
South Korea USD 14.2 billion (2025) Hyundai-Kia E-GMP platform; LG-Samsung cell supply
ASEAN 30.2% CAGR (2026–2035) Thai-Indonesia EV hub strategies; Chinese FDI
Rest of Asia-Pacific USD 4.8 billion (2025) Australia fleet programs; New Zealand feebate scheme


Asia-Pacific leads the Electric Vehicle Powertrain Market in both volume and growth velocity. China alone accounted for over 60% of global BEV sales in 2024, and its domestic supply chain — spanning cathode precursors, cell manufacturing, motor production, and vehicle assembly — gives Chinese OEMs a structural cost advantage of 25–30% over Western competitors [2].

South America

Country Key Metric Key Driver
Brazil 58.3% of regional share Rota 2030 program; flex-fuel hybrid bridge strategy
Argentina 22.7% of regional share Lithium triangle mining; nascent assembly plans
Rest of South America 19.0% of regional share Chile copper/lithium exports; Colombia pilot fleets


Brazil anchors the South American Electric Vehicle Powertrain Market, though the country's unique flex-fuel culture means plug-in hybrids currently outpace pure BEVs. The Rota 2030 industrial policy provides tax incentives for vehicles meeting energy-efficiency benchmarks, gradually steering automakers toward electrified powertrains [22].

Middle East & Africa

Country Key Metric Key Driver
Saudi Arabia 31.5% of regional share Vision 2030; Lucid Motors AMP-2 plant in Jeddah
UAE 28.4% of regional share Green mobility strategy; Tesla and BYD imports
South Africa 18.7% of regional share APDP incentives; mining value-chain integration
Egypt 11.2% of regional share El-Nasr Automotive revival; CKD assembly
Rest of MEA 10.2% of regional share Kenya, Morocco pilot electrification programs


The Middle East & Africa Electric Vehicle Powertrain Market remains nascent but is growing from a low base as Gulf states diversify away from hydrocarbon dependence. Saudi Arabia's announcement of Lucid Motors' AMP-2 manufacturing facility in King Abdullah Economic City signals intent to build a domestic EV industrial ecosystem [23].

Electric Vehicle Powertrain Market By Region, 2025-2035

Competitive Benchmarking

The Electric Vehicle Powertrain Market exhibits medium concentration, with the top five players collectively holding an estimated 32–38% of global revenue. The competitive field spans vertically integrated OEMs, specialized Tier-1 powertrain suppliers, and pure-play motor and inverter manufacturers. A Herfindahl-Hirschman Index estimate in the range of 600–800 reflects a moderately fragmented structure with no single player exceeding a 10% share.

Company Est. Revenue Share Range Key Offerings Strategic Positioning
BorgWarner 7–9% Integrated drive modules; eMotors; power electronics Full-system integrator transitioning from ICE drivetrain legacy
Continental AG 5–7% High-voltage power electronics; electric axle drives European Tier-1 with strong OEM relationships
Nidec Corporation 6–8% Traction motors; E-Axle systems Japanese motor specialist scaling global capacity
ZF Friedrichshafen 5–7% Electric drive units; 2-speed transmissions Diversified mobility supplier with autonomous-driving synergies
Robert Bosch 5–7% eAxle; SiC inverters; thermal management Broadest automotive technology portfolio globally
Dana Incorporated 3–5% Spicer Electrified e-Propulsion; thermal systems Strong in commercial vehicle electrification
Magna International 4–6% eBeam axle; eDrive systems; complete vehicle assembly Contract manufacturing flexibility for multiple OEMs
Vitesco Technologies 3–5% Axle drives; inverters; onboard chargers Spun off from Continental; pure-play electrification focus
Aisin Corporation 3–5% eAxle units; one-motor hybrid transmissions Toyota-aligned supplier expanding third-party sales
Schaeffler Group 2–4% Electric motors; thermal management modules Precision engineering heritage applied to EV components


Recent News & Developments

  • BorgWarner (March 2025): Opened a dedicated high-voltage inverter production facility in Seneca, South Carolina, investing USD 80 million to serve North American OEM customers under IRA-eligible supply chains [7].
  • Nidec Corporation (January 2025): Announced a strategic partnership with Stellantis to supply 800 V traction motor systems for the automaker's STLA Large and STLA Frame platforms beginning in 2027 [9].
  • ZF Friedrichshafen (October 2024): Unveiled a modular 2-speed electric drive unit at the Paris Motor Show, targeting premium European BEV sedans requiring top speeds above 250 km/h [10].
  • European Commission (July 2024): Imposed provisional anti-subsidy tariffs of 17.4–38.1% on Chinese-built battery electric vehicles imported into the EU, reshaping Electric Vehicle Powertrain Market supply-chain decisions [18].
  • Robert Bosch (April 2024): Acquired full ownership of its SiC wafer joint venture with SiCrystal, investing EUR 1.5 billion to secure captive supply of silicon-carbide substrates through 2030 [10].
  • Vitesco Technologies (November 2023): Completed its merger with Schaeffler Group, creating a combined entity with USD 22 billion in automotive revenue and a dedicated electrification division [25].
  • U.S. Department of Energy (September 2023): Awarded USD 3.5 billion through the Domestic Manufacturing Conversion Grants program to retool 20 ICE powertrain plants for EV component production across eight states [7].


EV Powertrain Market Report Scope

Parameter Details
Market Scope Electric Vehicle Powertrain Market — components, systems, and services for electrified vehicle drivetrains
Study Period 2021–2035
CAGR (Forecast) 19.3% (2026–2035)
Market Size (2025) USD 232.0 Billion
Market Size (2035) USD 1,355.0 Billion
Fastest Growing Segments Power Electronics (by component); Light Commercial Vehicles (by vehicle class); 800 V Systems (by voltage)
Companies Profiled BorgWarner, Continental, Nidec, ZF, Bosch, Dana, Magna, Vitesco, Aisin, Schaeffler
Valuation Currency USD Billion
CAGR Driver Disclaimer CAGR impact estimates are directional and non-additive; individual driver contributions overlap and interact across segments and geographies

FAQs

How does silicon-carbide inverter pricing affect powertrain cost parity timelines?
SiC devices currently carry a 2–3× cost premium over silicon IGBTs but deliver system-level savings through smaller cooling hardware and improved range. Cost parity at the device level is expected by 2029 as 200 mm wafer production scales [10].
What warranty structures do OEMs apply to electric powertrain components?
Most OEMs offer 8-year or 160,000 km warranties on battery packs and electric drive units, exceeding typical ICE powertrain coverage. Extended warranty packages for commercial fleets often cover up to 10 years [6].
How do rare-earth-free motor designs influence supplier diversification?
Switched reluctance and externally excited synchronous motors eliminate permanent-magnet dependency on Chinese rare-earth supply. BMW, Renault, and several Chinese OEMs have adopted such designs in production vehicles [15].
What role does thermal interface material innovation play in powertrain reliability?
Advanced thermal interface materials with conductivity above 5 W/mK reduce power-module junction temperatures by 10–15°C, directly extending inverter lifespan and enabling sustained peak-power output during fast charging [10].
How are insurance companies pricing electric powertrain repair risk?
Insurers report 20–30% higher claim costs for BEVs due to expensive battery and integrated-drive-unit repairs. Several insurers now use telematics-based underwriting to differentiate careful EV drivers [19].
What testing and validation protocols apply to high-voltage powertrain components?
Components must satisfy ISO 6469 electrical safety, IEC 61851 charging interface, and UN R100 battery safety standards. OEMs additionally impose proprietary abuse-test protocols covering thermal runaway propagation and crash-induced short circuits [6].
How do modular powertrain platforms reduce OEM development costs?
Shared electric platforms like Hyundai's E-GMP and Volkswagen's MEB amortize engineering costs across 5–8 vehicle models, cutting per-model development spend by an estimated 30–40% compared with bespoke architectures [9].
Author
Author
Author Profile
Shubham Munde LinkedIn
Team Lead - Research
Shubham brings over 7 years of expertise in Market Intelligence and Strategic Consulting, with a strong focus on the Automotive, Aerospace, and Defense sectors. Backed by a solid foundation in semiconductors, electronics, and software, he has successfully delivered high-impact syndicated and custom research on a global scale. His core strengths include market sizing, forecasting, competitive intelligence, consumer insights, and supply chain mapping. Widely recognized for developing scalable growth strategies, Shubham empowers clients to navigate complex markets and achieve a lasting competitive edge. Trusted by start-ups and Fortune 500 companies alike, he consistently converts challenges into strategic opportunities that drive sustainable growth.
Co-Author
Co-Author Profile
Swapnil Palwe LinkedIn
Team Lead - Research
With a technical background as Bachelor's in Mechanical Engineering, with MBA in Operations Management , Swapnil has 6+ years of experience in market research, consulting and analytics with the tasks of data mining, analysis, and project execution. He is the POC for our clients, for their consulting projects running under the Automotive/A&D domain. Swapnil has worked on major projects in verticals such as Aerospace & Defense, Automotive and many other domain projects. He has worked on projects for fortune 500 companies' syndicate and consulting projects along with several government projects.

Research Approach


Secondary Research

The secondary research process involved comprehensive analysis of regulatory databases, industry publications, government transportation statistics, and authoritative energy & mobility organizations. Key sources included the US Environmental Protection Agency (EPA), National Highway Traffic Safety Administration (NHTSA), California Air Resources Board (CARB), European Commission Directorate-General for Mobility and Transport (DG MOVE), International Energy Agency (IEA), SAE International, International Council on Clean Transportation (ICCT), Alliance for Automotive Innovation, European Automobile Manufacturers' Association (ACEA), China Association of Automobile Manufacturers (CAAM), Japan Automobile Manufacturers Association (JAMA), Korea Automobile Manufacturers Association (KAMA), International Renewable Energy Agency (IRENA), BloombergNEF Electric Vehicle Market Outlook, IEA Global EV Data Explorer, MarkLines Automotive Industry Portal, EV-Volumes Database, European Environment Agency (EEA) Transport Sector Data, International Transport Forum (ITF), and national ministry databases from China's Ministry of Industry and Information Technology (MIIT), Germany's Federal Motor Transport Authority (KBA), and India's Ministry of Heavy Industries. These sources were utilized to collect EV registration statistics, powertrain production capacities, battery supply chain data, carbon emission regulations, incentive scheme frameworks, and technology deployment trends across battery chemistry types, electric motor architectures, silicon carbide inverter adoption rates, and thermal management system configurations.


Primary Research

Interviews with supply-side and demand-side stakeholders were conducted as part of the primary research process in order to gather qualitative and quantitative information that would validate procurement strategies and technological roadmaps. Chief technology officers, vice presidents of electrification strategy, and heads of e-Drive business divisions from battery cell producers, electric motor suppliers, power semiconductor firms, and thermal management system integrators were examples of supply-side sources. Chief engineers of EV programs, directors of powertrain procurement, fleet electrification managers from commercial and passenger car manufacturers, ride-hailing fleet operators, and logistics firms that use heavy-duty electric trucks were examples of demand-side sources. Primary research established solid-state battery and 800V platform commercialization timescales, validated market segmentation across BEV/HEV/PHEV designs, and collected data on the growth of motor power density, inverter efficiency benchmarks, and adoption rates of cell-to-pack technology.

Primary Respondent Breakdown:

By Designation: C-level Executives (40%), Director Level (25%), Others (35%)

[Others include Senior Managers, Principal Engineers, and Fleet Operations Leads]

By Region: North America (30%), Europe (25%), Asia-Pacific (35%), Rest of World (10%)


Market Size Estimation

Global market valuation was derived through production volume mapping and bill-of-materials analysis. The methodology included:

Identification of 60+ key manufacturers across battery cells, e-motors, inverters/converters, and thermal management modules spanning North America, Europe, Asia-Pacific, and Latin America

Product mapping across lithium-ion (NCM, LFP, solid-state), permanent magnet synchronous motors, induction motors, SiC/GaN power electronics, and active thermal management systems

Analysis of reported and modeled revenues specific to EV powertrain portfolios, including OE supply contracts and aftermarket thermal management retrofits

Coverage of manufacturers representing 75-80% of global EV powertrain market share in 2024, including CATL, BYD, LG Energy Solution, Panasonic, Samsung SDI, Tesla, Nidec, Bosch, Valeo, and Denso

Extrapolation using bottom-up (EV sales volume × powertrain content value by vehicle class) and top-down (tier-1 supplier revenue cross-validation) approaches to derive segment-specific valuations across battery pack assembly costs, motor coppercontent pricing, and semiconductor value per vehicle

Download Free Sample

Kindly complete the form below to receive a free sample of this Report

* Please use a valid business email

Download PDF ×

We do not share your information with anyone. However, we may send you emails based on your report interest from time to time. You may contact us at any time to opt-out.
















