Electric Vehicle Test Equipment Market

Key Players: AVL List GmbH, Horiba Ltd., Keysight Technologies, Chroma ATE Inc., National Instruments (Emerson), dSPACE GmbH, NH Research (NHR), Arbin Instruments

Electric Vehicle Test Equipment Market

Electric Vehicle Test Equipment Market Size, Share & Growth Analysis Report By Vehicle Type (Passenger Cars, Commercial Vehicles), By Propulsion Type (Battery Electric Vehicles (BEVs), Plug-In Hybrid Electric Vehicles (PHEVs), Fuel-Cell Electric Vehicles (FCEVs)), By Equipment Type (EV Battery Test Systems, Powertrain Test Benches, EVSE / Charging Test Systems, HIL & Software Validation), By Application (OEM End-of-Line Testing, R&D and Prototype Validation, Independent & Certification Laboratories) and By Regional (North America, Europe, South America, Asia Pacific, Middle East and Africa) - Trends & Industry Forecast to 2035
ID: MRFR/EnP/23763-HCR
128 Pages
Priya Nagrale
Last Updated: June 19, 2026

Electric Vehicle Test Equipment Market Summary

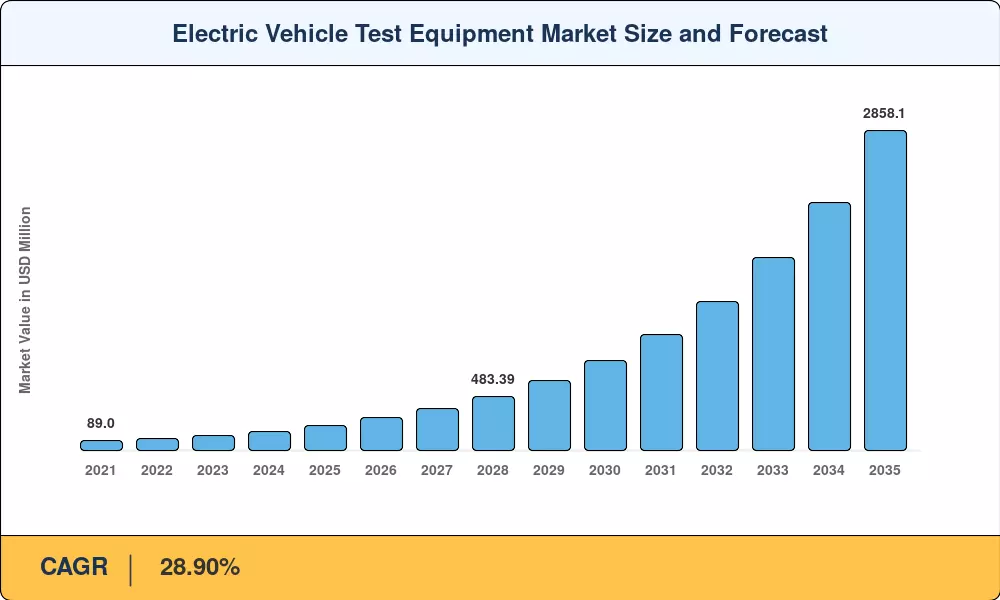
The electric vehicle test equipment market reached an estimated USD 225.80 Million in 2025 and is projected to surge to USD 2,858.10 Million by 2035, registering a 28.90% CAGR across the 2026–2035 forecast window. Two forces are converging to accelerate spending: first, automakers worldwide are scaling production toward an expected 40 million battery-electric units per year by 2030, and each assembly line requires dedicated validation hardware before vehicles reach consumers [1]. Second, tightening regulatory frameworks—particularly the EU Battery Regulation mandating digital battery passports by 2027 and UNECE R155/R156 cybersecurity type-approval deadlines—have compressed validation timetables and pushed OEMs to invest earlier in test infrastructure [2].

Technology transformation in the electric vehicle test equipment market is most visible in the migration from 400 V to 800 V drivetrain architectures. Legacy dynamometer and battery-cycling platforms designed for lower-voltage packs cannot safely handle the thermal management, insulation-resistance, and high-frequency switching demands of 800 V systems [3]. Retooling these stations has become a multi-billion-dollar upgrade cycle; BloombergNEF estimates that global spending on EV production-line capital equipment surpassed USD 16 billion in 2024 alone, with test and validation benches representing a growing share of that outlay [4].

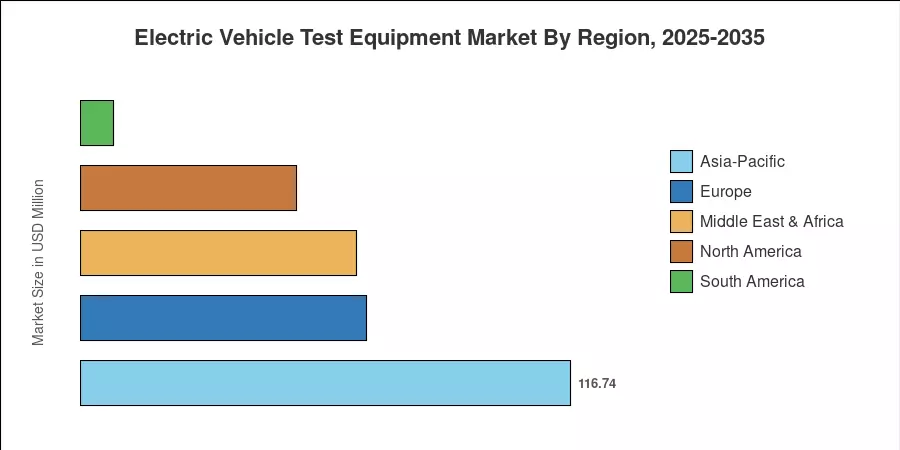
From a regional standpoint, Asia-Pacific dominated the electric vehicle test equipment market with roughly 51.7% of 2024 revenue, driven by China's battery mega-factory expansion and South Korea's cathode-material R&D push. Asia-Pacific is also the fastest-growing region at a projected 35.5% CAGR through 2035. North America held the second-largest share at approximately 22.8%, buoyed by Inflation Reduction Act incentives that tie tax credits to domestic content requirements for battery cells and packs [5]. Europe accounted for about 18.6% of the global electric vehicle test equipment market, with Germany's Fraunhofer institutes and France's investment in gigafactory corridors anchoring demand. As solid-state batteries and silicon-anode chemistries move from pilot lines to volume production, the need for next-generation test platforms will only intensify.


Key Report Takeaways

• By Vehicle Type & Propulsion

  • Passenger cars generated approximately 64.1% of the 2024 electric vehicle test equipment market revenue, reflecting the sheer volume of BEV sedan and SUV launches across global platforms.
  • Commercial-vehicle test demand is the fastest-growing vehicle-type segment, projected to expand at a 36.9% CAGR through 2035 as electric bus and truck programs ramp up in China, Europe, and North America.
  • Battery electric vehicles accounted for roughly 69.4% of propulsion-type demand in 2024, while fuel-cell electric vehicles are forecast to register a 33.3% CAGR as hydrogen-truck pilots scale.

• By Equipment Type & Application

  • EV Battery Test Systems commanded approximately 44.6% of the 2024 electric vehicle test equipment market revenue, covering cell-level cycling, module abuse testing, and pack-level thermal validation.
  • EVSE and Charging Test Systems represent the fastest-growing equipment category at an estimated 33.0% CAGR, driven by megawatt charging standards for commercial fleets.
  • OEM end-of-line testing held roughly 48.7% of application revenue in 2024, while independent and certification laboratories are forecast to grow at 35.8% CAGR through 2035.

• By Region

  • Asia-Pacific led the electric vehicle test equipment market with a 51.7% revenue share in 2024 and is the fastest-growing region at a 35.5% CAGR.
  • North America contributed approximately USD 51.48 Million in 2024 revenue, supported by DOE loan-program disbursements for battery plant buildouts.
  • Europe is projected to grow at a 30.2% CAGR, with Germany, France, and the Nordic countries anchoring investment.


Market Size and Forecast (2021–2035)

Market Research Future's sizing methodology triangulates top-down revenue estimates from OEM capital-expenditure disclosures, tier-one supplier order-book data, and bottom-up unit-shipment tracking across battery cyclers, powertrain dynamometers, charging-interface testers, and HIL simulation platforms. Historical figures (2021–2024) rely on audited company filings and verified trade data; forecast values (2026–2035) apply an econometric demand model calibrated against EV production forecasts published by the IEA and BloombergNEF [1][4].

Electric Vehicle Test Equipment Market Size and Forecast
Our Impact
Enabled $4.3B Revenue Impact for Fortune 500 and Leading Multinationals
Partnering with 2000+ Global Organizations Each Year
30K+ Citations by Top-Tier Firms in the Industry

Driver Impact Analysis

Driver ~% Impact on CAGR Geographic Relevance Impact Timeline
Gigafactory capacity expansion ~22% Global Short-term (≤2 yr)
800 V / high-voltage architecture migration ~18% Europe, Asia-Pacific Medium-term (2–4 yr)
Regulatory compliance deadlines (UNECE, EU Battery Reg.) ~16% Europe, Global Short-term (≤2 yr)
Solid-state & advanced cell-chemistry validation ~14% Asia-Pacific, North America Long-term (≥4 yr)
Megawatt-class commercial-vehicle charging ~12% North America, Europe Medium-term (2–4 yr)
Fuel-cell stack and balance-of-plant testing ~10% Asia-Pacific, Europe Long-term (≥4 yr)
Digital-twin and AI-accelerated test cycles ~8% Global Long-term (≥4 yr)


Gigafactory Capacity Expansion

Between 2024 and 2028, announced battery-cell mega-factory projects total over 6,500 GWh of planned capacity worldwide, according to Benchmark Minerals Intelligence [5]. Each gigawatt-hour of cell production capacity requires an estimated USD 1.5–2.5 million in dedicated test-bench infrastructure for incoming electrode inspection, formation cycling, and end-of-line pack validation. The U.S. Department of Energy has disbursed more than USD 12 billion in loan commitments for domestic battery plants since 2022, and at least 15% of project budgets are allocated to quality-assurance and test equipment lines [6]. This capital wave is the single largest near-term demand driver for the electric vehicle test equipment market.

High-Voltage Architecture Migration

The shift from 400 V to 800 V—and emerging 900 V—platforms fundamentally changes test requirements. Insulation-resistance testers, high-voltage interlock loop verification stations, and inverter-characterization benches must all be upgraded to handle higher voltages and faster switching frequencies [3]. Hyundai, Kia, Porsche, and several Chinese OEMs have already committed to 800 V across most new nameplates from 2026 onward. Industry estimates suggest that retooling a single end-of-line test station for 800 V adds USD 300,000–500,000 in incremental hardware cost, multiplied across dozens of stations per plant [4].

Regulatory Compliance Deadlines

The European Union's Battery Regulation requires a digital battery passport for every EV battery placed on the EU market starting in 2027, covering cell chemistry, recycled content, carbon footprint, and state-of-health data [2]. Meeting these requirements demands additional electrochemical impedance spectroscopy, capacity-fade profiling, and data-logging hardware at both cell and pack levels. Separately, UNECE R155 and R156 cybersecurity and software-update type-approval requirements force OEMs to validate over-the-air update pathways through hardware-in-the-loop test rigs before any vehicle receives whole-vehicle type approval [13]. These deadlines leave manufacturers little choice but to invest in the electric vehicle test equipment market ahead of enforcement dates.

Solid-State and Advanced Cell Chemistry Validation

Toyota, Samsung SDI, and QuantumScape have announced pilot-line targets for solid-state cells between 2027 and 2029 [7]. Solid-state chemistries introduce new abuse-test profiles—dendrite-penetration resistance, stack-pressure cycling, and interfacial impedance drift—that conventional lithium-ion cyclers cannot adequately characterize. The U.S. Advanced Battery Consortium has earmarked USD 200 million for next-generation cell-testing protocols, and national labs such as Argonne and NREL are co-developing standardized test procedures that will shape procurement specifications across the electric vehicle test equipment market [14].


Restraints Impact Analysis

Restraint ~% Negative Impact on CAGR Geographic Relevance Impact Timeline
High capital cost of advanced test benches ~–6% Global Short-term
Shortage of calibration and test engineers ~–5% North America, Europe Medium-term
Fragmented international test standards ~–4% Global Long-term
Supply-chain bottlenecks for precision sensors ~–3% Global Short-term
Cybersecurity risks in connected test platforms ~–2% Global Medium-term


High Capital Cost of Test Infrastructure

A fully equipped end-of-line battery-pack validation station can cost USD 2–4 million, and an OEM building a new plant may need 20–40 such stations [4]. For smaller EV startups and tier-two suppliers, the upfront investment creates a meaningful barrier to entry. Leasing and test-as-a-service models are emerging to address this, but adoption remains limited outside North America and Western Europe, dampening the addressable portion of the electric vehicle test equipment market in price-sensitive regions.

Skilled-Workforce Shortages

The intersection of power electronics, electrochemistry, and embedded-software expertise required to operate modern EV test systems is narrow. A 2024 survey by the Society of Automotive Engineers found that 62% of OEM test-lab managers reported unfilled positions for more than six months [15]. This talent gap slows commissioning timelines and reduces throughput on installed equipment, indirectly constraining market revenue growth in the electric vehicle test equipment market.

Fragmented Test Standards

IEC, ISO, SAE, and GB/T standards for EV battery and drivetrain testing overlap in some areas and conflict in others. An OEM selling into China, Europe, and North America may need three distinct test sequences for the same battery pack, tripling validation costs but also creating redundancy that discourages investment in unified platforms [13]. Harmonization efforts led by the World Forum for Harmonization of Vehicle Regulations (WP.29) are underway but unlikely to yield consolidated standards before 2030.


Electric Vehicle Test Equipment Market Opportunities

Test-as-a-Service and Shared-Lab Models

Independent testing labs are building multi-tenant facilities where several OEMs and tier-one suppliers share battery-cycling capacity on a pay-per-test basis. It reduces barriers to entry for smaller EV manufacturers and offers ongoing revenue to test equipment providers who supply and maintain the shared infrastructure. projects sharing testing revenue might reach USD 500 Million worldwide by 2032 [17].


Emerging-Market Gigafactory Buildouts

India’s production-linked incentive program for advanced-chemistry cells aims to achieve 50 GWh domestic capacity by 2030, while Indonesia and Thailand are drawing Chinese and Korean battery investments linked to nickel and cobalt refining [10]. These greenfield facilities will require imported test equipment, establishing a new geographic corridor for vendors who now focus on China, Europe and the U.S. in the electric car test equipment market.


AI-Accelerated Test Optimization

Machine-learning systems can examine cycling data in real time to identify cell-failure scenarios, decreasing physical test cycles by 30–40% [11]. Vendors who bake predictive analytics software into their hardware platforms can command premium subscription fees, building a data-monetization layer on top of normal capital-equipment sales. This move is consistent with wider Industry 4.0 digital-thread ambitions across the electric car test equipment sector.


Megawatt Charging System (MCS) Validation

The CharIN’s Megawatt Charging System standard targets up to 3.75 MW for heavy-duty trucks and is projected to be commercially deployed by 2027 [8]. Testing connectors, cables and vehicle inlets at these power levels needs all new test rigs — high-current sources, thermal-imaging arrays and communication-protocol analyzers — that few labs yet have. Early MCS test infrastructure players are in a position to take an outsized piece of the commercial-vehicle space.


Second-Life Battery Grading and Recertification

The EU's battery-passport mandate will require a state-of-health assessment before any EV battery enters a second-life energy-storage application [2]. Grading stations capable of rapid impedance spectroscopy and capacity verification represent a new equipment category within the electric vehicle test equipment market, with demand expected to scale alongside retirement volumes of first-generation EV packs after 2028.


Electric Vehicle Test Equipment Market Future Outlook

AI-Driven Test Automation and Digital Twins

By 2030, an estimated 45% of new EV test benches will ship with embedded machine-learning modules capable of adaptive test-sequence optimization [11]. Digital-twin simulations that mirror physical battery packs in real time can reduce physical cycling requirements by a third, compressing development timelines and lowering per-unit validation cost across the electric vehicle test equipment market. Vendors that integrate software analytics into hardware platforms will command premium margins.

Electrification Supercycle and Platform Economics

The IEA's Global EV Outlook 2025 projects 70 million annual EV sales by 2035 under stated policies [1]. This production supercycle is driving test-equipment vendors toward modular platform architectures that can be reconfigured for different cell formats, voltage classes, and drivetrain topologies without full hardware replacement. Platform economics lower total cost of ownership and create installed-base lock-in, shaping competitive dynamics within the electric vehicle test equipment market.

Hydrogen Fuel-Cell Validation Scale-Up

Fuel-cell stack testing—encompassing membrane-electrode-assembly conditioning, cold-start endurance, and vibration qualification—remains a niche but fast-growing segment [12]. The European Clean Hydrogen Alliance's deployment roadmap targets 100,000 fuel-cell trucks by 2035, which will require dedicated test infrastructure for stack-level and vehicle-level validation. This sub-segment is expected to grow at roughly 33.3% CAGR, outpacing the overall electric vehicle test equipment market.

ESG Reporting and Circular-Economy Compliance

Sustainability disclosure requirements under the EU Corporate Sustainability Reporting Directive and the SEC's climate-risk rules are pushing OEMs to quantify the environmental footprint of their testing operations [19]. Test-equipment vendors are responding with energy-regenerative battery cyclers that return discharge energy to the grid, cutting laboratory electricity consumption by up to 60%. This ESG alignment will become a procurement criterion, influencing purchasing decisions in the electric vehicle test equipment market through 2035.


Electric Vehicle Test Equipment Market Segmentation

By Vehicle Type

Segment Metric Primary Demand Driver
Passenger Cars 64.1% share (2024) Mass-market BEV launches
Commercial Vehicles 36.9% CAGR (2026–2035) Electric bus and truck programs


Passenger cars dominate the electric vehicle test equipment market because sedan and SUV platforms represent the bulk of global EV production volume. Every new nameplate requires cell-incoming, module-assembly, and pack end-of-line test stations, and the accelerating cadence of model refreshes keeps equipment demand elevated. Commercial vehicles, while smaller in absolute terms, are growing faster as electric bus mandates in China and the EU push fleet operators to adopt zero-emission platforms that demand heavier-duty validation rigs.

By Propulsion Type

Segment Metric Primary Demand Driver
Battery Electric Vehicles (BEVs) 69.4% share (2024) Global policy push for zero-emission drivetrains
Plug-In Hybrid Electric Vehicles (PHEVs) USD 42.30 Million (2024) Transitional powertrain demand
Fuel-Cell Electric Vehicles (FCEVs) 33.3% CAGR (2026–2035) Hydrogen-truck pilot programs


BEVs command the largest share of the electric vehicle test equipment market because battery-pack validation is the most equipment-intensive step in the production process. FCEVs are growing rapidly from a small base, as hydrogen-truck consortia in Europe and Korea scale from prototype to pre-series production, triggering demand for stack-conditioning and durability-test rigs [12].

By Equipment Type

Segment Metric Primary Demand Driver
EV Battery Test Systems 44.6% share (2024) Cell, module, and pack validation
Powertrain Test Benches USD 34.78 Million (2024) Motor, inverter, and gearbox characterization
EVSE / Charging Test Systems 33.0% CAGR (2026–2035) MCS and ultra-fast charging rollout
HIL & Software Validation 31.5% CAGR (2026–2035) ADAS and cybersecurity type-approval


EV Battery Test Systems lead the electric vehicle test equipment market because battery validation spans the widest range of test procedures—from cell-level formation and grading to pack-level thermal-runaway propagation and abuse testing. EVSE and Charging Test Systems are gaining share rapidly as interoperability certification for CCS2, NACS, and MCS connectors becomes mandatory across major markets [8].

By Application

Segment Metric Primary Demand Driver
OEM End-of-Line Testing 48.7% share (2024) Factory-floor production validation
R&D and Prototype Validation USD 38.95 Million (2024) New-chemistry development cycles
Independent & Certification Laboratories 35.8% CAGR (2026–2035) Third-party compliance testing


OEM end-of-line testing accounts for the largest application share within the electric vehicle test equipment market because every vehicle leaving the assembly line must pass electrical-safety, insulation-resistance, and functional checks. Independent and certification laboratories are the fastest-growing application as regulatory bodies increasingly require third-party verification of battery safety and electromagnetic compatibility [13].


Regional Market Share Analysis

Region Metric Primary Investment Themes
Asia-Pacific 51.7% share (2024) Gigafactory expansion, NEV credit mandates
North America USD 51.48 Million (2024) IRA incentives, domestic-content rules
Europe 30.2% CAGR (2026–2035) Battery passport, 800 V OEM adoption
South America 3.5% share (2024) Lithium refining, EV assembly pilots
Middle East & Africa 29.1% CAGR (2026–2035) Green hydrogen, EV import growth
Total USD 225.80 Million (2025)

The electric vehicle test equipment market's geographic profile mirrors global EV production and regulatory intensity. Asia-Pacific leads on both share and growth, followed by North America and Europe, while South America and the Middle East & Africa remain nascent but accelerating.


North America

Country Metric Key Driver
United States 78.3% of regional share DOE loan programs, IRA Section 45X
Canada 13.5% of regional share Ontario battery corridor
Mexico 8.2% of regional share Nearshoring EV assembly


North America's electric vehicle test equipment market is anchored by the United States, where the DOE Loan Programs Office has committed over USD 12 billion to domestic battery-cell and pack manufacturing since 2022 [6]. Canada's Ontario corridor—housing Stellantis-LG and Volkswagen's PowerCo projects—drives test-bench demand for cell-formation and module-validation stations. Mexico's growing role as an EV assembly hub for GM and BMW is creating downstream demand for end-of-line test infrastructure.

Europe

Country Metric Key Driver
Germany 34.8% CAGR Fraunhofer battery labs, OEM HQ concentration
United Kingdom USD 5.12 Million (2024) Faraday Institution R&D programs
France 32.7% CAGR ACC and Verkor gigafactories
Italy USD 2.85 Million (2024) Stellantis Termoli conversion
Spain 31.0% CAGR Volkswagen Sagunto gigafactory
Nordic Countries USD 4.90 Million (2024) Northvolt and Freyr Battery
Russia 1.2% of regional share Limited domestic EV production
Rest of Europe 8.5% of regional share Poland, Hungary EV assembly


Europe's electric vehicle test equipment market growth is shaped by the EU Battery Regulation's compliance deadlines and the continent's aggressive CO₂ fleet-emission targets. Germany houses the largest concentration of powertrain R&D centers, while France's ACC joint venture and Verkor are building cell-production capacity that will require thousands of test channels by 2028 [2][17].

Asia-Pacific

Country Metric Key Driver
China 62.4% of regional share CATL, BYD, mega-factory scale
India 37.8% CAGR PLI scheme for ACC batteries
Japan USD 9.15 Million (2024) Toyota solid-state push
South Korea 35.2% CAGR Samsung SDI, LG, SK On expansions
ASEAN USD 4.60 Million (2024) Thailand, Indonesia nickel-chain investment
Rest of Asia-Pacific 3.1% of regional share Australia, Taiwan niche segments


Asia-Pacific's dominance in the electric vehicle test equipment market traces directly to China, which produces more than 60% of the world's lithium-ion cells [9]. India's Production-Linked Incentive scheme targets 50 GWh of cell capacity, while South Korea's chaebols continue to expand cathode and cell lines in Chungcheong and Gyeonggi provinces [10].

South America

Country Metric Key Driver
Brazil 58.6% of regional share Lithium reserves, Stellantis bio-hybrid plants
Argentina 27.4% of regional share Lithium-triangle mining growth
Rest of South America 14.0% of regional share Chile lithium processing


South America's role in the electric vehicle test equipment market is emerging, primarily through lithium-extraction infrastructure in Argentina and Chile and Brazil's expanding EV assembly footprint under Stellantis and Great Wall Motor [10].

Middle East & Africa

Country Metric Key Driver
Saudi Arabia 31.5% of regional share NEOM green-hydrogen projects
UAE 28.7% of regional share EV import mandates, smart-city initiatives
South Africa 22.3% of regional share Automotive-industry diversification
Egypt 10.1% of regional share CKD assembly expansion
Rest of MEA 7.4% of regional share Early-stage EV adoption


The Middle East & Africa electric vehicle test equipment market remains small but is poised for rapid growth as Gulf states channel sovereign-wealth capital into green-hydrogen and EV-fleet electrification programs. Saudi Arabia's Vision 2030 automotive cluster and the UAE's net-zero 2050 strategy are creating laboratory-level demand [18].


Electric Vehicle Test Equipment Market By Region, 2025-2035

Competitive Benchmarking

The electric vehicle test equipment market exhibits medium concentration, with the top five vendors collectively holding an estimated 35–42% revenue share. The Herfindahl-Hirschman Index sits in the 900–1,200 range, indicating a moderately fragmented structure where no single player exceeds 12% share. Competition centers on measurement accuracy, channel density, software-ecosystem integration, and global service footprint.

Company Est. Revenue Share Range Key Offerings Strategic Positioning
AVL List GmbH ~8–11% Battery, e-motor, and powertrain test benches Full-spectrum drivetrain validation partner
Horiba Ltd. ~7–10% EV dyno systems, emission and battery test Integrated automotive test conglomerate
Keysight Technologies ~6–9% Power-electronics analyzers, HIL platforms High-precision measurement leader
Chroma ATE Inc. ~5–8% Battery-cell cyclers, regenerative grid simulators High-channel-density cost leader
National Instruments (Emerson) ~5–7% Modular PXI test platforms, LabVIEW integration Software-defined test flexibility
dSPACE GmbH ~4–6% HIL simulators, ADAS validation Real-time simulation specialist
NH Research (NHR) ~3–5% Bidirectional DC sources, battery-pack testers Regenerative power-cycling niche
Arbin Instruments ~2–4% High-precision battery-cell test systems R&D-grade cycling accuracy
Hioki E.E. Corporation ~2–4% Battery impedance analyzers, insulation testers Compact safety-test instrumentation
MTS Systems (Amphenol) ~2–3% Structural and durability test rigs Mechanical-load testing heritage


Recent News & Developments


  • Chroma ATE (December 2024)launches a one-stop battery cell charge/discharge system. Its SoC/Analog Test System 3650-S2 wins the 2025 Taiwan Excellence Award.


Electric Vehicle Test Equipment Market Report Scope

Parameter Detail
Market Scope Electric Vehicle Test Equipment Market — global
Study Period 2021–2035
CAGR (2026–2035) 28.90%
Base Year Market Size USD 225.80 Million (2025)
Forecast Endpoint USD 2,858.10 Million (2035)
Fastest Growing Segment EVSE / Charging Test Systems (33.0% CAGR)
Fastest Growing Region Asia-Pacific (35.5% CAGR)
Companies Profiled 10
Valuation Currency USD Million


FAQs

How do 800 V test platforms differ from 400 V predecessors in safety architecture?

800 V platforms require enhanced arc-flash protection, higher-rated contactors, and dual-redundant ground-fault monitoring that add roughly 25–30% to station hardware cost [3]. Operators also need upgraded personal protective equipment rated for CAT IV environments.

What procurement factors should labs prioritize when selecting battery cyclers?

Channel scalability, regenerative-energy efficiency above 90%, and native software integration with laboratory information management systems are the three criteria that most strongly predict long-term cost-effectiveness [22]. Vendor service-network proximity matters for uptime guarantees.

How will solid-state cell testing reshape equipment specifications by 2030?

Solid-state cells demand stack-pressure control fixtures and ultra-low-current impedance spectroscopy channels not found on conventional cyclers [7]. Equipment vendors are developing modular pressure-application inserts that retrofit existing frames.

Can test-as-a-service models meaningfully reduce validation costs for EV startups?

Shared-lab models cut capital outlay by 50–70% versus in-house builds, though per-test unit costs remain 15–20% higher due to scheduling overhead [17]. Startups typically break even on outsourcing below 5,000 annual pack tests.

What role does cybersecurity type-approval play in test-equipment purchasing decisions?

UNECE R155 compliance requires hardware-in-the-loop rigs capable of simulating CAN-bus intrusion and OTA-update fault injection [13]. Labs without these capabilities face exclusion from European type-approval contracts.

How are regenerative battery cyclers improving laboratory energy economics?

Modern regenerative cyclers recover 92–98% of discharge energy back to the AC grid, reducing laboratory electricity costs by up to 60% compared with resistive-load systems [22]. Payback periods typically fall under three years at high utilization rates.

Which emerging test category is most likely to create a new revenue vertical before 2030?

Second-life battery grading stations—combining rapid impedance spectroscopy with AI-based state-of-health prediction—are poised to become a distinct equipment category as first-generation EV packs reach retirement volumes after 2028 [2].


Author
Author
Author Profile
Priya Nagrale LinkedIn
Senior Research Analyst
With an experience of over five years in market research industry (Chemicals & Materials domain), I gather and analyze market data from diverse sources to produce results, which are then presented back to a client. Also, provide recommendations based on the findings. As a Senior Research Analyst, I perform quality checks (QC) for market estimations, QC for reports, and handle queries and work extensively on client customizations. Also, handle the responsibilities of client proposals, report planning, report finalization, and execution

Research Approach


Secondary Research

The secondary research process involved comprehensive analysis of regulatory databases, industry standards repositories, peer-reviewed engineering journals, technical publications, and authoritative automotive and energy organizations. Key sources included:

Regulatory & Standards Bodies:

US Department of Transportation (DOT) / National Highway Traffic Safety Administration (NHTSA)

US Environmental Protection Agency (EPA) - Vehicle Emissions & Certification

European Union Agency for the Safety of Aviation (EASA) - Automotive EMC Standards

International Electrotechnical Commission (IEC) - EV Charging Standards (IEC 61851, IEC 62196)

Society of Automotive Engineers (SAE International) - J3072, J1772 Standards

International Organization for Standardization (ISO) - ISO 6469, ISO 12405 (EV Safety & Battery Testing)

China Ministry of Industry and Information Technology (MIIT) - NEV Certification

Japan Ministry of Land, Infrastructure, Transport and Tourism (MLIT) - Type Approval Standards

India Automotive Research Association (ARAI) - CMVR Compliance Testing

German Kraftfahrt-Bundesamt (KBA) - Type Approval & Homologation

Government & Energy Organizations:

US Department of Energy (DOE) / Office of Energy Efficiency & Renewable Energy (EERE)

International Energy Agency (IEA) Global EV Outlook & EVI Data

European Alternative Fuels Observatory (EAFO)

China Association of Automobile Manufacturers (CAAM)

European Automobile Manufacturers' Association (ACEA)

US Bureau of Transportation Statistics (BTS)

International Council on Clean Transportation (ICCT)

Technical & Research Databases:

IEEE Xplore Digital Library (EV Power Electronics & Testing)

ScienceDirect / Elsevier (Battery Testing & Validation Research)

SAE Technical Papers Database

National Renewable Energy Laboratory (NREL) Publications

Idaho National Laboratory (INL) - Advanced Vehicle Testing

Argonne National Laboratory - Transportation Research

Industry & Market Sources:

International Energy Agency (IEA) Global EV Data Explorer

BloombergNEF Electric Vehicle Outlook

EV-Volumes Global Sales Database

MarkLines Automotive Industry Portal

European Environment Agency (EEA) - Transport Emissions Data

These sources were utilized to collect EV production statistics, regulatory compliance requirements, testing protocol standards, battery safety certification data, charging infrastructure specifications, and competitive landscape analysis for battery test systems, power electronics test equipment, e-motor testing systems, chassis dynamometers, and EV charging test solutions.


Primary Research

In order to gather both qualitative and quantitative insights, supply-side and demand-side stakeholders were interviewed during the primary research process. CEOs, VPs of Engineering, heads of Test & Measurement departments, and business development directors from manufacturers of EV test equipment, automotive testing service providers, and system integrators were examples of supply-side sources. Demand-side sources included procurement heads from EV manufacturing facilities, battery gigafactories, and independent testing laboratories; R&D directors from OEMs (EV and traditional switching to EV); battery pack engineering managers; powertrain test engineers; and quality assurance leads from Tier-1 suppliers. Market segmentation, product development roadmaps, testing methodology adoption trends, capital investment cycles, and after-sales service requirements were all confirmed by primary research.

Primary Respondent Breakdown:

Table

Copy

By Company Tier

Tier 1 (>USD 5B revenue) 38%

Tier 2 (USD 500M-5B) 31%

Table

Copy

By Designation

C-level Primaries (CEO, CTO, VP) 32%

Director Level (R&D, Engineering, Product) 34%

Others (Managers, Specialists, Engineers) 34%

Table

Copy

By Region

North America 31%

Europe 29%

Asia-Pacific 33%

Rest of World (Latin America, MEA) 7%


Market Size Estimation

Global market valuation was derived through revenue mapping and equipment deployment analysis. The methodology included:

Identification of 50+ key manufacturers across North America, Europe, Asia-Pacific, and China specifically

Product mapping across battery pack test systems, battery cell testers, power electronics/HIL test systems, e-motor dynamometers, transmission test stands, EMC test chambers, environmental chambers for EVs, and charging station test equipment

Analysis of reported and modeled annual revenues specific to EV test equipment portfolios

Coverage of manufacturers representing 65-70% of global market share in 2024

Extrapolation using bottom-up (EV production volume × testing intensity × equipment ASP by region) and top-down (manufacturer revenue validation, testing service provider capex analysis) approaches to derive segment-specific valuations

Triangulation with EV production forecasts from IEA and regional automotive associations to project equipment replacement cycles and new facility investments

This methodology covers the key segments identified in the EV test equipment market: battery testing, power electronics testing, e-motor testing, chassis testing, and charging infrastructure testing, with appropriate authoritative sources for this technical automotive sector.

Download Free Sample

Kindly complete the form below to receive a free sample of this Report

Download PDF ×

We do not share your information with anyone. However, we may send you emails based on your report interest from time to time. You may contact us at any time to opt-out.