• Cat-intel
  • MedIntelliX
  • Resources
  • About Us
  • Hero Background
    English
    Chinese
    French
    Japanese
    Korean
    German
    Spanish

    Electrical Electronic Computer Aided Design Market Analysis

    ID: MRFR/ICT/8828-CR
    141 Pages
    Aarti Dhapte
    November 2020

    Electrical and Electronic Computer-Aided Design Market Research Report Information By Component (Software and Services), Industry Type (Process Industry and Discrete Industry), Application (Industrial Machine Controls, Plant Design, Mining Equipment Control, Rail Signaling, Switchgear Design, Water Treatment and Distribution System Control and Others), Vertical (Automotive, Plant Design, Aerosp...

    Share:
    Download PDF ×

    We do not share your information with anyone. However, we may send you emails based on your report interest from time to time. You may contact us at any time to opt-out.

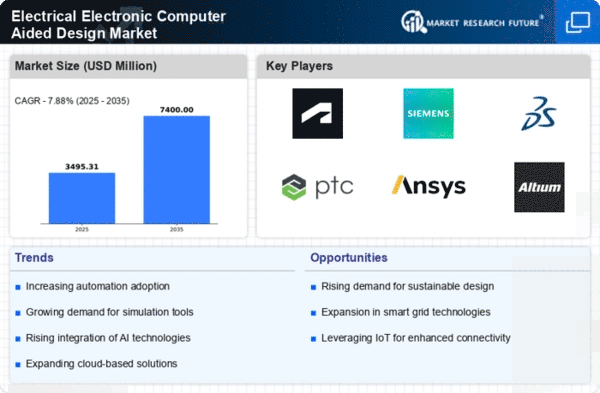
    Electrical Electronic Computer Aided Design Market Infographic
    $ 4,950.0
    $ 5,950.0
    $ 7,250.0

    Market Analysis

    In-depth Analysis of Electrical Electronic Computer Aided Design Market Industry Landscape

    ECAD, or Electronic Computer-Aided Design, stands as a transformative technology primarily utilized for design and technical documentation, replacing traditional manual drafting with more efficient automated processes. This software plays a crucial role in the design of Printed Circuit Boards (PCBs) and other electronic systems, finding significant applications in smart grids and smart metering. In the realm of power utilities, especially in the context of smart grids and smart meters, the adoption of ECAD tools becomes imperative to achieve sustainable objectives. These tools facilitate the design of intricate electronic systems that form the backbone of modern power infrastructure, ensuring efficiency and reliability in the increasingly complex landscape of power utilities. For power system operators and planners, ECAD software emerges as a vital asset, providing flexibility and robust capabilities to support the daily simulation and analysis work conducted by utility companies. The dynamic nature of power systems requires sophisticated tools like ECAD to navigate the complexities of grid management effectively. These software solutions empower operators and planners to simulate various scenarios, analyze data, and make informed decisions crucial for the seamless functioning of power grids. One of the key advantages offered by ECAD software lies in its ability to minimize project rework and backlogs. By enabling designers to capture real-world conditions at the early stages of the design process, ECAD tools contribute to more accurate and efficient designs. This capability becomes particularly significant in the context of power utilities, where precision and reliability are paramount. Reducing rework not only saves time but also enhances the overall productivity of design teams. Moreover, ECAD software is designed to evolve in tandem with the changing standards of smart grids. As the landscape of power utilities undergoes continuous transformation with the integration of smart technologies, ECAD tools ensure that designers can adapt to evolving standards seamlessly. This adaptability is crucial for staying abreast of the latest advancements in smart grid technologies and incorporating them into the design processes effectively. In the context of smart grids and smart metering, ECAD software contributes to the efficiency and sustainability of power utilities. These advanced systems demand intricate designs that ECAD tools are well-equipped to handle. From designing complex circuitry to ensuring compliance with evolving standards, ECAD plays a pivotal role in shaping the future of power infrastructure. ECAD technology is a cornerstone in the design and documentation processes within the realm of power utilities. Its applications extend to the design of critical components such as PCBs and electronic systems, especially in the context of smart grids and smart metering. The adoption of ECAD tools becomes essential for power system operators and planners, providing them with the flexibility and capabilities needed to navigate the complexities of modern power grids. With the ability to minimize rework, adapt to changing standards, and support sustainable objectives, ECAD software stands as a key enabler in the evolution of power infrastructure towards greater efficiency and reliability.

    Market Summary

    As per Market Research Future Analysis, the Electrical and Electronic Computer-Aided Design (ECAD) market is projected to grow from USD 3.21 billion in 2024 to USD 5.47 billion by 2032, with a CAGR of 7.90% during the forecast period. The market was valued at USD 2.98 billion in 2023. ECAD software is essential for designing electrical components across various industries, including automotive, aerospace, and energy. The software enhances accuracy, reduces human errors, and improves efficiency in product design. The pandemic has accelerated the adoption of ECAD tools, facilitating remote work and increasing demand for cloud-based solutions. However, challenges such as software piracy and storage requirements persist, impacting market growth.

    Key Market Trends & Highlights

    The Electrical and Electronic Computer-Aided Design market is witnessing significant growth driven by technological advancements and increased demand across various sectors.

    • Market size in 2024: USD 3.21 billion; projected to reach USD 5.47 billion by 2032.
    • CAGR of 7.90% during the forecast period (2024 - 2032).
    • Valued at USD 2.98 billion in 2023.
    • Increased adoption of cloud-based ECAD tools enhancing efficiency and reducing costs.

    Market Size & Forecast

    2024 Market Size USD 3.21 billion
    2032 Market Size USD 5.47 billion
    CAGR 7.90%
    2023 Market Size USD 2.98 billion.

    Major Players

    Aucotec AG, IGE+XAO Group, Bentley Systems Inc., Siemens AG, Dassault Systèmes SE, Zuken, TRIMBLE INC., Sienna Ecad Technologies, MENTOR GRAPHICS, Eplan Software & Service Gmbh & Co. KG, WSCAD, Autodesk Inc., ALPI International Software SA, Cadence Design System Inc., Hexagon AB.

    Market Trends

    The ongoing evolution of technology and increasing demand for advanced electronic systems are driving the growth of the Electrical and Electronic Computer-Aided Design market, reflecting a broader trend towards digital transformation across industries.

    U.S. Department of Commerce

    Electrical Electronic Computer Aided Design Market Market Drivers

    Market Growth Projections

    Emergence of 5G Technology

    The emergence of 5G technology is poised to reshape the Global Electrical and Electronic Computer-Aided Design Market Industry. With its promise of faster data transmission and enhanced connectivity, 5G is driving the development of next-generation electronic devices that require advanced design capabilities. CAD tools are essential for engineers to create designs that can leverage the benefits of 5G, such as improved performance and reduced latency. As industries adopt 5G solutions, the demand for sophisticated CAD applications is likely to increase, further propelling market growth in the coming years.

    Growing Focus on Sustainability

    Sustainability has become a critical driver in the Global Electrical and Electronic Computer-Aided Design Market Industry. As environmental concerns rise, companies are increasingly prioritizing eco-friendly design practices. CAD tools that facilitate sustainable design, such as energy-efficient simulations and material optimization, are gaining traction. This shift is evident as organizations aim to reduce their carbon footprint and comply with stringent regulations. The market's evolution towards sustainability is likely to influence product development and design methodologies, ensuring that future electronic products are not only innovative but also environmentally responsible.

    Expansion of the Automotive Sector

    The automotive sector's expansion significantly impacts the Global Electrical and Electronic Computer-Aided Design Market Industry. With the rise of electric vehicles and autonomous driving technologies, there is an increasing demand for advanced design tools that can accommodate complex electronic systems. CAD solutions are essential for developing innovative automotive designs, ensuring safety, and enhancing performance. As the automotive industry continues to evolve, the need for specialized CAD applications tailored to automotive electronics is expected to grow, further driving market expansion. This trend underscores the importance of CAD in meeting the unique challenges posed by modern automotive engineering.

    Integration of AI and Machine Learning

    The integration of artificial intelligence and machine learning into the Global Electrical and Electronic Computer-Aided Design Market Industry is transforming design processes. These technologies enable designers to automate repetitive tasks, optimize designs, and predict potential issues before they arise. As a result, companies can achieve higher levels of efficiency and innovation. The adoption of AI-driven CAD tools is anticipated to accelerate, as organizations seek to leverage data analytics for better decision-making. This trend not only enhances productivity but also aligns with the industry's growth trajectory, with a projected CAGR of 7.16% from 2025 to 2035.

    Rising Demand for Advanced Electronic Products

    The Global Electrical and Electronic Computer-Aided Design Market Industry experiences a surge in demand for advanced electronic products, driven by the proliferation of smart devices and IoT applications. As industries increasingly adopt automation and smart technologies, the need for sophisticated design tools becomes paramount. In 2024, the market is projected to reach 3.21 USD Billion, reflecting the industry's response to these technological advancements. Companies are investing in CAD solutions that enhance design efficiency, reduce time-to-market, and improve product quality. This trend is likely to continue, as the market is expected to grow significantly, reaching 6.87 USD Billion by 2035.

    Market Segment Insights

    Regional Insights

    Key Companies in the Electrical Electronic Computer Aided Design Market market include

    Industry Developments

    The product lifestyle management suite has been developed recently which comes along the help guidelines to assist the engineers and bring out the suitable designs for their equipment.

    The cutting-edge technology and cloud-based technology have increased the value of the existing ECAD tools. Also, the 3D printers being used for the construction department helps the builders to construct the apartment blocks before investing. Such trends have been helping in building residential units in highly populated areas.

    Future Outlook

    Electrical Electronic Computer Aided Design Market Future Outlook

    The Electrical and Electronic Computer-Aided Design Market is projected to grow at a 7.16% CAGR from 2024 to 2035, driven by advancements in automation, increased demand for smart devices, and the rise of IoT applications.

    New opportunities lie in:

    • Develop AI-driven design tools to enhance efficiency and reduce time-to-market.
    • Expand cloud-based CAD solutions to cater to remote collaboration needs.
    • Invest in sustainable design practices to meet growing environmental regulations.

    By 2035, the market is expected to reach a robust position, reflecting substantial growth and innovation.

    Market Segmentation

    Report Scope

    Report Attribute/Metric Details
      Market Size   2032: USD 5.47 Billion
      CAGR   7.90% (2024-2032)
      Base Year   2023
      Forecast Period   2024-2032
      Historical Data   2018
      Forecast Units   Value (USD Billion)
      Report Coverage   Revenue Forecast, Competitive Landscape, Growth Factors, and Trends
      Segments Covered   By Component, By Industry Type
      Geographies Covered   North America, Europe, Asia-Pacific, and Rest of the World (RoW)
      Key Vendors   Zuken (Japan), Aucotec AG (Germany), WSCAD (Germany), MENTOR GRAPHICS (US), Autodesk Inc. (US), Sienna Ecad Technologies (India), Dassault Systèmes SE (France), TRIMBLE INC. (US), Hexagon AB (Sweden), IGE+XAO Group (France), Siemens AG (Germany), Eplan Software & Service Gmbh & Co. KG (Germany), Bentley Systems, Inc.(US), ALPI International Software SA (France), and Cadence Design System Inc. (US).
      Key Market Opportunities   Smart metering and establishment of smart grids are opportunities for players to expand their reach in the market.
      Key Market Drivers   Creation of electrical schematic designs and automated filling of lists and bill of materials is the major driver of the ECAD design market.

    Market Highlights

    Author

    Aarti Dhapte
    Team Lead - Research

    She holds an experience of about 6+ years in market research and business consulting, working under the spectrum of information communication technology, telecommunications and semiconductor domains. aarti conceptualizes and implements a scalable business strategy and provides strategic leadership to the clients. her expertise lies in market estimation, competitive intelligence, pipeline analysis, customer assessment, etc.

    Leave a Comment

    Latest Comments

    John Doe
    john@example.com

    This is a great article! Really helped me understand the topic better.

    Posted on July 23, 2025, 10:15 AM
    Jane Smith
    jane@domain.com

    Thanks for sharing this. I’ve bookmarked it for later reference.

    Posted on July 22, 2025, 7:45 PM

    FAQs

    What is the major driver of the ECAD design market?

    Creation of electrical schematic designs and automated filling of lists and bill of materials is the major driver of the ECAD design market.

    What opportunities can be capitalized by players to expand their reach in the global ECAD design market?

    Smart metering and establishment of smart grids are opportunities for players to expand their reach in the market.

    What is the growth rate predicted for the global ECAD design market?

    The global ECAD design market is predicted to expand at 7.90% CAGR from 2024 to 2032.

    Which application can gain the lead in the market?

    Industrial machine controls can gain the lead in the market.

    Which region can lead in the global ECAD design market?

    North America can lead in the global ECAD design market.

    Who are the major vendors of the market?

    TRIMBLE INC., IGE+XAO Group, Siemens AG, Sienna Ecad Technologies, Autodesk Inc., Hexagon AB, MENTOR GRAPHICS, Bentley Systems, Inc., WSCAD, Cadence Design System Inc., Aucotec AG, Eplan Software & Service Gmbh & Co. KG, ALPI International Software SA, Dassault Systèmes SE, and Zuken are the vendors of the market.

    1. Executive Summary
      1. GLOBAL ELECTRICAL COMPUTER-AIDED DESIGN (ECAD) MARKET, BY COMPONENT, 2020-202718
      2. GLOBAL ELECTRICAL COMPUTER-AIDED DESIGN (ECAD) MARKET, BY INDUSTRY TYPE, 2020-202719
      3. GLOBAL ELECTRICAL COMPUTER-AIDED DESIGN (ECAD) MARKET, BY APPLICATION, 2020-202720
      4. GLOBAL ELECTRICAL COMPUTER-AIDED DESIGN (ECAD) MARKET, BY VERTICAL, 2020-202721
      5. GLOBAL ELECTRICAL COMPUTER-AIDED DESIGN (ECAD) MARKET, BY REGION 22
    2. Market Introduction
      1. DEFINITION 23
      2. Scope of the Study 23
      3. RESEARCH OBJECTIVE 23
      4. MARKET STRUCTURE 24
    3. Research Methodology
    4. MARKET DYNAMICS
      1. INTRODUCTION 31
      2. DRIVERS 32
        1. INCREASING USE OF CLOUD-BASED ECAD TOOLS 32
        2. INCREASING DEMAND FOR ELECTRONIC DESIGN AUTOMATION (EDA) 32
        3. DRIVERS IMPACT ANALYSIS 33
      3. RESTRAINTS 33
        1. LACK OF TECHNICAL EXPERTISE 33
        2. RESTRAINT IMPACT ANALYSIS 34
      4. OPPORTUNITY 34
        1. PROLIFERATION OF SMART GRIDS AND SMART METERING 34
      5. CHALLENGE 34
        1. PIRACY OF ENGINEERING SOFTWARE 34
      6. IMPACT OF COVID-19 35
        1. DECREASE IN OVERALL MARKET GROWTH YEAR-ON-YEAR 35
        2. LESS DEMAND FROM EMERGING ECONOMIES 35
        3. SETBACK FOR CONSTRUCTION AND CIVIL PROJECTS IN 2020 36
    5. MARKET FACTOR ANALYSIS
      1. VALUE CHAIN ANALYSIS 37
        1. SOFTWARE/APPLICATION DEVELOPERS 38
        2. INTEGRATORS 38
        3. SOLUTION/SERVICE PROVIDERS 38
        4. END USERS 38
      2. PORTER’S FIVE FORCES MODEL 39
        1. THREAT OF NEW ENTRANTS 40
        2. BARGAINING POWER OF SUPPLIERS 40
        3. BARGAINING POWER OF BUYERS 40
        4. THREAT OF SUBSTITUTES 40
        5. INTENSITY OF RIVALRY 40
    6. GLOBAL ELECTRICAL COMPUTER-AIDED DESIGN (ECAD) MARKET, BY COMPONENT
      1. OVERVIEW 41
      2. SOFTWARE 43
      3. SERVICES 44
        1. SUPPORT 44
        2. TRAINING 45
        3. MAINTENANCE 46
    7. GLOBAL ELECTRICAL COMPUTER-AIDED DESIGN (ECAD) MARKET, BY INDUSTRY TYPE
      1. OVERVIEW 47
      2. DISCRETE INDUSTRY 48
      3. PROCESS INDUSTRY 49
    8. GLOBAL ELECTRICAL COMPUTER-AIDED DESIGN (ECAD) MARKET, BY APPLICATION
      1. OVERVIEW 50
      2. INDUSTRIAL MACHINE CONTROLS 52
      3. PLANT DESIGN 53
      4. MINING EQUIPMENT CONTROL 53
      5. RAIL SIGNALING 54
      6. SWITCHGEAR DESIGN 54
      7. WATER TREATMENT AND DISTRIBUTION SYSTEM CONTROL 55
      8. OTHERS 56
    9. GLOBAL ELECTRICAL COMPUTER-AIDED DESIGN (ECAD) MARKET, BY VERTICAL
      1. OVERVIEW 57
      2. AUTOMOTIVE 59
      3. AEROSPACE & DEFENSE 60
      4. CONSTRUCTION 60
      5. RAILWAY 61
      6. POWER GENERATION AND ENERGY 61
      7. EQUIPMENT AND MACHINERY 62
      8. OIL & GAS 62
      9. FOOD & BEVERAGE 63
      10. OTHERS 63
    10. GLOBAL ELECTRICAL COMPUTER-AIDED DESIGN (ECAD) MARKET, BY REGION
      1. OVERVIEW 64
      2. NORTH AMERICA 65
        1. US 71
        2. CANADA 73
        3. MEXICO 76
      3. EUROPE 78
        1. UK 85
        2. GERMANY 87
        3. FRANCE 89
        4. ITALY 91
        5. SPAIN 94
        6. REST OF EUROPE 96
      4. ASIA-PACIFIC 99
        1. CHINA 105
        2. JAPAN 107
        3. INDIA 110
        4. SOUTH KOREA 112
        5. REST OF ASIA-PACIFIC 114
      5. REST OF THE WORLD 116
        1. MIDDLE EAST & AFRICA 122
        2. SOUTH AMERICA 124
    11. Competitive Landscape
      1. VENDOR SHARE ANALYSIS 127
      2. COMPETITIVE BENCHMARKING 131
      3. RECENT DEVELOPMENTS 132
        1. PRODUCT DEVELOPMENT 132
        2. PARTNERSHIPS/AGREEMENTS/CONTRACTS/COLLABORATIONS 132
        3. MERGERS AND ACQUISITIONS 133
    12. COMPANY PROFILES
      1. ZUKEN 134
        1. COMPANY OVERVIEW 134
        2. FINANCIAL OVERVIEW 135
        3. PRODUCTS/SOLUTIONS/SERVICES/SOLUTIONS/SERVICES OFFERED 135
        4. KEY DEVELOPMENTS 136
        5. SWOT ANALYSIS 137
        6. KEY STRATEGIES 137
      2. AUCOTEC AG 138
        1. COMPANY OVERVIEW 138
        2. FINANCIAL OVERVIEW 138
        3. PRODUCTS/SOLUTIONS/SERVICES/SOLUTIONS/SERVICES OFFERED 138
        4. KEY DEVELOPMENTS 138
        5. SWOT ANALYSIS 139
        6. KEY STRATEGIES 139
      3. WSCAD 140
        1. COMPANY OVERVIEW 140
        2. FINANCIAL OVERVIEW 140
        3. PRODUCTS/SOLUTIONS/SERVICES/SOLUTIONS/SERVICES OFFERED 140
        4. KEY DEVELOPMENTS 140
        5. SWOT ANALYSIS 141
        6. KEY STRATEGIES 141
      4. MENTOR GRAPHICS 142
        1. COMPANY OVERVIEW 142
        2. FINANCIAL OVERVIEW 142
        3. PRODUCTS/SOLUTIONS/SERVICES/SOLUTIONS/SERVICES OFFERED 142
        4. KEY DEVELOPMENTS 142
        5. SWOT ANALYSIS 143
        6. KEY STRATEGIES 143
      5. AUTODESK INC. 144
        1. COMPANY OVERVIEW 144
        2. FINANCIAL OVERVIEW 145
        3. PRODUCTS/SOLUTIONS/SERVICES/SOLUTIONS/SERVICES OFFERED 145
        4. KEY DEVELOPMENTS 146
        5. SWOT ANALYSIS 147
        6. KEY STRATEGIES 147
      6. SIENNA ECAD TECHNOLOGIES 148
        1. COMPANY OVERVIEW 148
        2. FINANCIAL OVERVIEW 148
        3. PRODUCTS/SOLUTIONS/SERVICES/SOLUTIONS/SERVICES OFFERED 148
        4. KEY DEVELOPMENTS 148
        5. SWOT ANALYSIS 149
      7. DASSAULT SYSTÈMES SE 150
        1. COMPANY OVERVIEW 150
        2. FINANCIAL OVERVIEW 151
        3. PRODUCTS/SOLUTIONS/SERVICES/SOLUTIONS/SERVICES OFFERED 151
        4. KEY DEVELOPMENTS 152
        5. SWOT ANALYSIS 152
        6. KEY STRATEGIES 152
      8. TRIMBLE INC 153
        1. COMPANY OVERVIEW 153
        2. FINANCIAL OVERVIEW 154
        3. PRODUCTS/SOLUTIONS/SERVICES/SOLUTIONS/SERVICES OFFERED 154
        4. KEY DEVELOPMENTS 155
        5. SWOT ANALYSIS 155
        6. KEY STRATEGIES 155
      9. HEXAGON AB 156
        1. COMPANY OVERVIEW 156
        2. FINANCIAL OVERVIEW 156
        3. PRODUCTS/SOLUTIONS/SERVICES/SOLUTIONS/SERVICES OFFERED 157
        4. KEY DEVELOPMENTS 157
        5. SWOT ANALYSIS 158
        6. KEY STRATEGIES 158
      10. IGE+XAO GROUP 159
        1. COMPANY OVERVIEW 159
        2. FINANCIAL OVERVIEW 159
        3. PRODUCTS/SOLUTIONS/SERVICES/SOLUTIONS/SERVICES OFFERED 160
        4. KEY DEVELOPMENTS 160
        5. SWOT ANALYSIS 161
        6. KEY STRATEGIES 161
      11. SIEMENS AG 162
        1. COMPANY OVERVIEW 162
        2. FINANCIAL OVERVIEW 163
        3. PRODUCTS/SOLUTIONS/SERVICES/SOLUTIONS/SERVICES OFFERED 163
        4. KEY DEVELOPMENTS 164
        5. SWOT ANALYSIS 164
        6. KEY STRATEGIES 164
      12. EPLAN SOFTWARE & SERVICE GMBH & CO. KG 165
        1. COMPANY OVERVIEW 165
        2. FINANCIAL OVERVIEW 165
        3. PRODUCTS/SOLUTIONS/SERVICES OFFERED 165
        4. KEY DEVELOPMENTS 166
        5. SWOT ANALYSIS 167
        6. KEY STRATEGIES 167
      13. BENTLEY SYSTEMS, INC. 168
        1. COMPANY OVERVIEW 168
        2. FINANCIAL OVERVIEW 168
        3. PRODUCTS/SOLUTIONS/SERVICES OFFERED 168
        4. KEY DEVELOPMENTS 169
        5. SWOT ANALYSIS 170
        6. KEY STRATEGIES 170
      14. ALPI INTERNATIONAL SOFTWARE SA 171
        1. COMPANY OVERVIEW 171
        2. FINANCIAL OVERVIEW 171
        3. PRODUCTS/SOLUTIONS/SERVICES OFFERED 171
        4. KEY DEVELOPMENTS 172
        5. SWOT ANALYSIS 173
        6. KEY STRATEGIES 173
    13. INDUSTRY INSIGHTS
      1. TECHNOLOGICAL IMPACT ANALYSIS 174
      2. USE CASES 174
      3. BEST PRACTICES 174
    14. List of Tables and Figures
      1. 14 LIST OF TABLES
      2. TABLE 1 GLOBAL ECAD MARKET ESTIMATES & FORECAST, BY COMPONENT, 2020-2027(USD MILLION) 43
      3. TABLE 2 SOFTWARE: GLOBAL ECAD MARKET SIZE, BY REGION, 2020-2027(USD MILLION) 43
      4. TABLE 3 GLOBAL ECAD MARKET ESTIMATES & FORECAST, BY SERVICE, 2020-2027(USD MILLION) 44
      5. TABLE 4 SERVICE: GLOBAL ECAD MARKET SIZE, BY REGION, 2020-2027(USD MILLION) 44
      6. TABLE 5 SUPPORT SERVICES: GLOBAL ECAD MARKET SIZE, BY REGION, 2020-2027(USD MILLION) 45
      7. TABLE 6 TRAINING SERVICES: GLOBAL ECAD MARKET SIZE, BY REGION, 2020-2027(USD MILLION) 45
      8. TABLE 7 MAINTENANCE SERVICES: GLOBAL ECAD MARKET SIZE, BY REGION, 2020-2027(USD MILLION) 46
      9. TABLE 8 GLOBAL ECAD MARKET ESTIMATES & FORECAST, BY INDUSTRY TYPE, 2020-2027(USD MILLION) 48
      10. TABLE 9 DISCRETE INDUSTRY: GLOBAL ECAD MARKET SIZE, BY REGION, 2020-2027(USD MILLION) 49
      11. TABLE 10 PROCESS INDUSTRY: GLOBAL ECAD MARKET SIZE, BY REGION, 2020-2027(USD MILLION) 49
      12. TABLE 11 GLOBAL ECAD MARKET ESTIMATES & FORECAST, BY APPLICATION, 2020-2027(USD MILLION) 51
      13. TABLE 12 INDUSTRIAL MACHINE CONTROLS: GLOBAL ECAD MARKET SIZE, BY REGION, 2020-2027(USD MILLION) 52
      14. TABLE 13 PLANT DESIGN: GLOBAL ECAD MARKET SIZE, BY REGION, 2020-2027(USD MILLION) 53
      15. TABLE 14 MINING EQUIPMENT CONTROL: GLOBAL ECAD MARKET SIZE, BY REGION, 2020-2027(USD MILLION) 53
      16. TABLE 15 RAIL SIGNALING: GLOBAL ECAD MARKET SIZE, BY REGION, 2020-2027(USD MILLION) 54
      17. TABLE 16 SWITCHGEAR DESIGN: GLOBAL ECAD MARKET SIZE, BY REGION, 2020-2027(USD MILLION) 54
      18. TABLE 17 WATER TREATMENT AND DISTRIBUTION SYSTEM CONTROL: GLOBAL ECAD MARKET SIZE, BY REGION, 2020-2027(USD MILLION) 55
      19. TABLE 18 OTHERS: GLOBAL ECAD MARKET SIZE, BY REGION, 2020-2027(USD MILLION) 56
      20. TABLE 19 GLOBAL ECAD MARKET ESTIMATES & FORECAST, BY VERTICAL, 2020-2027(USD MILLION) 59
      21. TABLE 20 AUTOMOTIVE: GLOBAL ECAD MARKET SIZE, BY REGION, 2020-2027(USD MILLION) 59
      22. TABLE 21 AEROSPACE & DEFENSE: GLOBAL ECAD MARKET SIZE, BY REGION, 2020-2027(USD MILLION) 60
      23. TABLE 22 CONSTRUCTION: GLOBAL ECAD MARKET SIZE, BY REGION, 2020-2027(USD MILLION) 60
      24. TABLE 23 RAILWAY: GLOBAL ECAD MARKET SIZE, BY REGION, 2020-2027(USD MILLION) 61
      25. TABLE 24 POWER GENERATION AND ENERGY: GLOBAL ECAD MARKET SIZE, BY REGION, 2020-2027(USD MILLION) 61
      26. TABLE 25 EQUIPMENT AND MACHINERY: GLOBAL ECAD MARKET SIZE, BY REGION, 2020-2027(USD MILLION) 62
      27. TABLE 26 OIL & GAS: GLOBAL ECAD MARKET SIZE, BY REGION, 2020-2027(USD MILLION) 62
      28. TABLE 27 FOOD & BEVERAGE: GLOBAL ECAD MARKET SIZE, BY REGION, 2020-2027(USD MILLION) 63
      29. TABLE 28 OTHERS: GLOBAL ECAD MARKET SIZE, BY REGION, 2020-2027(USD MILLION) 63
      30. TABLE 29 GLOBAL ECAD MARKET ESTIMATES & FORECAST, BY REGION, 2020-2027(USD MILLION) 64
      31. TABLE 30 NORTH AMERICA ECAD MARKET ESTIMATES & FORECAST, BY COUNTRY, 2020-2027(USD MILLION) 65
      32. TABLE 31 NORTH AMERICA ECAD MARKET ESTIMATES & FORECAST, BY COMPONENT, 2020-2027(USD MILLION) 66
      33. TABLE 32 NORTH AMERICA ECAD MARKET ESTIMATES & FORECAST, BY SERVICE, 2020-2027(USD MILLION) 67
      34. TABLE 33 NORTH AMERICA ECAD MARKET ESTIMATES & FORECAST, BY INDUSTRY TYPE, 2020-2027(USD MILLION) 68
      35. TABLE 34 NORTH AMERICA ECAD MARKET ESTIMATES & FORECAST, BY APPLICATION, 2020-2027(USD MILLION) 69
      36. TABLE 35 NORTH AMERICA ECAD MARKET ESTIMATES & FORECAST, BY VERTICAL, 2020-2027(USD MILLION) 70
      37. TABLE 36 US ECAD MARKET ESTIMATES & FORECAST, BY COMPONENT, 2020-2027(USD MILLION) 71
      38. TABLE 37 US ECAD MARKET ESTIMATES & FORECAST, BY SERVICE, 2020-2027(USD MILLION) 71
      39. TABLE 38 US ECAD MARKET ESTIMATES & FORECAST, BY INDUSTRY TYPE, 2020-2027(USD MILLION) 72
      40. TABLE 39 US ECAD MARKET ESTIMATES & FORECAST, BY APPLICATION, 2020-2027(USD MILLION) 72
      41. TABLE 40 US ECAD MARKET ESTIMATES & FORECAST, BY VERTICAL, 2020-2027(USD MILLION) 73
      42. TABLE 41 CANADA ECAD MARKET ESTIMATES & FORECAST, BY COMPONENT, 2020-2027(USD MILLION) 73
      43. TABLE 42 CANADA ECAD MARKET ESTIMATES & FORECAST, BY SERVICE, 2020-2027(USD MILLION) 74
      44. TABLE 43 CANADA ECAD MARKET ESTIMATES & FORECAST, BY INDUSTRY TYPE, 2020-2027(USD MILLION) 74
      45. TABLE 44 CANADA ECAD MARKET ESTIMATES & FORECAST, BY APPLICATION, 2020-2027(USD MILLION) 75
      46. TABLE 45 CANADA ECAD MARKET ESTIMATES & FORECAST, BY VERTICAL, 2020-2027(USD MILLION) 75
      47. TABLE 46 MEXICO ECAD MARKET ESTIMATES & FORECAST, BY COMPONENT, 2020-2027(USD MILLION) 76
      48. TABLE 47 MEXICO ECAD MARKET ESTIMATES & FORECAST, BY SERVICE, 2020-2027(USD MILLION) 76
      49. TABLE 48 MEXICO ECAD MARKET ESTIMATES & FORECAST, BY INDUSTRY TYPE, 2020-2027(USD MILLION) 77
      50. TABLE 49 MEXICO ECAD MARKET ESTIMATES & FORECAST, BY APPLICATION, 2020-2027(USD MILLION) 77
      51. TABLE 50 MEXICO ECAD MARKET ESTIMATES & FORECAST, BY VERTICAL, 2020-2027(USD MILLION) 78
      52. TABLE 51 EUROPE ECAD MARKET ESTIMATES & FORECAST, BY COUNTRY, 2020-2027(USD MILLION) 79
      53. TABLE 52 EUROPE ECAD MARKET ESTIMATES & FORECAST, BY COMPONENT, 2020-2027(USD MILLION) 80
      54. TABLE 53 EUROPE ECAD MARKET ESTIMATES & FORECAST, BY SERVICE, 2020-2027(USD MILLION) 81
      55. TABLE 54 EUROPE ECAD MARKET ESTIMATES & FORECAST, BY INDUSTRY TYPE, 2020-2027(USD MILLION) 82
      56. TABLE 55 EUROPE ECAD MARKET ESTIMATES & FORECAST, BY APPLICATION, 2020-2027(USD MILLION) 83
      57. TABLE 56 EUROPE ECAD MARKET ESTIMATES & FORECAST, BY VERTICAL, 2020-2027(USD MILLION) 84
      58. TABLE 57 UK ECAD MARKET ESTIMATES & FORECAST, BY COMPONENT, 2020-2027(USD MILLION) 85
      59. TABLE 58 UK ECAD MARKET ESTIMATES & FORECAST, BY SERVICE, 2020-2027(USD MILLION) 85
      60. TABLE 59 UK ECAD MARKET ESTIMATES & FORECAST, BY INDUSTRY TYPE, 2020-2027(USD MILLION) 85
      61. TABLE 60 UK ECAD MARKET ESTIMATES & FORECAST, BY APPLICATION, 2020-2027(USD MILLION) 86
      62. TABLE 61 UK ECAD MARKET ESTIMATES & FORECAST, BY VERTICAL, 2020-2027(USD MILLION) 86
      63. TABLE 62 GERMANY ECAD MARKET ESTIMATES & FORECAST, BY COMPONENT, 2020-2027(USD MILLION) 87
      64. TABLE 63 GERMANY ECAD MARKET ESTIMATES & FORECAST, BY SERVICE, 2020-2027(USD MILLION) 87
      65. TABLE 64 GERMANY ECAD MARKET ESTIMATES & FORECAST, BY INDUSTRY TYPE, 2020-2027(USD MILLION) 87
      66. TABLE 65 GERMANY ECAD MARKET ESTIMATES & FORECAST, BY APPLICATION, 2020-2027(USD MILLION) 88
      67. TABLE 66 GERMANY ECAD MARKET ESTIMATES & FORECAST, BY VERTICAL, 2020-2027(USD MILLION) 88
      68. TABLE 67 FRANCE ECAD MARKET ESTIMATES & FORECAST, BY COMPONENT, 2020-2027(USD MILLION) 89
      69. TABLE 68 FRANCE ECAD MARKET ESTIMATES & FORECAST, BY SERVICE, 2020-2027(USD MILLION) 89
      70. TABLE 69 FRANCE ECAD MARKET ESTIMATES & FORECAST, BY INDUSTRY TYPE, 2020-2027(USD MILLION) 90
      71. TABLE 70 FRANCE ECAD MARKET ESTIMATES & FORECAST, BY APPLICATION, 2020-2027(USD MILLION) 90
      72. TABLE 71 FRANCE ECAD MARKET ESTIMATES & FORECAST, BY VERTICAL, 2020-2027(USD MILLION) 91
      73. TABLE 72 ITALY ECAD MARKET ESTIMATES & FORECAST, BY COMPONENT, 2020-2027(USD MILLION) 91
      74. TABLE 73 ITALY ECAD MARKET ESTIMATES & FORECAST, BY SERVICE, 2020-2027(USD MILLION) 92
      75. TABLE 74 ITALY ECAD MARKET ESTIMATES & FORECAST, BY INDUSTRY TYPE, 2020-2027(USD MILLION) 92
      76. TABLE 75 ITALY ECAD MARKET ESTIMATES & FORECAST, BY APPLICATION, 2020-2027(USD MILLION) 93
      77. TABLE 76 ITALY ECAD MARKET ESTIMATES & FORECAST, BY VERTICAL, 2020-2027(USD MILLION) 93
      78. TABLE 77 SPAIN ECAD MARKET ESTIMATES & FORECAST, BY COMPONENT, 2020-2027(USD MILLION) 94
      79. TABLE 78 SPAIN ECAD MARKET ESTIMATES & FORECAST, BY SERVICE, 2020-2027(USD MILLION) 94
      80. TABLE 79 SPAIN ECAD MARKET ESTIMATES & FORECAST, BY INDUSTRY TYPE, 2020-2027(USD MILLION) 95
      81. TABLE 80 SPAIN ECAD MARKET ESTIMATES & FORECAST, BY APPLICATION, 2020-2027(USD MILLION) 95
      82. TABLE 81 SPAIN ECAD MARKET ESTIMATES & FORECAST, BY VERTICAL, 2020-2027(USD MILLION) 96
      83. TABLE 82 REST OF EUROPE ECAD MARKET ESTIMATES & FORECAST, BY COMPONENT, 2020-2027(USD MILLION) 96
      84. TABLE 83 REST OF EUROPE ECAD MARKET ESTIMATES & FORECAST, BY SERVICE, 2020-2027(USD MILLION) 97
      85. TABLE 84 REST OF EUROPE ECAD MARKET ESTIMATES & FORECAST, BY INDUSTRY TYPE, 2020-2027(USD MILLION) 97
      86. TABLE 85 REST OF EUROPE ECAD MARKET ESTIMATES & FORECAST, BY APPLICATION, 2020-2027(USD MILLION) 98
      87. TABLE 86 REST OF EUROPE ECAD MARKET ESTIMATES & FORECAST, BY VERTICAL, 2020-2027(USD MILLION) 98
      88. TABLE 87 ASIA-PACIFIC ECAD MARKET ESTIMATES & FORECAST, BY COUNTRY, 2020-2027(USD MILLION) 99
      89. TABLE 88 ASIA-PACIFIC ECAD MARKET ESTIMATES & FORECAST, BY COMPONENT, 2020-2027(USD MILLION) 100
      90. TABLE 89 ASIA-PACIFIC ECAD MARKET ESTIMATES & FORECAST, BY SERVICE, 2020-2027(USD MILLION) 101
      91. TABLE 90 ASIA-PACIFIC ECAD MARKET ESTIMATES & FORECAST, BY INDUSTRY TYPE, 2020-2027(USD MILLION) 102
      92. TABLE 91 ASIA-PACIFIC ECAD MARKET ESTIMATES & FORECAST, BY APPLICATION, 2020-2027(USD MILLION) 103
      93. TABLE 92 ASIA-PACIFIC ECAD MARKET ESTIMATES & FORECAST, BY VERTICAL, 2020-2027(USD MILLION) 104
      94. TABLE 93 CHINA ECAD MARKET ESTIMATES & FORECAST, BY COMPONENT, 2020-2027(USD MILLION) 105
      95. TABLE 94 CHINA ECAD MARKET ESTIMATES & FORECAST, BY SERVICE, 2020-2027(USD MILLION) 105
      96. TABLE 95 CHINA ECAD MARKET ESTIMATES & FORECAST, BY INDUSTRY TYPE, 2020-2027(USD MILLION) 106
      97. TABLE 96 CHINA ECAD MARKET ESTIMATES & FORECAST, BY APPLICATION, 2020-2027(USD MILLION) 106
      98. TABLE 97 CHINA ECAD MARKET ESTIMATES & FORECAST, BY VERTICAL, 2020-2027(USD MILLION) 107
      99. TABLE 98 JAPAN ECAD MARKET ESTIMATES & FORECAST, BY COMPONENT, 2020-2027(USD MILLION) 107
      100. TABLE 99 JAPAN ECAD MARKET ESTIMATES & FORECAST, BY SERVICE, 2020-2027(USD MILLION) 108
      101. TABLE 100 JAPAN ECAD MARKET ESTIMATES & FORECAST, BY INDUSTRY TYPE, 2020-2027(USD MILLION) 108
      102. TABLE 101 JAPAN ECAD MARKET ESTIMATES & FORECAST, BY APPLICATION, 2020-2027(USD MILLION) 109
      103. TABLE 102 JAPAN ECAD MARKET ESTIMATES & FORECAST, BY VERTICAL, 2020-2027(USD MILLION) 109
      104. TABLE 103 INDIA ECAD MARKET ESTIMATES & FORECAST, BY COMPONENT, 2020-2027(USD MILLION) 110
      105. TABLE 104 INDIA ECAD MARKET ESTIMATES & FORECAST, BY SERVICE, 2020-2027(USD MILLION) 110
      106. TABLE 105 INDIA ECAD MARKET ESTIMATES & FORECAST, BY INDUSTRY TYPE, 2020-2027(USD MILLION) 110
      107. TABLE 106 INDIA ECAD MARKET ESTIMATES & FORECAST, BY APPLICATION, 2020-2027(USD MILLION) 111
      108. TABLE 107 INDIA ECAD MARKET ESTIMATES & FORECAST, BY VERTICAL, 2020-2027(USD MILLION) 111
      109. TABLE 108 SOUTH KOREA ECAD MARKET ESTIMATES & FORECAST, BY COMPONENT, 2020-2027(USD MILLION) 112
      110. TABLE 109 SOUTH KOREA ECAD MARKET ESTIMATES & FORECAST, BY SERVICE, 2020-2027(USD MILLION) 112
      111. TABLE 110 SOUTH KOREA ECAD MARKET ESTIMATES & FORECAST, BY INDUSTRY TYPE, 2020-2027(USD MILLION) 112
      112. TABLE 111 SOUTH KOREA ECAD MARKET ESTIMATES & FORECAST, BY APPLICATION, 2020-2027(USD MILLION) 113
      113. TABLE 112 SOUTH KOREA ECAD MARKET ESTIMATES & FORECAST, BY VERTICAL, 2020-2027(USD MILLION) 113
      114. TABLE 113 REST OF ASIA-PACIFIC ECAD MARKET ESTIMATES & FORECAST, BY COMPONENT, 2020-2027(USD MILLION) 114
      115. TABLE 114 REST OF ASIA-PACIFIC ECAD MARKET ESTIMATES & FORECAST, BY SERVICE, 2020-2027(USD MILLION) 114
      116. TABLE 115 REST OF ASIA-PACIFIC ECAD MARKET ESTIMATES & FORECAST, BY INDUSTRY TYPE, 2020-2027(USD MILLION) 114
      117. TABLE 116 REST OF ASIA-PACIFIC ECAD MARKET ESTIMATES & FORECAST, BY APPLICATION, 2020-2027(USD MILLION) 115
      118. TABLE 117 REST OF ASIA-PACIFIC ECAD MARKET ESTIMATES & FORECAST, BY VERTICAL, 2020-2027(USD MILLION) 115
      119. TABLE 118 REST OF THE WORLD ECAD MARKET ESTIMATES & FORECAST, BY REGION, 2020-2027(USD MILLION) 116
      120. TABLE 119 REST OF THE WORLD ECAD MARKET ESTIMATES & FORECAST, BY COMPONENT, 2020-2027(USD MILLION) 117
      121. TABLE 120 REST OF THE WORLD ECAD MARKET ESTIMATES & FORECAST, BY SERVICE, 2020-2027(USD MILLION) 118
      122. TABLE 121 REST OF THE WORLD ECAD MARKET ESTIMATES & FORECAST, BY INDUSTRY TYPE, 2020-2027(USD MILLION) 119
      123. TABLE 122 REST OF THE WORLD ECAD MARKET ESTIMATES & FORECAST, BY APPLICATION, 2020-2027(USD MILLION) 120
      124. TABLE 123 REST OF THE WORLD ECAD MARKET ESTIMATES & FORECAST, BY VERTICAL, 2020-2027(USD MILLION) 121
      125. TABLE 124 MIDDLE EAST & AFRICA ECAD MARKET ESTIMATES & FORECAST, BY COMPONENT, 2020-2027(USD MILLION) 122
      126. TABLE 125 MIDDLE EAST & AFRICA ECAD MARKET ESTIMATES & FORECAST, BY SERVICE, 2020-2027(USD MILLION) 122
      127. TABLE 126 MIDDLE EAST & AFRICA ECAD MARKET ESTIMATES & FORECAST, BY INDUSTRY TYPE, 2020-2027(USD MILLION) 123
      128. TABLE 127 MIDDLE EAST & AFRICA ECAD MARKET ESTIMATES & FORECAST, BY APPLICATION, 2020-2027(USD MILLION) 123
      129. TABLE 128 MIDDLE EAST & AFRICA ECAD MARKET ESTIMATES & FORECAST, BY VERTICAL, 2020-2027(USD MILLION) 124
      130. TABLE 129 SOUTH AMERICA ECAD MARKET ESTIMATES & FORECAST, BY COMPONENT, 2020-2027(USD MILLION) 124
      131. TABLE 130 SOUTH AMERICA ECAD MARKET ESTIMATES & FORECAST, BY SERVICE, 2020-2027(USD MILLION) 125
      132. TABLE 131 SOUTH AMERICA ECAD MARKET ESTIMATES & FORECAST, BY INDUSTRY TYPE, 2020-2027(USD MILLION) 125
      133. TABLE 132 SOUTH AMERICA ECAD MARKET ESTIMATES & FORECAST, BY APPLICATION, 2020-2027(USD MILLION) 126
      134. TABLE 133 SOUTH AMERICA ECAD MARKET ESTIMATES & FORECAST, BY VERTICAL, 2020-2027(USD MILLION) 126
      135. TABLE 134 NEW PRODUCT DEVELOPMENT 132
      136. TABLE 135 PARTNERSHIPS/AGREEMENTS/COLLABORATIONS 132
      137. TABLE 136 MERGERS AND ACQUISITIONS 133
      138. TABLE 137 ZUKEN: PRODUCTS/SOLUTIONS/SERVICES/SOLUTIONS/SERVICES OFFERED 135
      139. TABLE 138 ZUKEN: KEY DEVELOPMENTS 136
      140. TABLE 139 AUCOTEC AG: PRODUCTS/SOLUTIONS/SERVICES/SOLUTIONS/SERVICES OFFERED 138
      141. TABLE 140 AUCOTEC AG: KEY DEVELOPMENTS 138
      142. TABLE 141 WSCAD: PRODUCTS/SOLUTIONS/SERVICES/SOLUTIONS/SERVICES OFFERED 140
      143. TABLE 142 WSCAD: KEY DEVELOPMENTS 140
      144. TABLE 143 MENTOR GRAPHICS: PRODUCTS/SOLUTIONS/SERVICES/SOLUTIONS/SERVICES OFFERED 142
      145. TABLE 144 MENTOR GRAPHICS: KEY DEVELOPMENTS 142
      146. TABLE 145 AUTODESK INC.: PRODUCTS/SOLUTIONS/SERVICES/SOLUTIONS/SERVICES OFFERED 145
      147. TABLE 146 AUTODESK INC.: KEY DEVELOPMENTS 146
      148. TABLE 147 SIENNA ECAD TECHNOLOGIES: PRODUCTS/SOLUTIONS/SERVICES/SOLUTIONS/SERVICES OFFERED 148
      149. TABLE 148 DASSAULT SYSTÈMES SE: PRODUCTS/SOLUTIONS/SERVICES/SOLUTIONS/SERVICES OFFERED 151
      150. TABLE 149 DASSAULT SYSTÈMES SE: KEY DEVELOPMENTS 152
      151. TABLE 150 TRIMBLE INC.: PRODUCTS/SOLUTIONS/SERVICES/SOLUTIONS/SERVICES OFFERED 154
      152. TABLE 151 TRIMBLE INC: KEY DEVELOPMENTS 155
      153. TABLE 152 HEXAGON AB: PRODUCTS: SOLUTIONS/SERVICES/SOLUTIONS/SERVICES OFFERED 157
      154. TABLE 153 HEXAGON AB: KEY DEVELOPMENTS 157
      155. TABLE 154 IGE+XAO GROUP: PRODUCTS: SOLUTIONS/SERVICES/SOLUTIONS/SERVICES OFFERED 160
      156. TABLE 155 IGE+XAO GROUP: KEY DEVELOPMENTS 160
      157. TABLE 156 SIEMENS AG: PRODUCTS: SOLUTIONS/SERVICES/SOLUTIONS/SERVICES OFFERED 163
      158. TABLE 157 SIEMENS AG: KEY DEVELOPMENTS 164
      159. TABLE 158 EPLAN SOFTWARE & SERVICES GMBH & CO. KG: PRODUCTS OFFERING 165
      160. TABLE 159 EPLAN SOFTWARE & SERVICES GMBH & CO. KG: KEY DEVELOPMENTS 166
      161. TABLE 160 BENTLEY SYSTEMS INC.: PRODUCTS OFFERING 168
      162. TABLE 161 BENTLEY SYSTEMS INC.: KEY DEVELOPMENTS 169
      163. TABLE 162 ALPI INTERNATIONAL SOFTWARE SA: PRODUCTS OFFERINGS 171
      164. TABLE 163 ALPI INTERNATIONAL SOFTWARE SA: KEY DEVELOPMENTS 172 15 LIST OF FIGURES
      165. FIGURE 1 MARKET SYNOPSIS 17
      166. FIGURE 2 GLOBAL ELECTRICAL COMPUTER-AIDED DESIGN (ECAD) MARKET, BY COMPONENT, 2020-202718
      167. FIGURE 3 GLOBAL ELECTRICAL COMPUTER-AIDED DESIGN (ECAD) MARKET ANALYSIS, BY INDUSTRY TYPE, 2020-202719
      168. FIGURE 4 GLOBAL ELECTRICAL COMPUTER-AIDED DESIGN (ECAD) MARKET ANALYSIS, BY APPLICATION, 2020-202720
      169. FIGURE 5 GLOBAL ELECTRICAL COMPUTER-AIDED DESIGN (ECAD) MARKET ANALYSIS, BY VERTICAL, 2020-202721
      170. FIGURE 6 GLOBAL ELECTRICAL COMPUTER-AIDED DESIGN (ECAD) MARKET ANALYSIS, BY REGION, 2020 (%) 22
      171. FIGURE 7 GLOBAL ELECTRICAL COMPUTER-AIDED DESIGN (ECAD) MARKET: STRUCTURE 24
      172. FIGURE 8 BOTTOM-UP AND TOP-DOWN APPROACHES 29
      173. FIGURE 9 DROC ANALYSIS OF GLOBAL ELECTRICAL COMPUTER-AIDED DESIGN (ECAD) MARKET 31
      174. FIGURE 10 DRIVERS IMPACT ANALYSIS: GLOBAL ECAD MARKET 33
      175. FIGURE 11 RESTRAINT IMPACT ANALYSIS: GLOBAL ECAD MARKET 34
      176. FIGURE 12 VALUE CHAIN ANALYSIS OF THE GLOBAL ECAD MARKET 37
      177. FIGURE 13 PORTER’S FIVE FORCES ANALYSIS OF THE GLOBAL ECAD MARKET 39
      178. FIGURE 14 GLOBAL ECAD MARKET, BY COMPONENT, 2020 (% SHARE) 41
      179. FIGURE 15 GLOBAL ECAD MARKET, BY COMPONENT, 2020-2027(USD MILLION) 42
      180. FIGURE 16 GLOBAL ECAD MARKET, BY INDUSTRY TYPE, 2020 (% SHARE) 47
      181. FIGURE 17 GLOBAL ECAD MARKET, BY INDUSTRY TYPE, 2020-2027(USD MILLION) 48
      182. FIGURE 18 GLOBAL ECAD MARKET, BY APPLICATION, 2020 (% SHARE) 50
      183. FIGURE 19 GLOBAL ECAD MARKET, BY APPLICATION, 2020-2027(USD MILLION) 51
      184. FIGURE 20 GLOBAL ECAD MARKET, BY VERTICAL, 2020 (% SHARE) 57
      185. FIGURE 21 GLOBAL ECAD MARKET, BY VERTICAL, 2020-2027(USD MILLION) 58
      186. FIGURE 22 GLOBAL ECAD MARKET, BY REGION, 2020 (%) 64
      187. FIGURE 23 NORTH AMERICA ECAD MARKET, BY COUNTRY, 2020-2027(USD MILLION) 65
      188. FIGURE 24 NORTH AMERICA ECAD MARKET, BY COMPONENT, 2020-2027(USD MILLION) 66
      189. FIGURE 25 NORTH AMERICA ECAD MARKET, BY SERVICE, 2020-2027(USD MILLION) 67
      190. FIGURE 26 NORTH AMERICA ECAD MARKET, BY INDUSTRY TYPE, 2020-2027(USD MILLION) 68
      191. FIGURE 27 NORTH AMERICA ECAD MARKET, BY APPLICATION, 2020-2027(USD MILLION) 69
      192. FIGURE 28 NORTH AMERICA ECAD MARKET, BY VERTICAL, 2020-2027(USD MILLION) 70
      193. FIGURE 29 EUROPE ECAD MARKET, BY COUNTRY, 2020-2027(USD MILLION) 79
      194. FIGURE 30 EUROPE ECAD MARKET, BY COMPONENT, 2020-2027(USD MILLION) 80
      195. FIGURE 31 EUROPE ECAD MARKET, BY SERVICE, 2020-2027(USD MILLION) 81
      196. FIGURE 32 EUROPE ECAD MARKET, BY INDUSTRY TYPE, 2020-2027(USD MILLION) 82
      197. FIGURE 33 EUROPE ECAD MARKET, BY APPLICATION, 2020-2027(USD MILLION) 83
      198. FIGURE 34 EUROPE ECAD MARKET, BY VERTICAL, 2020-2027(USD MILLION) 84
      199. FIGURE 35 ASIA-PACIFIC ECAD MARKET, BY COUNTRY, 2020-2027(USD MILLION) 99
      200. FIGURE 36 ASIA-PACIFIC ECAD MARKET, BY COMPONENT, 2020-2027(USD MILLION) 100
      201. FIGURE 37 ASIA-PACIFIC ECAD MARKET, BY SERVICE, 2020-2027(USD MILLION) 101
      202. FIGURE 38 ASIA-PACIFIC ECAD MARKET, BY INDUSTRY TYPE, 2020-2027(USD MILLION) 102
      203. FIGURE 39 ASIA-PACIFIC ECAD MARKET, BY APPLICATION, 2020-2027(USD MILLION) 103
      204. FIGURE 40 ASIA-PACIFIC ECAD MARKET, BY VERTICAL, 2020-2027(USD MILLION) 104
      205. FIGURE 41 REST OF THE WORLD ECAD MARKET, BY COUNTRY, 2020-2027(USD MILLION) 116
      206. FIGURE 42 REST OF THE WORLD ECAD MARKET, BY COMPONENT, 2020-2027(USD MILLION) 117
      207. FIGURE 43 REST OF THE WORLD ECAD MARKET, BY SERVICE, 2020-2027(USD MILLION) 118
      208. FIGURE 44 REST OF THE WORLD ECAD MARKET, BY INDUSTRY TYPE, 2020-2027(USD MILLION) 119
      209. FIGURE 45 REST OF THE WORLD ECAD MARKET, BY APPLICATION, 2020-2027(USD MILLION) 120
      210. FIGURE 46 REST OF THE WORLD ECAD MARKET, BY VERTICAL, 2020-2027(USD MILLION) 121
      211. FIGURE 47 GLOBAL ELECTRICAL COMPUTER-AIDED DESIGN (ECAD) MARKET: VENDOR SHARE ANALYSIS 128
      212. FIGURE 48 NORTH AMERICA ELECTRICAL COMPUTER-AIDED DESIGN (ECAD) MARKET: VENDOR SHARE ANALYSIS 128
      213. FIGURE 49 EUROPE ELECTRICAL COMPUTER-AIDED DESIGN (ECAD) MARKET: VENDOR SHARE ANALYSIS 129
      214. FIGURE 50 ASIA-PACIFIC ELECTRICAL COMPUTER-AIDED DESIGN (ECAD) MARKET: VENDOR SHARE ANALYSIS 129
      215. FIGURE 51 REST OF THE WORLD ELECTRICAL COMPUTER-AIDED DESIGN (ECAD) MARKET: VENDOR SHARE ANALYSIS 130
      216. FIGURE 52 GLOBAL ELECTRICAL COMPUTER-AIDED DESIGN (ECAD) MARKET: COMPETITIVE BENCHMARKING 131
      217. FIGURE 53 ZUKEN: FINANCIAL OVERVIEW SNAPSHOT 135
      218. FIGURE 54 ZUKEN: SWOT ANALYSIS 137
      219. FIGURE 55 AUCOTEC AG: SWOT ANALYSIS 139
      220. FIGURE 56 WSCAD: SWOT ANALYSIS 141
      221. FIGURE 57 MENTOR GRAPHICS: SWOT ANALYSIS 143
      222. FIGURE 58 AUTODESK INC.: FINANCIAL OVERVIEW SNAPSHOT 145
      223. FIGURE 59 AUTODESK INC.: SWOT ANALYSIS 147
      224. FIGURE 60 SIENNA ECAD TECHNOLOGIES: SWOT ANALYSIS 149
      225. FIGURE 61 DASSAULT SYSTÈMES SE: FINANCIAL OVERVIEW SNAPSHOT 151
      226. FIGURE 62 DASSAULT SYSTÈMES SE: SWOT ANALYSIS 152
      227. FIGURE 63 TRIMBLE INC: FINANCIAL OVERVIEW SNAPSHOT 154
      228. FIGURE 64 TRIMBLE INC: SWOT ANALYSIS 155
      229. FIGURE 65 HEXAGON AB: FINANCIAL OVERVIEW SNAPSHOT 156
      230. FIGURE 66 HEXAGON AB: SWOT ANALYSIS 158
      231. FIGURE 67 IGE+XAO GROUP: FINANCIAL OVERVIEW SNAPSHOT 159
      232. FIGURE 68 IGE+XAO GROUP: SWOT ANALYSIS 161
      233. FIGURE 69 SIEMENS AG: FINANCIAL OVERVIEW SNAPSHOT 163
      234. FIGURE 70 SIEMENS AG: SWOT ANALYSIS 164
      235. FIGURE 71 EPLAN SOFTWARE & SERVICES GMBH & CO. KG: SWOT ANALYSIS 167
      236. FIGURE 72 BENTLEY SYSTEMS INC.: SWOT ANALYSIS 170
      237. FIGURE 73 ALPI INTERNATIONAL SOFTWARE SA: SWOT ANALYSIS 173

    Electrical and Electronic Computer-Aided Design (ECAD) Market Segmentation

    Market Segmentation Overview

    • Detailed segmentation data will be available in the full report
    • Comprehensive analysis by multiple parameters
    • Regional and country-level breakdowns
    • Market size forecasts by segment
    Infographic

    Free Sample Request

    Kindly complete the form below to receive a free sample of this Report

    Get Free Sample

    Customer Strories

    “I am very pleased with how market segments have been defined in a relevant way for my purposes (such as "Portable Freezers & refrigerators" and "last-mile"). In general the report is well structured. Thanks very much for your efforts.”

    Victoria Milne

    Founder
    Case Study
    Chemicals and Materials