Electricity Retailing Market

Key Players: EDF Group, E.ON SE, Enel SpA, Engie SA, Iberdrola SA, NextEra Energy, Tokyo Electric Power (TEPCO), Duke Energy

Electricity Retailing Market

Electricity Retailing Market Size, Share & Growth Analysis Report By Tariff Type (Fixed/Flat-Rate, Time-of-Use, Dynamic/Real-Time, Green/Renewable-Backed, Subscription-Based), By End-User (Residential, Commercial, Industrial) and By Regional (North America, Europe, South America, Asia-Pacific, Middle East and Africa) - Trends & Industry Forecast to 2035
ID: MRFR/EnP/33199-HCR
100 Pages
Chitranshi Jaiswal
Last Updated: June 19, 2026

Electricity Retailing Market Summary

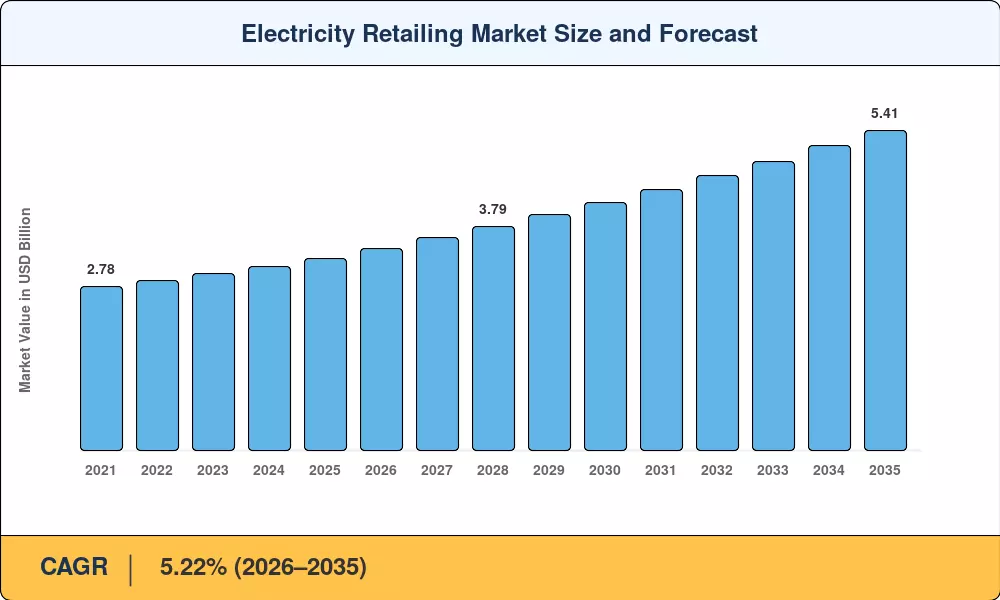
The global electricity retailing market was valued at USD 3.25 trillion in 2025 and is projected to grow from USD 3.42 trillion in 2026 to USD 5.41 trillion by 2035, registering a CAGR of 5.22% during the forecast period (2026–2035). Two structural forces are reshaping revenue trajectories for power retailers: government-mandated decarbonization timelines — the EU's Fit for 55 package alone mobilizes over EUR 300 billion in clean-energy investment through 2030 — and the rapid electrification of transportation, which the IEA projects will add roughly 1,500 TWh of incremental global demand by 2030 [1][2].

Dynamic, digitally enabled tariff structures are replacing legacy supply agreements established for baseload thermal generating. Retailers that have engaged in smart meter rollouts and cloud-based billing platforms currently control more than 400 million advanced metering endpoints worldwide, providing real-time pricing and demand-side flexibility services [3]. Regulatory agencies in OECD countries are tightening consumer-protection responsibilities, requiring merchants to balance tariff innovation and affordability obligations.


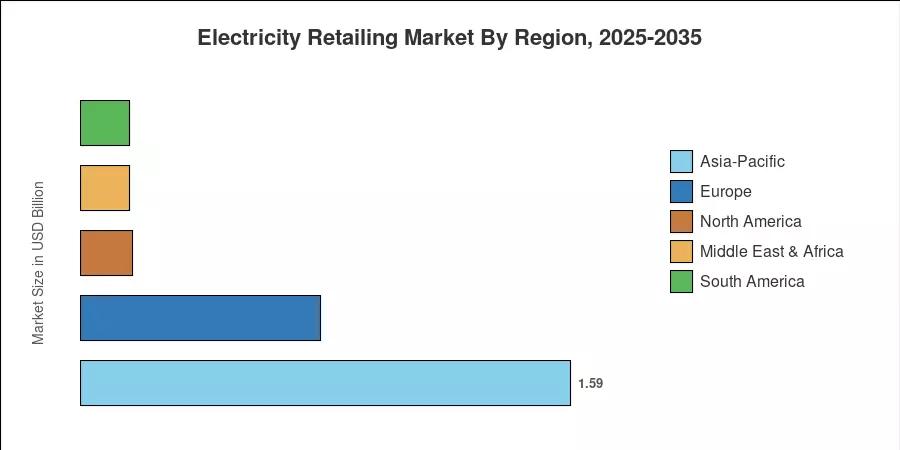
The Asia-Pacific region has the highest share of the electricity retailing industry, with a share of around 49% of the worldwide income, owing to continuing power-sector reform in China and the distribution revamp under UDAY in India. The region is also leading the rise at a predicted CAGR of 6.14%. Europe, which contributes about 24% of worldwide sales and is benefiting from aggressive renewable-integration targets, is next. North America, where data-center load and EV-charging infrastructure build-outs are reshaping peak-demand patterns, makes up the top three.


Key Report Takeaways

• By Tariff Type

  • Fixed/flat-rate tariffs accounted for 47.5% of electricity retailing market revenue in 2025, reflecting consumer preference for bill predictability amid wholesale-price volatility.
  • Green/renewable-backed tariffs are forecast to expand at a 7.92% CAGR through 2035, fueled by corporate ESG commitments and prosumer growth.

• By End-User

  • The industrial segment represented the largest share of the electricity retailing market in 2025, driven by energy-intensive manufacturing clusters in Asia and Europe.
  • Commercial end-users are projected to record a 6.35% CAGR as office electrification, on-site EV charging, and smart-building retrofits accelerate demand.

• By Geography

  • Asia-Pacific led the electricity retailing market with a 49% revenue share in 2025, underpinned by China's provincial retail-pilot expansion and India's open-access reforms.
  • North America is poised for robust expansion as hyperscale data centers and public-charging networks drive unprecedented load growth in key U.S. and Canadian utility territories.


Electricity Retailing Market Size and Forecast (2021–2035)

Market size estimates are based on utility revenue filings, national energy statistics databases (IEA, EIA, Eurostat), and proprietary demand models calibrated using metered consumption data from 45 countries [1][4][5].

Electricity Retailing Market Size and Forecast
Our Impact
Enabled $4.3B Revenue Impact for Fortune 500 and Leading Multinationals
Partnering with 2000+ Global Organizations Each Year
30K+ Citations by Top-Tier Firms in the Industry

Driver Impact Analysis

Driver ~% Impact on CAGR Geographic Relevance Impact Timeline
Transport electrification & EV-charging load ~18% Global Medium-term (2–4 yr)
Renewable-energy integration mandates ~16% Europe, Asia-Pacific Long-term (≥4 yr)
Smart-metering & digital billing platforms ~14% North America, Europe Short-term (≤2 yr)
Data-center hyperscale demand ~13% North America, Nordics Short-term (≤2 yr)
Power-sector deregulation & retail competition ~12% Asia-Pacific, South America Long-term (≥4 yr)
Corporate renewable PPA growth ~10% Global Medium-term (2–4 yr)
Prosumer & distributed-energy expansion ~8% Europe, Australia Medium-term (2–4 yr)


Transport Electrification and EV-Charging Load

Global EV sales surpassed 17 million units in 2024, and the IEA's Global EV Outlook projects a fleet exceeding 250 million vehicles by 2030 [6]. Each battery-electric vehicle adds an estimated 3,000–4,000 kWh of annual consumption, creating a structural uplift for retailers that secure charging-point supply contracts. Public fast-charging networks in the U.S. alone received USD 7.5 billion under the NEVI program, channeling new demand to retail suppliers capable of offering time-of-use or dynamic pricing at the plug [12].

Renewable-Energy Integration Mandates

The EU's revised Renewable Energy Directive targets a 42.5% renewables share by 2030, while China's 14th Five-Year Plan calls for 1,200 GW of combined wind and solar capacity by 2025 [1][2]. These mandates shift the tariff mix toward green-backed products and create margin opportunities for retailers who can certify supply-chain provenance through guarantee-of-origin registries.

Smart-Metering and Digital Billing Platforms

Over 1.4 billion smart meters have been installed globally, with the EU having already implemented aggressive rollout targets (with most member states exceeding 80% coverage) [3]. Granular 15-minute interval data enables retailers to design personalized tariffs and demand-response incentives, improving customer retention rates by an estimated 12–18% compared with flat-rate alternatives [13].


Data-Center Hyperscale Demand

BloombergNEF estimates that global data-center power consumption will reach 508 TWh by 2030 — up from roughly 260 TWh in 2023 [8]. Microsoft's record 10.5 GW renewable PPA with Brookfield illustrates how corporate off-takers are reshaping the electricity retailing market by demanding 24/7 carbon-matched supply, pushing retailers to develop round-the-clock clean-energy products [10].


Restraints Impact Analysis

Restraint ~% Impact on CAGR Geographic Relevance Impact Timeline
Regulated default-tariff caps ~ –5% Europe, South America Short-term (≤2 yr)
Wholesale-price volatility & margin squeeze ~ –4% Global Short-term (≤2 yr)
Prosumer self-consumption erosion ~ –3% Europe, Australia Medium-term (2–4 yr)
Customer-switching inertia in monopoly regions ~ –3% MEA, parts of Asia Long-term (≥4 yr)
Cybersecurity & data-privacy compliance costs ~ –2% North America, Europe Medium-term (2–4 yr)


Regulated Default-Tariff Caps

Price caps such as Ofgem's Energy Price Cap in the UK and France's Tarif Réglementé shield consumers but compress retailer gross margins to as low as 1.5–2.0% in capped segments [14]. Six legacy suppliers controlled roughly 91% of UK retail volumes in 2024, yet several smaller entrants exited the market when cap-induced losses became unsustainable.

Wholesale-Price Volatility

The 2022–2023 European energy crisis demonstrated how spot-price swings exceeding 300% can bankrupt under-hedged retailers within months [5]. Although forward curves have normalized, residual risk premiums continue to elevate working-capital requirements, particularly for new entrants without vertically integrated generation assets.

Prosumer Self-Consumption Erosion

Rooftop solar installations crossed 300 GW globally by 2024 [11]. Each kilowatt-hour self-consumed by a prosumer represents lost retail volume, and battery-storage attach rates above 30% in markets like Australia and Germany amplify grid-defection risk for volume-dependent retailers.


Electricity Retailing Market Opportunities

Bundled Energy-as-a-Service Models

Retailers that combine electricity supply with EV-charging subscriptions, home-battery leasing, and smart-thermostat management can lift customer lifetime value by 25–40% [13]. Such bundling transforms the retailer from a commodity supplier into a platform operator, a shift already demonstrated by Octopus Energy's rapid European expansion.

Emerging-Market Deregulation

India’s state-level open-access reforms are expanding competitive supply options for industrial consumers, though timelines for full retail competition remain phased. Similarly, Brazil’s recent regulatory updates, including Law No. 15,269/2025, have modernized the framework for self-production and energy storage, creating new competitive entry points in the free energy market.


Grid-Edge Flexibility Monetization

Virtual Power Plants (VPPs) aggregating distributed batteries, heat pumps, and smart loads are emerging as a critical resource for grid stability. Retailers positioned as flexibility aggregators can earn capacity and balancing-market revenues, helping to transition business models toward service-based income rather than volume-dependent sales.


AI-Driven Customer Analytics and Dynamic Pricing

Machine-learning models trained on interval meter data can forecast individual household demand with 92–95% accuracy, enabling real-time tariff personalization [17]. Retailers deploying such platforms report churn reductions of 15% and gross-margin improvements of 50–80 basis points per customer.

Cross-Border Renewable Certificate Trading

Digital platforms using distributed ledger technology (DLT) are increasingly used to streamline the verification of Guarantees of Origin (GOs). While still in the early stages of adoption, these technologies reduce the administrative friction and transaction costs associated with cross-border green-attribute trading, allowing retailers to serve corporate demand for renewable supply better.


Electricity Retailing Market Future Outlook

AI-Optimized Retail Operations

Generative AI and predictive analytics platforms are set to significantly increase the automation of routine customer interactions, such as billing inquiries and outage notifications, by 2030. Retailers integrating large-language-model (LLM) chatbots with real-time metering data are expected to lower cost-to-serve by an estimated USD 3–5 per customer annually, helping to protect margins in competitive retail markets.


Platform Economics and Energy Aggregation

Platform models where retailers aggregate distributed generation, storage, and demand-side resources are evolving supply businesses into two-sided marketplaces. By the early 2030s, the scaling of flexibility markets managed by aggregator-retailers is expected to represent a major shift in grid management. Early movers like Octopus Energy and Next Kraftwerke have already demonstrated that platform-based operations can dramatically lower customer-acquisition costs compared to traditional, volume-only models.


Electrification Supercycle

The IEA's 2024 World Energy Outlook forecasts global electricity demand to rise 75% by 2050, with transport and heating electrification comprising over half of incremental consumption [1]. This supercycle guarantees volume growth for the electricity retailing market, but shifts competitive advantage toward retailers with flexible sourcing portfolios that can manage intermittent renewable supply while meeting 24/7 matching requirements.

ESG Reporting and Scope 2 Compliance

Mandatory climate-disclosure regimes — the EU's CSRD, the SEC's climate-risk rule, and ISSB standards — compel corporate buyers to demonstrate verifiable Scope 2 emission reductions [20]. Retailers offering hourly-matched green supply backed by independently audited certificate chains will capture premium pricing, embedding ESG compliance as a growth lever within the electricity retailing market through 2035.


Electricity Retailing Market Segmentation

By Tariff Type

Segment Key Metric Primary Demand Driver
Fixed/Flat-Rate 47.5% share (2025) Consumer preference for bill certainty
Time-of-Use USD 0.52 T (2025) Smart-meter rollouts enabling peak/off-peak splits
Dynamic/Real-Time 6.85% CAGR Data-center and industrial demand flexibility
Green/Renewable-Backed 7.92% CAGR Corporate ESG mandates, prosumer preferences
Subscription-Based USD 0.10 T (2025) Fintech-style flat-fee energy plans


Fixed/flat-rate tariffs remain the backbone of the electricity retailing market because most residential consumers prioritize budget predictability over potential savings from variable plans. Utilities in regulated U.S. states and much of Asia still default customers to flat structures, cementing this segment's volume dominance. Green/renewable-backed tariffs represent the fastest-growing segment, propelled by over 400 RE100 corporate signatories committing to 100% renewable electricity by 2030 [10]. Subscription-based tariffs — pioneered by Finnish retailer Fortum and replicated across Scandinavia — offer unlimited consumption for a fixed monthly fee, attracting digitally savvy younger demographics.

By End-User

Segment Key Metric Primary Demand Driver
Industrial 46.0% share (2025) Energy-intensive manufacturing, process heat electrification
Commercial 6.35% CAGR Building retrofits, on-site EV-charging
Residential USD 0.88 T (2025) Population growth, appliance electrification


Industrial consumers dominate the electricity retailing market by volume, with steel, aluminum, chemical, and semiconductor fabrication facilities anchoring long-term supply contracts that often exceed 10 years and 100 GWh annually. The commercial segment is growing fastest as office-building operators, retail chains, and hospitality groups electrify heating, cooking, and fleet vehicles simultaneously. Retailers targeting commercial accounts increasingly bundle energy management, demand-response participation, and carbon reporting into single contracts valued at 15–25% premiums over commodity-only supply.


Regional Market Share Analysis

Region Key Metric Primary Investment Themes
Asia-Pacific 49.0% revenue share (2025) Provincial retail-pilot expansion, industrial electrification
Europe USD 0.78 T (2025) Green-tariff mandates, prosumer integration
North America 5.38% CAGR (2026–2035) Data-center load, EV infrastructure
South America USD 0.16 T (2025) Free-consumer threshold reform
Middle East & Africa 4.85% CAGR (2026–2035) IPP diversification, prepaid-meter rollout
Total USD 3.25 T (2025)

The electricity retailing market exhibits pronounced regional variation driven by deregulation timelines, fuel-mix composition, and per-capita consumption levels.


North America

Country Key Metric Key Driver
United States 78% of regional revenue Competitive retail states (TX, OH, PA)
Canada 5.62% CAGR Alberta deregulation, clean-grid targets
Mexico USD 0.02 T (2025) CFE reform, industrial open-access expansion


The U.S. electricity retailing market spans fully deregulated states where dozens of competitive suppliers operate alongside regulated vertically integrated utilities. Texas' ERCOT zone alone processed over 25 million customer switches cumulatively by 2024, making it one of the world's most liquid retail power markets [19]. Canada's competitive provinces — Alberta and Ontario — pursue parallel liberalization agendas, while Mexico's industrial consumers increasingly access private-generator supply under bilateral contracts.

Europe

Country Key Metric Key Driver
Germany 28% of regional revenue Energiewende, prosumer density
United Kingdom 5.10% CAGR Ofgem cap reform, green-tariff proliferation
France USD 0.11 T (2025) TRV phase-down for commercial users
Italy 4.95% CAGR Servizio a tutele graduali transition
Spain 12% of regional revenue Renewable-auction contracts, self-consumption law
Nordic Countries 5.45% CAGR Hourly-settled retail, data-center demand
Russia USD 0.04 T (2025) Regulated wholesale, limited retail choice
Rest of Europe 4.70% CAGR Eastern EU liberalization


Europe's electricity retailing market is shaped by the EU's Clean Energy Package, which requires member states to ensure every consumer can freely choose and switch supplier without penalty [14]. The UK's 2025 Ofgem price-cap recalibration, moving to quarterly updates, introduced faster pass-through of wholesale reductions but maintained margin constraints for incumbent retailers.

Asia-Pacific

Country Key Metric Key Driver
China 52% of regional revenue Provincial spot-market pilots
India 6.50% CAGR Open-access industrial reform
Japan USD 0.15 T (2025) Full liberalization since 2016
South Korea 4.90% CAGR KEPCO unbundling discussions
ASEAN 5.80% CAGR Cross-border power trading
Rest of Asia-Pacific USD 0.06 T (2025) Prepaid-metering expansion


China's ongoing electricity-market reform — piloting spot trading in Guangdong, Zhejiang, and Shandong — is progressively exposing industrial and commercial load to competitive retail pricing [9]. India's electricity retailing market opportunity centers on open-access thresholds: states lowering the contract-demand floor to 100 kVA open millions of commercial connections to third-party supply.

South America

Country Key Metric Key Driver
Brazil 72% of regional revenue Free-consumer expansion
Argentina 4.55% CAGR Tariff-subsidy phase-out
Rest of South America USD 0.01 T (2025) Gradual deregulation efforts


Brazil's progressive reduction of the free-consumer eligibility threshold from 500 kW to 75 kW by 2024 — with full residential opening expected by 2028 — stands as Latin America's most consequential retail-reform initiative [9]. Argentina's subsidy rationalization program is gradually exposing end-users to cost-reflective tariffs, expanding addressable volume for independent suppliers.

Middle East & Africa

Country Key Metric Key Driver
Saudi Arabia 34% of regional revenue Vision 2030 IPP procurement
UAE 5.15% CAGR Emirate-level tariff diversification
South Africa USD 0.03 T (2025) Eskom unbundling, municipal retail reform
Egypt 4.60% CAGR Subsidy removal, private-sector entry
Rest of MEA USD 0.01 T (2025) Prepaid-meter adoption


The Middle East and Africa electricity retailing market remains largely utility-dominated, though structural reform is accelerating. Saudi Arabia's Power Procurement Company is centralizing wholesale purchasing while allowing downstream competition among distribution entities, and South Africa's planned transmission-entity separation from Eskom creates a future pathway for retail electricity supplier comparison and competitive supply.


Electricity Retailing Market By Region, 2025-2035

Competitive Benchmarking

The power retailing market is internationally not very concentrated – the Herfindahl-Hirschman Index is below 800 globally – but it can be highly concentrated on a national basis. The top five global retailers account for an estimated 18–24% of overall market revenue, indicating the underlying geographic and regulatory dispersion of retail electricity delivery.

Company Est. Revenue Share Range Key Offerings Strategic Positioning
EDF Group ~4–6% Regulated & competitive supply, nuclear-backed green tariffs Vertically integrated, dominant in France and the UK
E.ON SE ~3–5% Residential/commercial supply, smart-home energy services Pan-European customer platform, post-Innogy integration
Enel SpA ~3–5% Global retail operations, green-power plans, e-mobility Multi-continental reach across Europe and Latin America
Engie SA ~2–4% B2B energy management, decentralized energy solutions Commercial and industrial focus, energy-as-a-service
Iberdrola SA ~2–4% Renewable-backed retail supply, EV infrastructure Green-generation vertical integration, UK/US presence
NextEra Energy ~2–3% Competitive retail (Gexa/Direct Energy brands), renewable PPAs Largest U.S. renewable operator, retail/generation synergy
Tokyo Electric Power (TEPCO) ~2–3% Residential and industrial supply, regulated tariffs Dominant in Greater Tokyo, post-liberalization adaptation
Duke Energy ~1–3% Regulated retail supply, grid modernization programs Southeast U.S. franchise territory, rate-base growth
Origin Energy ~1–2% Dual-fuel retail, solar/battery bundling, Octopus platform Leading Australian retailer, Octopus Tech Partnership
AGL Energy ~1–2% Multi-fuel retail, demand response, VPP aggregation Largest Australian generator-retailer, demerger-restructured


Recent News & Developments


  • Microsoft & Brookfield (September 2024): Finalized a 10.5 GW global renewable PPA — the largest single-buyer contract to date — establishing a benchmark for 24/7 clean-energy procurement in the electricity retailing market [10].
  • Ofgem (July 2024): Transitioned the UK energy price cap to quarterly recalibration, tightening wholesale-price pass-through windows for British retail suppliers [14].
  • India Ministry of Power (April 2024): Issued draft Electricity (Promoting Renewable Energy Through Green Energy Open Access) Rules, lowering open-access thresholds and expanding competitive supply eligibility [9].


Electricity Retailing Market Report Scope

Parameter Detail
Market Scope Global electricity retailing market — retail supply of electric power to end-users across all tariff types and customer segments
Study Period 2021–2035
CAGR 5.22% (2026–2035)
Market Size (2025) USD 3.25 Trillion
Market Size (2035) USD 5.41 Trillion
Fastest Growing Segment Green/Renewable-Backed Tariffs (by tariff type); Commercial (by end-user)
Companies Profiled 10 (EDF, E.ON, Enel, Engie, Iberdrola, NextEra Energy, TEPCO, Duke Energy, Origin Energy, AGL Energy)
Valuation Currency USD (constant 2025 dollars)


FAQs

How does a wholesale hedging strategy affect retail-supplier profitability?

Retailers that lock in 70–80% of expected volume through forward contracts can stabilize margins at 3–5%, while under-hedged competitors face insolvency risk during price spikes [5]. Hedging discipline is the single largest determinant of retail-supplier financial viability.

What role do white-label platforms play in lowering barriers to entry?

Cloud-based platforms like Kraken (Octopus) and Gorilla allow new entrants to launch retail operations without building proprietary billing or CRM systems [21]. This reduces time-to-market from 18 months to under 6 months.

How do capacity-market obligations reshape retailer cost structures?

Mechanisms like Texas's Performance Credit Mechanism add USD 2–4 per MWh in reliability charges to retailer supply costs [19]. These obligations favor vertically integrated suppliers with generation assets.

What distinguishes a green tariff from a standard renewable PPA?

Green tariffs are regulated retail products where the utility sources renewable energy on behalf of the customer, whereas PPAs are bilateral contracts directly between a buyer and generator [10]. Tariffs suit smaller buyers; PPAs fit large corporates.

How will vehicle-to-grid technology affect the electricity retailing market?

V2G-capable EVs can discharge stored energy during peak hours, and retailers managing these fleets earn arbitrage revenue of USD 200–400 per vehicle annually [6]. Early pilot results show load-shifting potential of 5–8 kW per connected vehicle.

What cybersecurity risks do smart-meter rollouts introduce for retailers?

Each connected endpoint is a potential intrusion vector, and NIST estimates remediation costs at USD 2–5 million per incident for mid-tier retailers [15]. Encryption-at-rest and over-the-air firmware patching are now regulatory prerequisites.

How are prepaid metering models expanding in developing economies?

Sub-Saharan Africa and South Asia deployed over 80 million prepaid meters by 2024, reducing non-technical losses by 15–20% [4]. Prepaid models convert non-paying connections into revenue-generating accounts for retailers.


Author
Author
Author Profile
Chitranshi Jaiswal LinkedIn
Team Lead - Research
Chitranshi is a Team Leader in the Chemicals & Materials (CnM) and Energy & Power (EnP) domains, with 6+ years of experience in market research. She leads and mentors teams to deliver cross-domain projects that equip clients with actionable insights and growth strategies. She is skilled in market estimation, forecasting, competitive benchmarking, and both primary & secondary research, enabling her to turn complex data into decision-ready insights. An engineer and MBA professional, she combines technical expertise with strategic acumen to solve dynamic market challenges. Chitranshi has successfully managed projects that support market entry, investment planning, and competitive positioning, while building strong client relationships. Certified in Advanced Excel & Power BI she leverages data-driven approaches to ensure accuracy, clarity, and impactful outcomes.

Research Approach


Secondary Research

The secondary research process involved comprehensive analysis of regulatory databases, energy sector publications, industry reports, and authoritative government organizations. Key sources included the US Federal Energy Regulatory Commission (FERC), US Energy Information Administration (EIA), European Commission Directorate-General for Energy (DG ENER), International Energy Agency (IEA), International Renewable Energy Agency (IRENA), US Department of Energy (DOE), National Association of Regulatory Utility Commissioners (NARUC), European Network of Transmission System Operators for Electricity (ENTSO-E), World Energy Council, International Atomic Energy Agency (IAEA), OECD Nuclear Energy Agency, US National Renewable Energy Laboratory (NREL), European Environment Agency (EEA), Australian Energy Market Commission (AEMC), UK Office of Gas and Electricity Markets (Ofgem), Japan Agency for Natural Resources and Energy (ANRE), China National Energy Administration (NEA), India Central Electricity Authority (CEA), Brazil National Electric Energy Agency (ANEEL), and national energy ministry reports from key markets. These sources were used to collect electricity consumption statistics, regulatory framework data, tariff structures, smart grid deployment metrics, renewable energy integration trends, and competitive landscape analysis for utility companies, retail electric providers, and resellers across fixed rate, variable rate, time-of-use, and green energy plans.


Primary Research

In order to gather both qualitative and quantitative insights, supply-side and demand-side stakeholders were interviewed during the primary research process. CEOs, VPs of strategy, directors of regulatory affairs, and chief commercial officers from independent power producers, utility corporations, and electricity retailers were examples of supply-side sources. Procurement directors from commercial and industrial businesses, facilities managers from government agencies, energy consultants, and sustainability officials from major residential property management companies were examples of demand-side suppliers. Primary research verified timescales for the renewable energy transition, validated market segmentation across market structures, and acquired information on the evolution of pricing strategies, adoption trends of smart meters, and the dynamics of regulatory compliance.

Primary Respondent Breakdown:

By Designation: C-level Primaries (32%), Director Level (31%), Others (37%)

By Region: North America (38%), Europe (30%), Asia-Pacific (25%), Rest of World (7%)


Market Size Estimation

Global market valuation was derived through revenue mapping and electricity consumption volume analysis. The methodology included:

Identification of 50+ key electricity retailers and utility companies across North America, Europe, Asia-Pacific, Latin America, and Middle East & Africa

Product mapping across fixed rate plans, variable rate plans, time-of-use plans, and green energy plans

Customer segmentation analysis across residential, commercial, industrial, and government sectors

Analysis of reported and modeled annual revenues specific to electricity retailing portfolios

Coverage of market players representing 75-80% of global market share in 2024

Extrapolation using bottom-up (consumption volume × average selling price by country and customer type) and top-down (retailer revenue validation) approaches to derive segment-specific valuations for resellers, utility companies, and retail electric providers

Download Free Sample

Kindly complete the form below to receive a free sample of this Report

Download PDF ×

We do not share your information with anyone. However, we may send you emails based on your report interest from time to time. You may contact us at any time to opt-out.